QNBFS Weekly Market Report August 11, 2016
•
0 likes•139 views

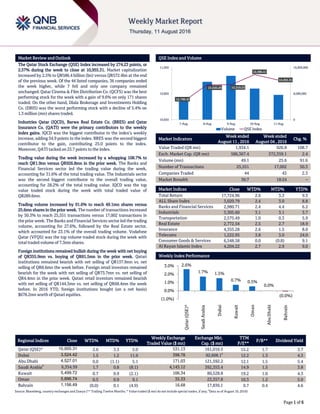
The Qatar Stock Exchange (QSE) Index increased by 274.23 points, or 2.57% during the week to close at 10,955.31.

Recommended
More Related Content
What's hot
What's hot (20)
Viewers also liked
Viewers also liked (15)
Similar to QNBFS Weekly Market Report August 11, 2016
Similar to QNBFS Weekly Market Report August 11, 2016 (20)
More from QNB Group
More from QNB Group (20)
Recently uploaded
Recently uploaded (20)
QNBFS Weekly Market Report August 11, 2016
- 1. ` Page 1 of 6 Market Review and Outlook QSE Index and Volume The Qatar Stock Exchange (QSE) Index increased by 274.23 points, or 2.57% during the week to close at 10,955.31. Market capitalization increased by 2.5% to QR586.4 billion (bn) versus QR572.4bn at the end of the previous week. Of the 44 listed companies, 36 companies ended the week higher, while 7 fell and only one company remained unchanged. Qatar Cinema & Film Distribution Co. (QCFS) was the best performing stock for the week with a gain of 9.6% on only 171 shares traded. On the other hand, Dlala Brokerage and Investments Holding Co. (DBIS) was the worst performing stock with a decline of 5.4% on 1.3 million (mn) shares traded. Industries Qatar (IQCD), Barwa Real Estate Co. (BRES) and Qatar Insurance Co. (QATI) were the primary contributors to the weekly index gains. IQCD was the biggest contributor to the index’s weekly increase, adding 54.9 points to the index. BRES was the second biggest contributor to the gain, contributing 25.0 points to the index. Moreover, QATI tacked on 23.7 points to the index. Trading value during the week increased by a whopping 108.7% to reach QR1.9nn versus QR926.8mn in the prior week. The Banks and Financial Services sector led the trading value during the week, accounting for 31.6% of the total trading value. The Industrials sector was the second biggest contributor to the overall trading value, accounting for 28.2% of the total trading value. IQCD was the top value traded stock during the week with total traded value of QR289.6mn. Trading volume increased by 91.6% to reach 49.1mn shares versus 25.6mn shares in the prior week. The number of transactions increased by 50.3% to reach 25,551 transactions versus 17,002 transactions in the prior week. The Banks and Financial Services sector led the trading volume, accounting for 27.6%, followed by the Real Estate sector, which accounted for 23.1% of the overall trading volume. Vodafone Qatar (VFQS) was the top volume traded stock during the week with total traded volume of 7.3mn shares. Foreign institutions remained bullish during the week with net buying of QR355.9mn vs. buying of QR81.5mn in the prior week. Qatari institutions remained bearish with net selling of QR137.9mn vs. net selling of QR8.6mn the week before. Foreign retail investors remained bearish for the week with net selling of QR73.7mn vs. net selling of QR4.4mn in the prior week. Qatari retail investors remained bearish with net selling of QR144.3mn vs. net selling of QR68.4mn the week before. In 2016 YTD, foreign institutions bought (on a net basis) $678.2mn worth of Qatari equities. Market Indicators Week ended August 11 , 2016 Week ended August 04 , 2016 Chg. % Value Traded (QR mn) 1,934.1 926.8 108.7 Exch. Market Cap. (QR mn) 586,367.4 572,359.1 2.4 Volume (mn) 49.1 25.6 91.6 Number of Transactions 25,551 17,002 50.3 Companies Traded 44 43 2.3 Market Breadth 36:7 18:24 – Market Indices Close WTD% MTD% YTD% Total Return 17,724.96 2.6 3.3 9.3 ALL Share Index 3,020.79 2.4 3.0 8.8 Banks and Financial Services 2,980.71 2.4 4.4 6.2 Industrials 3,305.60 3.1 3.1 3.7 Transportation 2,575.49 1.0 0.3 5.9 Real Estate 2,772.54 2.5 2.7 18.9 Insurance 4,355.28 2.6 1.5 8.0 Telecoms 1,222.95 3.8 3.0 24.0 Consumer Goods & Services 6,548.58 0.0 (0.8) 9.1 Al Rayan Islamic Index 4,204.22 2.7 2.9 9.0 Market Indices Weekly Index Performance Regional Indices Close WTD% MTD% YTD% Weekly Exchange Traded Value ($ mn) Exchange Mkt. Cap. ($ mn) TTM P/E** P/B** Dividend Yield Qatar (QSE)* 10,955.31 2.6 3.3 5.0 531.13 161,016.5 15.2 1.7 3.7 Dubai 3,524.42 1.5 1.2 11.9 398.78 92,608.1# 12.2 1.3 4.3 Abu Dhabi 4,527.01 0.0 (1.1) 5.1 171.03 121,592.2 12.1 1.5 5.4 Saudi Arabia# 6,354.59 1.7 0.8 (8.1) 4,143.12 392,353.4 14.9 1.5 3.8 Kuwait 5,499.72 0.7 0.9 (2.1) 106.34 80,528.8 19.2 1.0 4.3 Oman 5,896.74 0.5 0.9 9.1 35.33 23,357.8 10.3 1.2 5.0 Bahrain 1,156.49 (0.0) 0.1 (4.9) 16.68 17,836.1 9.7 0.4 4.6 Source: Bloomberg, country exchanges and Zawya (** Trailing Twelve Months; * Value traded ($ mn) do not include special trades, if any; # Data as of August 10, 2016) 10,789.43 10,920.29 10,918.53 10,996.41 10,955.31 0 8,000,000 16,000,000 10,650 10,850 11,050 7-Aug 8-Aug 9-Aug 10-Aug 11-Aug Volume QSE Index 2.6% 1.7% 1.5% 0.7% 0.5% 0.0% (0.0%) (1.0%) 0.0% 1.0% 2.0% 3.0% Qatar(QSE)* SaudiArabia Dubai Kuwait Oman AbuDhabi Bahrain
- 2. Page 2 of 6 News Market News MPHC’s bottom-line jumps 30.6% QoQ in 2Q2016 – Qatar Petroleum’s subsidiary, Mesaieed Petrochemical Holding Company’s (MPHC) bottom-line jumped 30.6% QoQ to QR277.3mn in 2Q2016. The QoQ growth in profit was primarily aided by share of profits from joint ventures which grew 30.4% QoQ to QR252.3mn in 2Q2016 from QR193.5mn in 1Q2016, along with the recognition of a tax refund of QR25.5mn in 2Q2016. However, the net profit declined 3.2% on YoY basis. Earnings per share for the period 1H2016 amounted to QR0.39 as compared to QR0.32 in 1H2015. MPHC, the holding company of Q-Chem, Q-Chem II, Ras Laffan Olefins Company and QVC, said the group continued to benefit from the supply of competitively priced ethane feedstock and fuel gas under long- term supply agreements. MPHC added that this contracting arrangement is an important value driver for the group’s profitability under volatile market conditions. (QSE, QNBFS Research, Gulf-Times.com) DBIS’ profitability improves in 2Q2016 driven by reversal of AFS impairments – Dlala Brokerage & Investments Holding Company (DBIS) reported a 2Q2016 net profit of QR0.8mn, representing an 81.2% QoQ increase from QR0.4mn in 1Q2016. The company had reported a net loss of QR23.4mn in 2Q2015. The company’s net brokerage & commission income declined 16.8% QoQ and 40.3% YoY to QR5.0mn in 2Q2016. QR5.2mn in investment losses meant that net operating income for 2Q2016 also declined to QR3.4mn vs. QR12.9mn in 1Q2016 and QR14.3mn in the same quarter last year. The boost in earnings in 2Q2016 was primarily driven by reversal of AFS impairments to the tune of QR2.4mn; the company posted impairment losses of QR30.2mn and QR6.6mn in 2Q2015 and 1Q2016, respectively. Earnings per share amounted to QR0.028 in 2Q2016 as compared to QR0.020 in 1Q2016. (QSE, QNBFS Research) QISI’s bottom-line declines 38.8% QoQ in 2Q2016 – Qatar Islamic Insurance Company (QISI) reported a 2Q2016 net profit of QR13.6mn, indicating a decline of 38.8% QoQ and 19.8% YoY. The company’s total revenue declined 15.6% QoQ to QR25.8mn in 2Q2016, while it rose 2.7% on a YoY basis. Earnings per share came in at QR2.38 in 1H2016 as compared to QR3.35 in 1H2015. (QSE, QNBFS Research) MCGS’ net profit rises 17.2% QoQ in 2Q2016 – Medicare Group’s (MCGS) 2Q2016 net profit rose 17.2% QoQ to QR16.6mn. However, the net profit declined by 64.5% YoY. The company’s operating income increased by 2.8% QoQ to QR121.5mn in 2Q2016, but fell by 21.4% on YoY basis. Earnings per share stood at QR1.09 in 1H2016 as compared to QR3.41 in 1H2015. The decline in profitability thus far this year vs. last year is driven by lower revenue given the impact of the suspension of the Seha program while operating costs remain sticky and income from deposits has more than halved to QR298.0mn vs. QR600.6mn in 1H2015. (QSE, QNBFS Research) MCCS’ net profit declines 24.5% QoQ in 2Q2016 – Mannai Corporation’s (MCCS) net profit declined 24.5% QoQ and 15.0% YoY to QR94.5mn in 2Q2016. Earnings per share amounted to QR4.81 in 1H2016 as compared to QR6.06 in 1H2015. The company’s revenue declined 3.2% QoQ and 17.5% YoY in 2Q2016 to QR1,228.3mn. A company spokesperson said the net profit decline was due to depressed market conditions in the retail/luxury segment and general economic slowdown. However, with diversified earnings potential from across the various business segments and geographies the group is cautiously optimistic of the future. The company concluded the acquisition of majority stake in GFI Informatique, a public listed company in France during the current year. (QSE, QNBFS Research, Gulf-Times.com) MERS records net profit of QR52.9mn in 2Q2016 – Al Meera Consumer Goods Company (MERS) posted 2Q2016 net profit of QR52.9mn, indicating growth of 7.2% QoQ. However, the net profit declined 8.4% YoY. The company’s revenue rose 10.6% QoQ and 8.0% YoY to QR708.9mn in 2Q2016. Other income declined 70.8% QoQ and 21.0% YoY to QR3.0mn. (QSE, QNBFS Research) DOHI reports QR1.5mn loss in 2Q2016 – Doha Insurance (DOHI) reported a net loss of QR1.5mn in 2Q2016 as compared to a net profit of QR22.4mn in 1Q2016 (net profit of QR19.1mn in 2Q2015). The company’s 2Q2016 net premiums increased by 11.2% QoQ and 13.5% YoY to QR49.67mn. (QSE, QNBFS Research) QNB Group: Oil at $60 probable in medium term – QNB Group said in a report that the oil markets may rebalance in 2017 with a price of $60/barrel “probably within range” in the medium term. Oil prices have had an eventful 2016. QNB Group said they started the year on a downward trend, falling to a low of $28/b in late January on concerns about slowing global growth and currency devaluation risk in China, in its weekly economic commentary. Prices then recovered to around $50/b by mid- year only to moderate to their year-to-date average of $42/b. Given the stronger-than-expected rebalancing currently underway in the oil market, QNB Group has revised up its forecast and currently expects prices to average $44.7/b in 2016, up from its previous forecast of $40.8/b. Beyond that, QNB Group expects the continued rebalancing in the oil market to lift prices to an average of $55/b in 2017 (up from a previous forecast of $51.3/b) and $57.9/b in 2018 (up from USD56/b). (Gulf-Times.com)
- 3. Page 3 of 6 Qatar Stock Exchange Top Gainers Top Decliners Source: Qatar Stock Exchange (QSE) Source: Qatar Stock Exchange (QSE) Most Active Shares by Value (QR Million) Most Active Shares by Volume (Million) Source: Qatar Stock Exchange (QSE) Source: Qatar Stock Exchange (QSE) Investor Trading Percentage to Total Value Traded Net Traded Value by Nationality (QR Million) Source: Qatar Stock Exchange (QSE) Source: Qatar Stock Exchange (QSE) 9.6% 8.8% 7.2% 7.2% 6.4% 0.0% 4.0% 8.0% 12.0% Qatar Cinema & Film Distribution Al Khaliji Vodafone Qatar United Development Commercial Bank of Qatar -5.4% -3.1% -1.6% -1.3% -1.2% -6.0% -4.0% -2.0% 0.0% Dlala Holding MedicareGroup Qatar Islamic Insurance Qatar Industrial Manufacturing Qatar General Insurance& Reinsurance 289.6 163.0 138.2 137.6 104.2 0.0 100.0 200.0 300.0 Industries Qatar Ooredoo Qatar Islamic Bank Masraf Al Rayan QNB Group 7.3 4.0 3.9 3.7 2.7 0.0 3.0 6.0 9.0 Vodafone Qatar Mazaya Qatar Ezdan Real Estate Masraf Al Rayan Mesaieed Petrochemical Holding Company 0% 20% 40% 60% 80% 100% Buy Sell 30.28% 37.74% 26.68% 33.81% 10.23% 14.05% 32.80% 14.40% Qatari Individuals Qatari Institutions Non-Qatari Individuals Non-Qatari Institutions 1,102 832 1,384 550 (282) 282 (500) - 500 1,000 1,500 Qatari Non-Qatari Net Investment Total Sold Total Bought
- 4. Page 4 of 6 TECHNICAL ANALYSIS OF THE QSE INDEX Source: Bloomberg The QSE Index closed up another week by 2.57% at and closed at 10,955.31 vs the week before. We mentioned in previous reports that the breach above the downtrend line was positive. That was confirmed with higher traded volumes this week, which is positive. The overall up move could continue even though intermediate corrections may occur as the Index was in an uptick for the past 8 out of 10 weeks. Our expected resistance level remains at 11,200 points but we update the support at the 10,200 level on weekly chart. DEFINITIONS OF KEY TERMS USED IN TECHNICAL ANALYSIS RSI (Relative Strength Index) indicator – RSI is a momentum oscillator that measures the speed and change of price movements. The RSI oscillates between 0 to 100. The index is deemed to be overbought once the RSI approaches the 70 level, indicating that a correction is likely. On the other hand, if the RSI approaches 30, it is an indication that the index may be getting oversold and therefore likely to bounce back. MACD (Moving Average Convergence Divergence) indicator – The indicator consists of the MACD line and a signal line. The divergence or the convergence of the MACD line with the signal line indicates the strength in the momentum during the uptrend or downtrend, as the case may be. When the MACD crosses the signal line from below and trades above it, it gives a positive indication. The reverse is the situation for a bearish trend. Candlestick chart – A candlestick chart is a price chart that displays the high, low, open, and close for a security. The ‘body’ of the chart is portion between the open and close price, while the high and low intraday movements form the ‘shadow’. The candlestick may represent any time frame. We use a one-day candlestick chart (every candlestick represents one trading day) in our analysis. Doji candlestick pattern – A Doji candlestick is formed when a security's open and close are practically equal. The pattern indicates indecisiveness, and based on preceding price actions and future confirmation, may indicate a bullish or bearish trend reversal. Shooting Star/Inverted Hammer candlestick patterns – These candlestick patterns have a small real body (open price and close price are near to each other), and a long upper shadow (large intraday movement on the upside). The Shooting Star is a bearish reversal pattern that forms after a rally. The Inverted Hammer looks exactly like a Shooting Star, but forms after a downtrend. Inverted Hammers represent a potential bullish trend reversal.
- 5. Page 5 of 6 Source: Bloomberg Company Name Price (August 11) % Change WTD % Change YTD Market Cap. QR Million TTM P/E P/B Div. Yield Qatar National Bank 156.80 1.16 7.52 131,661 11.0 2.1 2.2 Qatar Islamic Bank 113.00 2.73 5.90 26,701 12.6 1.7 3.8 Commercial Bank of Qatar 41.90 6.35 (8.71) 13,686 20.1 1.0 7.2 Doha Bank 37.85 1.20 (14.94) 9,779 8.4 1.1 7.9 Al Ahli Bank 42.00 4.22 (4.23) 8,014 12.5 1.7 3.6 Qatar International Islamic Bank 65.20 1.88 1.40 9,869 12.5 1.8 6.1 Masraf Al Rayan 37.80 2.30 0.53 28,350 13.4 2.4 4.6 Al Khalij Commercial Bank 18.49 8.76 2.89 6,656 10.3 1.0 5.4 Qatar First Bank 11.95 0.42 N/A 2,390 N/A N/A N/A National Leasing 18.20 2.25 29.08 901 N/A 0.9 2.7 Dlala Holding 24.32 (5.37) 31.53 691 N/A 2.0 N/A Qatar & Oman Investment 11.50 3.14 (6.50) 362 31.0 1.2 5.2 Islamic Holding Group 67.90 3.98 (13.72) 385 329.0 2.8 2.2 Banking and Financial Services 239,445 Zad Holding 90.50 0.33 6.72 1,184 12.3 1.4 4.4 Qatar German Co. for Medical Devices 12.37 1.81 (9.84) 143 N/A 1.4 N/A Salam International Investment 12.07 2.72 2.12 1,380 11.9 0.8 8.3 Medicare Group 92.40 (3.14) (22.55) 2,601 22.6 2.6 1.9 Qatar Cinema & Film Distribution 35.50 9.57 4.41 223 14.7 1.7 4.2 Qatar Fuel 153.10 0.26 12.10 13,965 11.2 2.1 5.0 Widam Food Co. 64.00 (0.16) 21.21 1,152 14.8 4.0 4.2 Al Meera Consumer Goods 221.00 0.00 0.45 4,420 27.6 3.4 4.1 Consumer Goods and Services 25,067 Qatar Industrial Manufacturing 44.40 (1.33) 11.42 2,110 11.7 1.5 6.8 Qatar National Cement 88.50 1.72 (4.56) 5,258 11.1 1.8 4.1 Industries Qatar 111.50 5.29 0.36 67,458 16.9 2.1 4.5 Qatari Investors Group 53.90 5.69 42.97 6,701 23.6 2.8 2.3 Qatar Electricity and Water 231.00 1.76 6.75 25,410 16.3 3.5 3.2 Mannai Corp. 88.50 0.57 (7.14) 4,037 8.5 1.8 5.6 Aamal 13.34 1.29 (4.65) 8,404 13.1 1.1 N/A Gulf International Services 36.10 1.12 (29.90) 6,709 18.9 1.7 2.8 Mesaieed Petrochemical Holding 19.35 1.42 (0.26) 24,310 20.6 1.8 3.6 Industrials 150,397 Qatar Insurance 81.50 3.82 17.22 19,653 16.5 2.5 2.6 Doha Insurance 21.40 0.94 1.90 1,070 12.2 1.0 4.7 Qatar General Insurance & Reinsurance 45.45 (1.20) (2.16) 3,977 4.5 0.6 3.0 Al Khaleej Takaful Insurance 24.04 (0.78) (21.18) 614 22.1 1.2 4.2 Qatar Islamic Insurance 60.50 (1.63) (15.97) 908 13.4 2.9 6.6 Insurance 26,221 United Development 21.23 7.17 2.31 7,517 16.1 0.7 7.1 Barw a Real Estate 37.50 5.49 (6.25) 14,592 17.9 0.8 5.9 Ezdan Real Estate 19.89 1.02 25.09 52,758 30.1 1.8 2.5 Mazaya Qatar Real Estate Development 14.60 3.84 7.96 1,610 14.1 1.1 N/A Real Estate 76,477 Ooredoo 97.30 2.85 29.73 31,167 12.1 1.4 3.1 Vodafone Qatar 12.22 7.19 (3.78) 10,331 N/A 2.1 N/A Telecoms 41,498 Qatar Navigation (Milaha) 89.50 1.70 (5.79) 10,250 10.2 0.8 5.6 Gulf Warehousing 58.20 0.69 2.28 3,411 15.6 2.4 2.6 Qatar Gas Transport (Nakilat) 24.55 0.61 5.14 13,601 13.8 3.9 5.1 Transportation 27,262 Qatar Exchange 586,367
- 6. Contacts Saugata Sarkar Shahan Keushgerian Zaid al-Nafoosi , CMT, CFTe Head of Research Senior Research Analyst Senior Research Analyst Tel: (+974) 4476 6534 Tel: (+974) 4476 6509 Tel: (+974) 4476 6535 saugata.sarkar@qnbfs.com.qa shahan.keushgerian@qnbfs.com.qa zaid.alnafoosi@qnbfs.com.qa QNB Financial Services Co. WLL One Person Company Contact Center: (+974) 4476 6666 PO Box 24025 Doha, Qatar Disclaimer and Copyright Notice: This publication has been prepared by QNB Financial Services Co. WLL One Person Company (“QNBFS”) a wholly-owned subsidiary of QNB SAQ (“QNB”). QNBFS is regulated by the Qatar Financial Markets Authority and the Qatar Exchange QNB SAQ is regulated by the Qatar Central Bank. This publication expresses the views and opinions of QNBFS at a given time only. It is not an offer, promotion or recommendation to buy or sell securities or other investments, nor is it intended to constitute legal, tax, accounting, or financial advice. QNBFS accepts no liability whatsoever for any direct or indirect losses arising from use of this report. Any investment decision should depend on the individual circumstances of the investor and be based on specifically engaged investment advice. We therefore strongly advise potential investors to seek independent professional advice before making any investment decision. Although the information in this report has been obtained from sources that QNBFS believes to be reliable, we have not independently verified such information and it may not be accurate or complete. QNBFS does not make any representations or warranties as to the accuracy and completeness of the information it may contain, and declines any liability in that respect. For reports dealing with Technical Analysis, expressed opinions and/or recommendations may be different or contrary to the opinions/recommendations of QNBFS Fundamental Research as a result of depending solely on the historical technical data (price and volume). QNBFS reserves the right to amend the views and opinions expressed in this publication at any time. It may also express viewpoints or make investment decisions that differ significantly from, or even contradict, the views and opinions included in this report. This report may not be reproduced in whole or in part without permission from QNBFS COPYRIGHT: No part of this document may be reproduced without the explicit written permission of QNBFS. Page 6 of 6