QNBFS Weekly Market Report January 13, 2022
•
0 likes•67 views

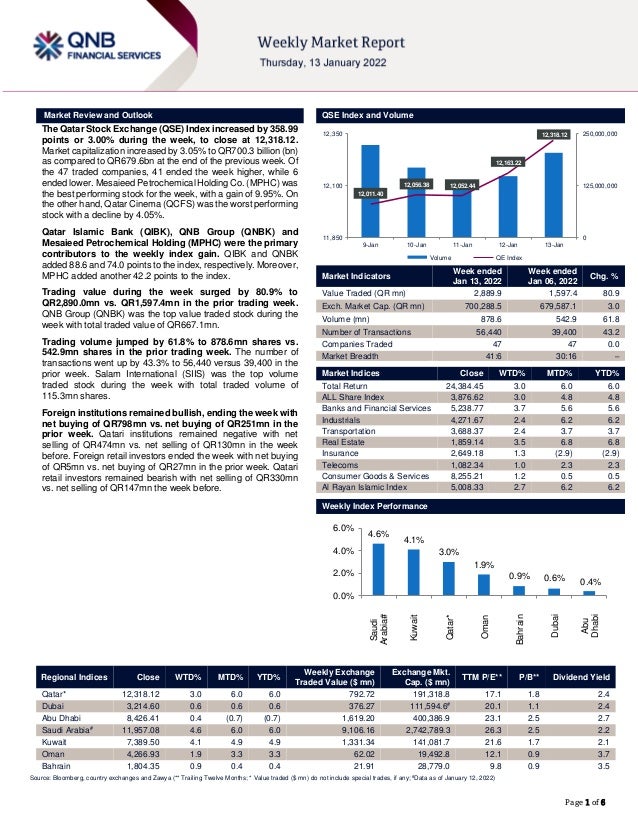
The Qatar Stock Exchange (QSE) Index increased by 358.99 points or 3.00% during the week, to close at 12,318.12

Recommended
Recommended
More Related Content
Similar to QNBFS Weekly Market Report January 13, 2022
Similar to QNBFS Weekly Market Report January 13, 2022 (20)
More from QNB Group
More from QNB Group (20)
Recently uploaded
Recently uploaded (20)
QNBFS Weekly Market Report January 13, 2022
- 1. ``````` Page 1 of 6 Market Review and Outlook QSE Index and Volume The Qatar Stock Exchange (QSE) Index increased by 358.99 points or 3.00% during the week, to close at 12,318.12. Market capitalization increased by 3.05% to QR700.3 billion (bn) as compared to QR679.6bn at the end of the previous week. Of the 47 traded companies, 41 ended the week higher, while 6 ended lower. Mesaieed Petrochemical Holding Co. (MPHC) was the best performing stock for the week, with a gain of 9.95%. On the other hand, Qatar Cinema (QCFS) was the worst performing stock with a decline by 4.05%. Qatar Islamic Bank (QIBK), QNB Group (QNBK) and Mesaieed Petrochemical Holding (MPHC) were the primary contributors to the weekly index gain. QIBK and QNBK added 88.6 and 74.0 points to the index, respectively. Moreover, MPHC added another 42.2 points to the index. Trading value during the week surged by 80.9% to QR2,890.0mn vs. QR1,597.4mn in the prior trading week. QNB Group (QNBK) was the top value traded stock during the week with total traded value of QR667.1mn. Trading volume jumped by 61.8% to 878.6mn shares vs. 542.9mn shares in the prior trading week. The number of transactions went up by 43.3% to 56,440 versus 39,400 in the prior week. Salam International (SIIS) was the top volume traded stock during the week with total traded volume of 115.3mn shares. Foreign institutions remained bullish, ending the week with net buying of QR798mn vs. net buying of QR251mn in the prior week. Qatari institutions remained negative with net selling of QR474mn vs. net selling of QR130mn in the week before. Foreign retail investors ended the week with net buying of QR5mn vs. net buying of QR27mn in the prior week. Qatari retail investors remained bearish with net selling of QR330mn vs. net selling of QR147mn the week before. Market Indicators Week ended Jan 13, 2022 Week ended Jan 06, 2022 Chg. % Value Traded (QR mn) 2,889.9 1,597.4 80.9 Exch. Market Cap. (QR mn) 700,288.5 679,587.1 3.0 Volume (mn) 878.6 542.9 61.8 Number of Transactions 56,440 39,400 43.2 Companies Traded 47 47 0.0 Market Breadth 41:6 30:16 – Market Indices Close WTD% MTD% YTD% Total Return 24,384.45 3.0 6.0 6.0 ALL Share Index 3,876.62 3.0 4.8 4.8 Banks and Financial Services 5,238.77 3.7 5.6 5.6 Industrials 4,271.67 2.4 6.2 6.2 Transportation 3,688.37 2.4 3.7 3.7 Real Estate 1,859.14 3.5 6.8 6.8 Insurance 2,649.18 1.3 (2.9) (2.9) Telecoms 1,082.34 1.0 2.3 2.3 Consumer Goods & Services 8,255.21 1.2 0.5 0.5 Al Rayan Islamic Index 5,008.33 2.7 6.2 6.2 Weekly Index Performance Regional Indices Close WTD% MTD% YTD% Weekly Exchange Traded Value ($ mn) Exchange Mkt. Cap. ($ mn) TTM P/E** P/B** Dividend Yield Qatar* 12,318.12 3.0 6.0 6.0 792.72 191,318.8 17.1 1.8 2.4 Dubai 3,214.60 0.6 0.6 0.6 376.27 111,594.6# 20.1 1.1 2.4 Abu Dhabi 8,426.41 0.4 (0.7) (0.7) 1,619.20 400,386.9 23.1 2.5 2.7 Saudi Arabia# 11,957.08 4.6 6.0 6.0 9,106.16 2,742,789.3 26.3 2.5 2.2 Kuwait 7,389.50 4.1 4.9 4.9 1,331.34 141,081.7 21.6 1.7 2.1 Oman 4,266.93 1.9 3.3 3.3 62.02 19,492.8 12.1 0.9 3.7 Bahrain 1,804.35 0.9 0.4 0.4 21.91 28,779.0 9.8 0.9 3.5 Source: Bloomberg, country exchanges and Zawya (** Trailing Twelve Months; * Value traded ($ mn) do not include special trades, if any; #Data as of January 12, 2022) 12,011.40 12,056.38 12,052.44 12,163.22 12,318.12 0 125,000,000 250,000,000 11,850 12,100 12,350 9-Jan 10-Jan 11-Jan 12-Jan 13-Jan Volume QE Index 4.6% 4.1% 3.0% 1.9% 0.9% 0.6% 0.4% 0.0% 2.0% 4.0% 6.0% Saudi Arabia# Kuwait Qatar* Oman Bahrain Dubai Abu Dhabi
- 2. Page 2 of 6 Economic, Market & Company News Qatar’s GDP grows 40.6% in third quarter – Qatar’s quarterly Gross Domestic Product (GDP) at current prices has risen by 40.6% to QR176.23bn in the third quarter (Q3) of 2021 compared to QR125.33bn during the Q3 of 2020, according to the preliminary estimates of GDP released. When compared to previous quarter (Q2) of 2021 revised estimate of QR156.29bn, an increase of 12.8% is recorded. The quarterly GDP at constant prices shows an increase of 2.6% in Q3 of 2021 (QR168.13bn) compared to the estimate of Q3 of 2020 (QR163.9bn). When compared to Q2 of 2021 revised estimate (QR 161.71bn), an increase of 4% is also recorded. In the Mining and Quarrying Activities, the nominal gross value added (GVA) estimate of Mining and Quarrying activities is estimated at QR67.98bn in Q3 2021, which shows an increase of 101.9% over the estimate of Q3 2020 placed at QR 33.67bn. Compared to the previous quarter revised estimate (QR57.49bn), an increase of 18.2% in the GVA of this sector is recorded. (Peninsula Qatar) Oxford Economics: Qatar’s GDP growth to gain speed; seen at 3.7% in 2022, 3.5% in 2023 – Qatar’s GDP growth will gain speed at 3.7% in 2022 and 3.5% in 2023-24, according to researcher Oxford Economics. The researcher estimates Qatar’s economy will gave grown by 2.5% in 2021. In its forecast overview, Oxford Economics said domestic activity has gained strength since (pandemic-induced) restrictions were eased. The manufacturing PMI reached 63.1 in November 2021, up from 62.2 in October last year, signaling the strongest improvement in business conditions in the series’ history, with both output and new orders trending up amid improving confidence. Recent GDP data shows the economy continued to rebound in Q2, despite tighter restrictions, with annual growth of 4% on the back of a 6.2% y/y surge in the non-oil sector. (Gulf-Times.com) Oxford Economics: Qatar budget surplus to rise to nearly 6% of GDP in 2022 – Qatar’s budget surplus is expected to rise to about 6% of GDP in 2022, due to higher oil and gas revenues, Oxford Economics has said in a report. While the country’s budget moved into deficit in 2017, this was temporary and returned to surplus in 2018. However, it began to narrow again in 2019 and, given the slump in oil and gas prices, it moved into deficit of 2.1% of GDP in 2020, Oxford Economics said in its latest ‘Country economic forecast’. Qatar’s 2022 budget is based on a conservative oil price estimate of $55 per barrel, well below the researcher’s forecast of $71 next year. “On this basis, the authorities project a slight deficit of QR8.3bn, or roughly 1% of GDP next year, while we see a surplus of close to 6%, with higher revenues facilitating an increase in spending,” Oxford Economics said. (Gulf-Times.com) World Bank: Qatar economy to grow 4.8% this year and 4.9% in 2023 – Qatar’s economy is expected to grow 4.8% this year and 4.9% in 2023, the World Bank has said in its latest forecast. Qatar’s GDP growth next year will be the GCC’s best, the forecast has shown. In 2023, Bahrain's economy has been forecast to grow at 2.9%, Kuwait (3%), Oman (4.1%), Saudi Arabia (2.3%) and UAE (2.9%). Overall, the growth in Middle East and North Africa (MENA) region is expected to accelerate to 4.4% in 2022, an upward revision from June 2021 and moderate to 3.4% in 2023, World Bank said. The gap in average per capita income between MENA and advanced economies is projected to widen during the forecast horizon, however. Higher oil and natural gas prices and increased production are expected to benefit energy exporters. Saudi Arabia's oil sector is expected to rebound strongly, boosting exports, while non-oil activity should benefit from high vaccination rates and accelerating investment. (Gulf- Times.com) QNB Group reports strong financial results for the FY 2021 – QNB Group achieved strong growth in net profit for 2021 and in line with QNB Group’s strategy of maximizing returns to its shareholders, the Board of Directors have recommended to the General Assembly the distribution of a cash dividend of 55% of the nominal share value (QAR0.55 per share). The financial results for 2021 along with the proposed profit distribution are subject to Qatar Central Bank (QCB) approval. Net Profit for the full year reached QAR13.2 billion, an increase of 10% compared to last year. Operating Income increased by 11% to QAR28.3 billion driven by strong growth in top line performance. This reflects QNB Group’s success in maintaining sustainable and strong growth across a number of revenue segments. In addition, QNB Group continued to build additional loan loss provisions during the year as a conservative measure, which resulted in the loan loss provision charge for the year ended 31 December 2021 reaching QAR7.1 billion, an increase of 21% from last year. This helped to improve coverage ratio to 117%, which reflects the conservative approach adopted by the Group in managing its loans and advances portfolio. The Group’s drive for operational efficiency continues to result in cost savings and strong revenue sources that has helped QNB Group to improve efficiency (cost to income) ratio from 24.3%to 22.2%, which is considered as one of the best ratios among large financial institutions in the MEA region. Total Assets reached QAR1,093 billion, an increase of 7% from 31 December 2020, mainly driven by strong growth in Loans and advances by 6% to reach QAR764 billion. Robust customer deposits generation helped to increase customer deposits by 6% to reach QAR786 billion as at 31 December 2021. QNB Group’s strong asset-liability management capabilities enabled QNB Group to improve its loans to deposits ratio from 98.0% to 97.2% as at 31 December 2021 reflecting the improvement in the Group’s overall liquidity. The ratio of non- performing loans to gross loans remained stable at 2.3% as at 31 December 2021, one of the lowest amongst financial institutions in the MEA region, reflecting the high quality of the Group’s loan book and the effective management of credit risk. Also during the year, QNB Group increased its loan loss provision charge by QAR7.1 billion, as QNB Group remains cautious on the external environment with respect to potential risks that may arise from key markets where QNB Group operates. This helped the Group to increase its coverage ratio to 117%, which reflects the prudent approach adopted by the Group towards non-performing loans. Group Capital Adequacy Ratio (CAR) as at 31 December 2021 amounted to 19.3%, higher than the regulatory minimum requirements of the Qatar Central Bank and Basel Committee. During the year, QNB Group accessed global debt markets for debt securities issuance under its EMTN programme, a USD1 billion five-year bond issued in January 2021 and a debut bond launch in Hong Kong Stock Exchange for USD600 million with a three year maturity which was successfully placed in June 2021. QNB Group supported by 27,000 staff resources operating from approximately 1,000 locations and 4,500 ATMs. (QSE)
- 3. Page 3 of 6 Qatar Stock Exchange Top Gainers Top Decliners Source: Qatar Stock Exchange (QSE) Source: Qatar Stock Exchange (QSE) Most Active Shares by Value (QR Million) Most Active Shares by Volume (Million) Source: Qatar Stock Exchange (QSE) Source: Qatar Stock Exchange (QSE) Investor Trading Percentage to Total Value Traded Net Traded Value by Nationality (QR Million) Source: Qatar Stock Exchange (QSE) Source: Qatar Stock Exchange (QSE) 10.0% 7.2% 6.5% 6.4% 6.2% 0.0% 4.0% 8.0% 12.0% Mesaieed Petrochemical Holding Company Qatar General Insurance & Reinsurance Company Salam International Investment Limited Investment Holding Group Mannai Corporation -4.0% -2.8% -2.2% -1.6% -0.8% -4.5% -3.0% -1.5% 0.0% Qatar Cinema & Film Distribution Company QLM Life & Medical Insurance Company Qatar Islamic Insurance Company Doha Insurance Group Ahli Bank 667.1 283.3 171.6 166.7 140.0 0.0 250.0 500.0 750.0 QNB Group Masraf Al Rayan Qatar Islamic Bank Industries Qatar Mesaieed Petrochemical Holding Company 115.3 68.9 65.6 59.3 58.0 0.0 40.0 80.0 120.0 Salam International Investment Limited Gulf International Services Mazaya Qatar Real Estate Development Mesaieed Petrochemical Holding Company Investment Holding Group 0% 20% 40% 60% 80% 100% Buy Sell 28.16% 39.57% 24.77% 41.16% 11.09% 10.92% 35.98% 8.35% Qatari Individuals Qatari Institutions Non-Qatari Individuals Non-Qatari Institutions 1,530 1,360 2,333 557 -803 803 -1,000 0 1,000 2,000 3,000 Qatari Non-Qatari Net Investment Total Sold Total Bought
- 4. Page 4 of 6 TECHNICAL ANALYSIS OF THE QSE INDEX Source: Bloomberg The QE Index added another 3% from the previous week and closed at 12,318.12. The momentum remains to be healthy as we saw increased volumes on the uptick and major averages remain to be stacked in a bullish manner. The Index managed to move into its six- year-high levels, which is expected to increase the confidence in the overall market while less resistance to be expected against the recent breakout above 12,000 points. We see a soft resistance around the 12,800 points then a hard resistance level at 13,000 points. We keep our weekly support level at the 11,500 level. DEFINITIONS OF KEY TERMS USED IN TECHNICAL ANALYSIS RSI (Relative Strength Index) indicator – RSI is a momentum oscillator that measures the speed and change of price movements. The RSI oscillates between 0 to 100. The index is deemed to be overbought once the RSI approaches the 70 level, indicating that a correction is likely. On the other hand, if the RSI approaches 30, it is an indication that the index may be getting oversold and therefore likely to bounce back. MACD (Moving Average Convergence Divergence) indicator – The indicator consists of the MACD line and a signal line. The divergence or the convergence of the MACD line with the signal line indicates the strength in the momentum during the uptrend or downtrend, as the case may be. When the MACD crosses the signal line from below and trades above it, it gives a positive indication. The reverse is the situation for a bearish trend. Candlestick chart – A candlestick chart is a price chart that displays the high, low, open, and close for a security. The ‘body’ of the chart is portion between the open and close price, while the high and low intraday movements form the ‘shadow’. The candlestick may represent any time frame. We use a one-day candlestick chart (every candlestick represents one trading day) in our analysis. Doji candlestick pattern – A Doji candlestick is formed when a security's open and close are practically equal. The pattern indicates indecisiveness, and based on preceding price actions and future confirmation, may indicate a bullish or bearish trend reversal. Shooting Star/Inverted Hammer candlestick patterns – These candlestick patterns have a small real body (open price and close price are near to each other), and a long upper shadow (large intraday movement on the upside). The Shooting Star is a bearish reversal pattern that forms after a rally. The Inverted Hammer looks exactly like a Shooting Star, but forms after a downtrend. Inverted Hammers represent a potential bullish trend reversal.
- 5. Page 5 of 6 Source: Bloomberg Company Name Price January 13 % Change WTD % Change YTD Market Cap. QR Million TTM P/E P/B Div. Yield Qatar National Bank 21.00 4.17 4.01 193,965 15.9 2.5 2.1 Qatar Islamic Bank 20.02 5.42 9.22 47,306 14.9 2.4 2.0 Commercial Bank of Qatar 7.04 3.13 4.37 28,509 13.8 1.5 1.4 Doha Bank 3.04 1.40 (5.09) 9,416 15.0 0.9 2.5 Al Ahli Bank 3.96 (0.75) 3.39 9,621 13.7 1.5 3.8 Qatar International Islamic Bank 10.20 6.03 10.75 15,440 17.3 2.4 3.2 Masraf Al Rayan 5.00 0.48 7.76 46,500 16.8 2.5 3.4 Qatar First Bank 1.81 1.12 1.12 1,267 10.7 2.3 N/A National Leasing 0.97 1.46 3.62 482 19.3 0.7 2.6 Dlala Holding 1.30 5.59 5.67 371 24.0 1.6 N/A Qatar & Oman Investment 0.86 5.50 6.02 272 48.1 0.9 N/A Islamic Holding Group 3.92 2.32 (0.63) 222 39.2 1.5 1.3 Banking and Financial Services 353,370 Zad Holding 16.49 (0.66) (1.26) 4,299 22.2 2.9 3.9 Qatar German Co. for Medical Devices 3.21 0.25 0.94 371 121.6 11.2 N/A Salam International Investment 0.88 6.55 7.33 1,005 N/A 0.7 N/A Baladna 1.54 2.33 6.23 2,918 N/A 1.3 3.5 Medicare Group 8.40 1.05 (1.21) 2,363 26.2 2.3 21.4 Qatar Cinema & Film Distribution 3.60 (4.05) 1.49 226 73.7 1.6 2.8 Qatar Fuel 18.20 1.05 (0.44) 18,095 17.8 2.1 2.5 Qatar Meat and Livestock 3.64 1.59 1.17 654 N/A 2.1 2.8 Mannai Corp. 5.38 6.17 13.37 2,456 6.1 1.1 0.2 Al Meera Consumer Goods 19.70 1.55 0.51 3,940 21.8 2.6 4.6 Consumer Goods and Services 36,327 Qatar Industrial Manufacturing 3.20 4.47 4.23 1,521 12.4 0.9 3.1 Qatar National Cement 5.45 2.10 6.86 3,562 15.1 1.2 3.7 Industries Qatar 16.14 0.50 4.20 97,647 14.7 2.6 2.0 Qatari Investors Group 2.33 4.95 5.14 2,902 21.1 1.0 2.6 Qatar Electricity and Water 17.08 0.59 2.89 18,788 14.3 1.7 3.7 Aamal 1.13 3.21 3.87 7,094 29.5 0.9 3.6 Gulf International Services 1.83 6.17 6.35 3,392 N/A 1.0 N/A Mesaieed Petrochemical Holding 2.48 9.95 18.42 31,094 19.0 1.9 1.6 Invesment Holding Group 1.30 6.38 5.86 1,080 54.3 1.3 N/A Qatar Aluminum Manufacturing 1.98 4.54 9.88 11,043 18.3 1.8 1.8 Industrials 178,121 Qatar Insurance 2.62 1.32 (4.76) 8,554 16.1 1.0 N/A QLM Life & Medical Insurance 5.15 (2.83) 1.98 1,803 N/A 3.0 N/A Doha Insurance 1.86 (1.58) (2.97) 932 13.3 0.8 5.4 Qatar General Insurance & Reinsurance 2.00 7.24 0.00 1,750 13.6 0.3 N/A Al Khaleej Takaful Insurance 3.71 3.51 3.11 948 19.5 1.9 1.4 Qatar Islamic Insurance 7.91 (2.21) (1.13) 1,187 15.3 2.9 4.1 Insurance 15,172 United Development 1.63 2.32 5.91 5,775 18.7 0.5 3.1 Barw a Real Estate 3.35 4.40 9.44 13,032 10.6 0.6 3.7 Ezdan Real Estate 1.37 4.02 2.39 36,419 94.7 1.1 N/A Mazaya Qatar Real Estate Development 0.96 3.35 3.80 1,106 36.0 0.9 3.1 Real Estate 56,331 Ooredoo 7.17 0.43 2.14 22,967 N/A 1.1 3.5 Vodafone Qatar 1.71 2.39 2.76 7,241 27.8 1.6 2.9 Telecoms 30,208 Qatar Navigation (Milaha) 7.95 2.54 4.07 9,104 27.5 0.6 3.8 Gulf Warehousing 4.65 2.83 2.42 272 11.9 1.4 2.2 Qatar Gas Transport (Nakilat) 3.42 2.18 3.55 18,931 14.8 2.3 3.2 Transportation 28,307 Qatar Exchange 700,288
- 6. Contacts QNB Financial Services Co. W.L.L. Contact Center: (+974) 4476 6666 info@qnbfs.com.qa Doha, Qatar Saugata Sarkar, CFA, CAIA Shahan Keushgerian Head of Research Senior Research Analyst saugata.sarkar@qnbfs.com.qa shahan.keushgerian@qnbfs.com.qa Disclaimer and Copyright Notice: This publication has been prepared by QNB Financial Services Co. W.L.L. (“QNBFS”) a wholly-owned subsidiary of Qatar National Bank (Q.P.S.C.). QNB FS is regulated by the Qatar Financial Markets Authority and the Qatar Exchange. Qatar National Bank (Q.P.S.C.) is regulated by the Qatar Central Bank. This publication expresses the views and opinions of QNBFS at a given time only. It is not an offer, promotion or recommendation to buy or sell securities or other investments, nor is it intended to constitute legal, tax, accounting, or financial advice. QNBFS accepts no liability whatsoever for any direct or indirect losses arising from use of this report. Any investment decision should depend on the individual circumstances of the investor and be based on specifically engaged investment advice. We therefore strongly advise potential investors to seek independent professional advice before making any investment decision. Although the information in this report has been obtained from sources that QNBFS believes to be reliable, we have not independently verified such information and it may not be accurate or complete. QNBFS does not make any representations or warranties as to the accuracy and completeness of the information it may contain, and declines any liability in that respect. For reports dealing with Technical Analysis, expressed opinions and/or recommendations may be different or contrary to the opinions/recommendations of QNBFS Fundamental Research as a result of depending solely on the historical technical data (price and volume). QNBFS reserves the right to amend the views and opinions expressed in this publication at any time. It may also express viewpoints or make investment decisions that differ significantly from, or even contradict, the views and opinions included in this report. This report may not be reproduced in whole or in part without permission from QNBFS. COPYRIGHT: No part of this document may be reproduced without the explicit written permission of QNBFS. Page 6 of 6