QNBFS Weekly Market Report May 2, 2019
•
0 likes•102 views

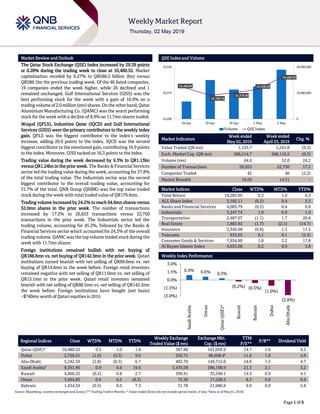
The Qatar Stock Exchange (QSE) Index increased by 29.39 points or 0.28% during the trading week to close at 10,480.52

Recommended
More Related Content
What's hot
What's hot (20)
Similar to QNBFS Weekly Market Report May 2, 2019
Similar to QNBFS Weekly Market Report May 2, 2019 (20)
More from QNB Group
More from QNB Group (20)
Recently uploaded
Recently uploaded (20)
QNBFS Weekly Market Report May 2, 2019
- 1. ` Page 1 of 9 Market Review and Outlook QSE Index and Volume The Qatar Stock Exchange (QSE) Index increased by 29.39 points or 0.28% during the trading week to close at 10,480.52. Market capitalization receded by 0.27% to QR586.5 billion (bn) versus QR588.1bn the previous trading week. Of the 46 listed companies, 19 companies ended the week higher, while 26 declined and 1 remained unchanged. Gulf International Services (GISS) was the best performing stock for the week with a gain of 16.9% on a trading volume of 2.0 million (mn)shares. Onthe other hand, Qatar Aluminium Manufacturing Co. (QAMC) was the worst performing stock for the week with a decline of 8.9% on 11.7mn shares traded. Woqod (QFLS), Industries Qatar (IQCD) and Gulf International Services (GISS) were the primary contributors to the weekly index gain. QFLS was the biggest contributor to the index’s weekly increase, adding 20.9 points to the index. IQCD was the second biggest contributor to the mentioned gain, contributing 16.9 points to the index. Moreover, GISS tacked on 16.3 points to the index. Trading value during the week decreased by 9.3% to QR1.13bn versus QR1.24bn in the prior week. The Banks & Financial Services sector led the trading value during the week, accounting for 37.8% of the total trading value. The Industrials sector was the second biggest contributor to the overall trading value, accounting for 31.7% of the total. QNB Group (QNBK) was the top value traded stock during the week with total traded value of QR179.4mn. Trading volume increased by 24.2% to reach 64.6mn shares versus 52.0mn shares in the prior week. The number of transactions increased by 17.2% to 26,653 transactions versus 22,750 transactions in the prior week. The Industrials sector led the trading volume, accounting for 45.2%, followed by the Banks & Financial Services sector which accounted for 24.3% of the overall trading volume. QAMC was the top volume traded stock during the week with 11.7mn shares. Foreign institutions remained bullish with net buying of QR188.6mn vs. net buying of QR142.9mn in the prior week. Qatari institutions turned bearish with net selling of QR89.0mn vs. net buying of QR14.6mn in the week before. Foreign retail investors remained negative with net selling of QR11.0mn vs. net selling of QR15.1mn in the prior week. Qatari retail investors remained bearish with net selling of QR88.5mn vs. net selling of QR142.3mn the week before. Foreign institutions have bought (net basis) ~$740mn worth of Qatari equities in 2019. Market Indicators Week ended May 02, 2019 Week ended April 25, 2019 Chg. % Value Traded (QR mn) 1,125.7 1,241.8 (9.3) Exch. Market Cap. (QR mn) 586,514.7 588,110.2 (0.3) Volume (mn) 64.6 52.0 24.2 Number of Transactions 26,653 22,750 17.2 Companies Traded 45 46 (2.2) Market Breadth 19:26 14:31 – Market Indices Close WTD% MTD% YTD% Total Return 19,285.05 0.3 1.0 6.3 ALL Share Index 3,182.11 (0.2) 0.4 3.3 Banks and Financial Services 4,085.79 (0.5) 0.4 6.6 Industrials 3,247.74 1.0 0.9 1.0 Transportation 2,487.07 (1.1) 1.7 20.8 Real Estate 1,865.92 (1.7) (2.1) (14.7) Insurance 3,346.68 (0.8) 1.3 11.2 Telecoms 933.05 0.1 0.1 (5.5) Consumer Goods & Services 7,954.80 1.8 2.2 17.8 Al Rayan Islamic Index 4,033.00 0.2 0.9 3.8 Market Indices Weekly Index Performance Regional Indices Close WTD% MTD% YTD% Weekly Exchange Traded Value ($ mn) Exchange Mkt. Cap. ($ mn) TTM P/E** P/B** Dividend Yield Qatar (QSE)* 10,480.52 0.3 1.0 1.8 307.80 161,056.9 14.7 1.6 4.2 Dubai 2,758.51 (1.0) (0.3) 9.0 250.71 98,668.4# 11.6 1.0 4.9 Abu Dhabi 5,242.59 (2.8) (0.3) 6.7 483.70 149,715.0 14.6 1.5 4.7 Saudi Arabia# 9,361.96 0.9 0.6 19.6 5,470.58 586,190.9 21.3 2.1 3.2 Kuwait 4,866.32 (0.2) 0.8 2.7 299.41 33,540.1 14.3 0.9 4.1 Oman 3,964.83 0.6 0.5 (8.3) 72.30 17,228.5 8.3 0.8 6.9 Bahrain 1,434.59 (0.5) 0.0 7.3 31.78 21,980.8 9.9 0.9 5.8 Source: Bloomberg, country exchanges and Zawya (** Trailing Twelve Months; * Value traded ($ mn) do not include special trades, if any; #Data as of May 01, 2019) 10,406.84 10,359.74 10,376.80 10,400.29 10,480.52 0 10,000,000 20,000,000 10,200 10,375 10,550 28-Apr 29-Apr 30-Apr 1-May 2-May Volume QSE Index 0.9% 0.6% 0.3% (0.2%) (0.5%) (1.0%) (2.8%) (3.0%) (1.5%) 0.0% 1.5% 3.0% SaudiArabia Oman Qatar(QSE)* Kuwait Bahrain Dubai AbuDhabi
- 2. Page 2 of 9 Stock Split Dates for Listed Qatari Companies News Economic News & Market News DHBK generated weak operating income YoY and sequentially, misses our estimate – Doha Bank's (DHBK) net profit declined 19.4% YoY (but surged 231.5% on QoQ basis) to QR307.5mn in 1Q2019, missing our estimate of QR362.5mn (variation of - 15.2%). The YoY drop in earnings was due to weak operations coupled with a surge in provisions, while the sequential surge in the bottom-line was attributed to a 59% drop in provisions. Net interest income decreased 12.0% YoY in 1Q2019 to QR492.7mn. However, on QoQ basis, net interest income rose 3.1%. The company's revenue came in at QR635.5mn in 1Q2019, which represents a decrease of 9.0% YoY due to weakness in net interest income. Net loans decreased by 1.9% QoQ to QR58.7bn, while deposits declined by 2.4% sequentially to reach QR54.5bn at the end of 1Q2019. DHBK’s Chairman, Sheikh Fahad bin Mohamed bin Jabor Al-Thani said, “The bank has made significant progress in improving the cost management and efficient utilization of resources where the operating cost for the period decreased by 10.8% as compared to same period last year, thus reducing the cost to income ratio to 35.7% from 37.3% showing bank’s productive operational performance.” The bank, given the scale of its operations, has achieved a return on the average assets of 1.28% at the end of March 31, 2019. The total financial investment portfolio increased by QR5.9bn, showing a significant growth of 32.3% compared to the same period of the last year. Sheikh Fahad highlighted that the YoY decline in net profit (in 1Q2019) was due to DHBK’s focus on strengthening the provisions base by taking significant loan loss provision compared to the same period last year, which enhanced the provision coverage for non-performing loans. Sheikh Abdul Rehman bin Mohamad bin Jabor Al-Thani, Managing Director of Doha Bank, said total shareholders’ equity stood at QR12.9bn at the end of March 31, 2019, registering a growth of 3.7%. The bank continued to strengthen its key capitalization ratios, where the total capital adequacy ratio increased to 17.1% at the end of first quarter of 2019 from 16.6% the same period last year. (QNB FS Research, Company financials, Gulf-Times.com) Qatar Petroleum awards major North Field Expansion contract; Upgrade to Outperform/Raise Price Target to QR21 – In a press release, GISS announced that QP has awarded it with contracts to provide six premium offshore jack up rigs for the North Field expansion (NFE) project. GDI intends to finalize an agreement with Seadrill to provide these required jack up rigs under the terms of their existing Strategic Cooperation Agreement. According to the deployment schedule put forth in GISS’ press release: 1) the first two rigs will be contracted for a firm duration of three years and will start working from 1Q2020, 2) the third rig will start operations in 2Q2020 for a period of two years, 3) two additional rigs contracted for three years will start
- 3. Page 3 of 9 operations in 3Q2020 and 4) finally, a suitable rig already being deployed by Qatargas will be utilized in this drilling program from 2Q2020 onward. Qatargas is in charge of executing this NFE project on behalf of QP; total contracts call for a drilling program of eight rigs, with the remaining two rigs awarded to US-based Northern Offshore Drilling Operations Ltd. The drilling program retains exercisable options to extend its duration if required and is a major component of the NFE project designed to increase Qatar’s LNG capacity from 77 MTPA to 110 MTPA by 2024. The scope of the project includes the drilling and completion of 80 new wells from eight wellhead platform locations. Financial impact: We increase our earnings estimate by an average of 28% over 2020-2023. We increase our 2020 EPS from QR1.13 to QR1.46 (+29%) and our 2021 EPS goes from QR1.30 to QR1.72 (+32%). We will detail our estimate changes in a subsequent report shortly. We are assuming the five extra rigs to be deployed in a similar arrangement as the West Tucana rig currently being used under a rig utilization agreement with Seadrill. GISS could opt for another structure, such as a JV arrangement and more details should be forthcoming in the future. We upgrade GISS to Outperform from Accumulate and raise our price target from QR17 to QR21. We view this news as further validation of our bullish view on GISS and note the stock is up 17% since our prior upgrade on March 24, 2019 vs. the QSE Index’s 5% gain. (Gulf-Times.com, QNB FS Research) MPHC's net profit declines 21.2% YoY and 23.3% QoQ in 1Q2019 – Mesaieed Petrochemical Holding Company's (MPHC) net profit declined 21.2% YoY (-23.3% QoQ) to QR281.1mn in 1Q2019. The company's share of profit from joint ventures came in at QR234.6mn in 1Q2019, which represents a decrease of 26.1% YoY (-16.4% QoQ). EPS amounted to QR0.22 in 1Q2019 as compared to QR0.28 in 1Q2018. MPHC is one of the region’s premier diversified petrochemical conglomerates with interests in the production of olefins, polyolefins, alpha olefins and chlor- alkali products. The decrease in profit is primarily due to reduction in sales volumes and selling prices. The group’s profit was also aided by the recognition of a tax refund of approximately QR33mn for the quarter. The group continued to benefit from the supply of competitively priced ethane feedstock and fuel gas under long-term supply agreements. These contracting arrangements are an important value driver for the group’s profitability in a competitive market environment. The petrochemical segment’s profit for the quarter as compared to the corresponding period of previous year was impacted primarily by the drop in selling prices. While the production and sales volumes marginally increased by 1%, the selling prices dropped by 12%. The Chlor-Alkali segment’s profit reduced from previous year primarily due to decrease in sales revenue and other income. Sales revenue was impacted by the decrease in sales volumes by 10% and decrease in selling prices by 14%. Production was marginally lower by 2% from previous year. The closing cash position after the first three months of operations was a robust QR1.3bn as at March 31, 2019. The total assets at March 31, 2019 stood at QR14.6bn, compared to QR15.3bn as at December 31, 2018. (Company financials, Peninsula Qatar) QNNS' bottom line rises 7.2% YoY and 138.4% QoQ in 1Q2019, in-line with our estimate – Qatar Navigation's (QNNS) net profit rose 7.2% YoY (+138.4% QoQ) to QR278.5mn in 1Q2019, in line with our estimate of QR278.0mn (variation of +0.2%). The company's operating revenue came in at QR708.2mn in 1Q2019, which represents an increase of 1.5% YoY (+16.9% QoQ). The company registered an operating profit of QR214.4mn for the three months that ended in March, up from QR202.8mn for the same period in 2018. Milaha Maritime & Logistics’ revenue decreased by QR24mn and net profit by QR12mn, driven by a decrease in bulk shipping rates and a vessel impairment charge on company’s bulk carrier. Milaha Gas & Petrochem’s revenue increased by QR3mn and net profit by QR50mn, ‘aided by improvement in market rates and growth in some of the sectors the company operate in’. Milaha Offshore’s revenue increased by QR61mn and bottom line improved by QR6mn on the back of improved utilization rates. Milaha Capital’s revenue decreased by QR22mn and net profit by QR23mn mainly due to lower dividend income from the trading portfolio. Milaha Trading’s revenue decreased by QR22mn and bottom line decreased by QR1mn due to the decline in heavy equipment sales. (QNB FS Research, Company releases, Gulf-Times.com) QFLS posts ~9% YoY increase but ~2% QoQ decline in net profit in 1Q2019 – Qatar Fuel Company's (QFLS) net profit rose ~9% YoY (but declined ~2% on QoQ basis) to QR326.9mn in 1Q2019. EPS increased to QR3.29 in 1Q2019 from QR3.03 in 1Q2018. Qatar Fuel Company's (WOQOD) CEO, Saad Rashid Al- Muhannadi said, “The increase in profits is attributable to the efforts exerted to enhance efficiency in the business activities and operations of the company, as well as the concomitant efforts to reduce expenses.” Operational expenses got reduced by 8% during the first quarter of 2019 compared to the corresponding period in 2018. Concerning the company's projects, the CEO said WOQOD plans to build and operate 30 more fuel stations this year. The number of fuel stations by the year-end will be 114. This means, the number of fuel stations will have more than doubled in two years – from 52 in 2017. And between 2020 and 2023, WOQOD plans to build another 50 fuel stations across the country, Al-Muhannadi revealed. With regard to the company's operations, he said WOQOD achieved 3% growth in total fuel sales during the quarter under review. Jet A1 sales increased by 9%, bitumen (17%), LPG (4%), natural gas (62%) and heavy fuel oil (44%). The retail sales of petroleum products increased by 30%, while non-oil retail sales, including Sidra stores sales grew by 13%. (QSE, Gulf-Times.com) ORDS' net profit declines ~14% YoY and ~11% QoQ in 1Q2019 – Ooredoo's (ORDS) net profit declined ~14% YoY (~-11% QoQ) to ~QR420mn in 1Q2019. Earnings per share decreased to QR1.31 in 1Q2019 from QR1.52 in 1Q2018. ORDS stated the “decrease” in net profit was primarily due to lower FX gains in Myanmar compared to the previous year. Excluding the FX impact, net profit attributable to ORDS shareholders increased by 8%. Group EBITDA was QR3.2bn with a corresponding EBITDA margin of 44%. Group EBITDA margin increased by 4 percentage points YoY mainly due to rigid cost management, reduced cost of sales from equipment sales and a positive impact from the new IFRS 16 accounting standards, changing the classification of operating leases. First-quarter revenue stood at QR7.2bn, a decline of 6% compared to the same period last year, largely driven by a ‘reduction’ in handset sales, an industry wide shift from voice services to data services, as well as ‘macroeconomic and currency weakness’ in some of our
- 4. Page 4 of 9 markets. Increased monetization of data business, with significant data growth coming from consumer and enterprise customers saw data revenue increase to 50% of the group revenue. Revenue from data contributed QR3.6bn. (QSE, Gulf- Times.com) QATI's bottom line rises 15.6% YoY and 36.9% QoQ in 1Q2019 – Qatar Insurance Company's (QATI) net profit rose 15.6% YoY (+36.9% QoQ) to QR266.1mn in 1Q2019. The company's net earned premiums came in at QR2,823.3mn in 1Q2019, which represents a decrease of 2.0% YoY (-8.9% QoQ). EPS increased to QR0.76 in 1Q2019 from QR0.66 in 1Q2018. The MENA markets continued to produce stable premiums with under- writing profitability, weathering geopolitical headwinds in the region. In 1Q2019, QATI adopted a more restrictive and selective approach to new business generation, reflecting the company’s continued focus on de-risking its book and placing more emphasis on low-volatility segments. Gross written premiums (GWP) remained stable at QR3.5bn. The Group’s international carriers, namely Qatar Re, Antares, QIC Europe Limited (QEL) and its Gibraltar based carriers continued to expand in select low-volatility areas and now account for approximately 76% of QATI’s total GWP, compared to 73% in the first quarter of 2018. The Group’s net underwriting result improved by 45% to QR166mn compared to QR115mn for the same period last year. This positive development reflects the Group’s successful shift towards lower-volatility business which provides a predictable long-term stream of profits. In addition, the improved technical performance is a result of the de-risking of non-profitable business across QATI’s international units in 2018. Overall, the Group’s profit for 1Q2019 increased by 15% YoY to QR272mn, driven by both improving underwriting results and resilient investment income. The Group recorded stable investment income of QR275mn for the period. QATI’s total investment return, including capital gains and losses, amounted to an annualized 6.2%. During the reporting period, QATI has vigorously maintained its focus on streamlining operations in order to further improve its operational efficiency. At 1Q2019, the administrative expense ratio for its core operations came in at 6.1%. The Group’s ongoing endeavor towards process efficiencies and automation continued to yield fruit. (QSE, Peninsula Qatar) IGRD posts ~9% YoY increase, slightly better than our 1Q2019 expectation – Investment Holding Group's (IGRD) net profit rose ~9% YoY (but declined ~41% on QoQ basis) to QR15.7mn in 1Q2019, slightly better than our QR14.8mn forecast. EPS increased to QR0.19 in 1Q2019 from QR0.17 in 1Q2018. (QSE, QNB FS Research) Another strong quarter with VFQS' bottom-line increasing 149.4% YoY and 2.8% QoQ in 1Q2019; moderate miss vs. our estimates; stay Market Perform on valuation – Vodafone Qatar (VFQS) reported net profit of QR43.5mn in 1Q2019, modestly missing our estimate of QR46.6mn (variation of -6.6%). The company's revenue came in at QR535.1mn in 1Q2019, which represents an increase of 0.6% YoY. However, on a QoQ basis, revenue fell 5.5%. Reported revenue was 3.6% shy of our estimate of QR554.9mn. EPS increased to QR0.05 in 1Q2019 from QR0.02 in 1Q2018 and QR0.05 in 4Q2018. According to the company, VFQS’ 1Q2019 financial performance was driven by a continued growth in its postpaid subscribers segment, fixed revenue growth and expansion of its cost optimization program. Vodafone stated that its EBITDA for the period increased by 34% YoY to reach QR180.6mn, primarily due to higher revenue, lower costs and IFRS 16, which reclassified long-term lease costs to below EBITDA. Consequently, EBITDA margin reached 33.8%. EBITDA excluding the IFRS 16 adjustment increased 17.9% or QR24mn YoY. Reported mobile customers at 1.7mn, reflects a 334,000 increase YoY, due to strong postpaid subscriber growth and from the positive impact of changing the definition of prepaid subscribers to align with the International Telecommunications Union’s and Qatar Communication and Regulatory Authority’s definition. We continue to like VFQS’ traction in higher value-added segments, such as postpaid and fixed but remain cautious because of valuation with the stock trading at 2019 and 2020 EV/EBITDA of 9.2x and 7.8x, respectively. We retain our Market Perform rating and price target of QR8.50. (QNB FS Research, Company financials, Gulf- Times.com) MERS posts 2.2% YoY increase but 27.4% QoQ decline in net profit in 1Q2019 – Al Meera Consumer Goods Company's (MERS) net profit rose 2.2% YoY (but declined 27.4% on QoQ basis) to QR44.3mn in 1Q2019. The company's sales came in at QR758.7mn in 1Q2019, which represents an increase of 3.2% YoY (+2.3% QoQ). EPS increased to QR2.21 in 1Q2019 from QR2.17 in 1Q2018. (QSE, Gulf-Times.com) QAMC’s ‘four-month net profit’ reaches QR13.3mn in March 2019 – Qatar Aluminium Manufacturing Company (QAMC), a 50% shareholder in Qatalum, registered a net profit of QR13.3mn for the ‘four-month period’ that ended on March 31, 2019. These results predominantly represent the share of net profit in QAMC’s joint venture, Qatalum, a successful producer of primary aluminum and one of the largest aluminum smelters in the region. The company’s earnings per share stood at QR0.02 during the period. QAMC stated, “Qatalum witnessed gradual improvement in operating costs due to lower raw material costs, as well as an improvement of aluminum selling prices.” Furthermore, Qatalum together with its strategic partner, Hydro, maintained its position to market and sell all of its products and compete with international suppliers. On the other hand, QAMC has a strong asset position as of March 31, 2019 standing at QR5.7bn with cash and bank balances amounted to QR191.9mn. As approved by the company’s AGM held on March 13, 2019 to distribute interim dividends along with its 1Q2019 disclosure, the company’s board of directors has decided to distribute an interim dividend of QR0.20 per share, totaling to QR111.6mn, a payout ratio of 110%, representing 2% of the share nominal value for the six-month period that ended on December 31, 2018. The dividend will be paid on May 5, 2019 based on the list of shareholders as of close of business on May 5, 2019. The distribution of dividends will be carried out by QNB Group. (QSE, Gulf-Times.com) As expected, GISS posts a decent beat in 1Q2019 with QR25.3mn in earnings; Maintain Accumulate with price target of QR17 – Gulf International Services (GISS) reported a net profit of QR25.3mn (+167.1% YoY) in 1Q2019 as compared to a net profit of QR9.5mn in 1Q2018 and net loss of QR137.7mn (net profit of QR4.5mn, excluding impairments) in 4Q2018, beating our estimate of QR15.0mn. The company's revenue came in at
- 5. Page 5 of 9 QR719.2mn in 1Q2019, which represents an increase of 17.6% YoY (+28.9% QoQ), which was 8.4% ahead of our forecast of QR663.6mn. Revenue for the insurance segment reported the highest increase. EBITDA came in at QR188mn and EPS increased to QR0.14 in 1Q2019 from QR0.05 in 1Q2018 (loss of QR0.74 in 4Q2018). As expected, revenue in the insurance segment improved significantly YoY mainly due to new accounts in the energy and medical segments, in addition to regaining some previously lost accounts. However, insurance profitability remained flat YoY due to higher net claims and reinsurance costs. The drilling segment reported a marginal growth in revenue, primarily driven by the deployment of the new offshore drilling rig, West Tucana, contracted to Qatargas via a partnership with Seadrill. The company stated that GDI’s operating profit surged more than 50% YoY due to increased revenue along with optimized costs. However, the segment’s net loss came in flat primarily due to increase in finance costs. The aviation segment reported a moderate growth in revenue compared to 1Q2018 due to international growth along with stable trends domestically. International growth along with savings in G&A expenses resulted in a significant growth in segment net income. Catering also increased its net income YoY due to COGS and G&A reduction despite revenue falling due to demobilization of major contracts and reduction in camps occupancy. GISS reported cash and equivalents of QR910mn and total debt of at QR4.9bn (90% drilling). We view these reported results positively and continue to maintain our Accumulate rating with QR17 price target. (QNB FS Research, Company financials) KCBK's 1Q2019 bottom line rises 4.1% YoY (+26.9% QoQ) on the back of a 50% drop in provisions & impairments, in-line with our estimate – Al Khalij Commercial Bank's (KCBK) net profit rose 4.1% YoY (+26.9% QoQ) to QR176.4mn in 1Q2019, in line with our estimate of QR175.2mn (variation of +0.7%). Net interest income decreased 4.9% YoY in1Q2019 to QR232.0mn. However, sequentially, net interest income gained 6.3%. Net loans declined by 2.5% QoQ to QR30.8bn. Deposits followed suit and declined by 6.4% QoQ to reach QR27.0bn KCBK’s operating income was QR289mn, reflecting growth in fee income of 5% YoY, while operating expenses were down 5%. “We began the year on a solid footing, reporting improved profitability in the first quarter of the year. Qatar has announced a surplus budget for 2019, with projects worth QR48bn expected to be awarded during 2019. These will lend positively to the economy,” KCBK’s Chairman and Managing Director, Sheikh Hamad bin Faisal bin Thani Al-Thani said. Investments stood at QR11.0bn in January-March this year, compared to QR11.3bn in the year-ago period. KCBK’s CEO, Fahad Al-Khalifa said, “Alongside optimizing revenues, we have continued to keep a close watch on our expenses, which are down 5% on the first quarter 2018, resulting in an efficiency ratio of 26.8%.” He also said on the back of a strong and liquid balance sheet; KCBK’s liquidity coverage ratio remains well above the minimum regulatory requirement and capital adequacy ratio stood at 18.4%. Expecting Qatar to grow at 3% (as projected by the International Monetary Fund), the bank stated this bodes well for the banking sector, and “we are well poised to benefit from the opportunities this will bring for our business. We remain confident this will translate into improved financial metrics for the bank.” Having significantly reduced impairments charges, down 51% YoY, KCBK’s non-performing loan ratio stood at 1.93% at the end of March 31, 2019 compared to 1.95% in the comparable period of 2018. (QNB FS Research, QSE, Gulf- Times.com)
- 6. Page 6 of 9 Qatar Stock Exchange Top Gainers Top Decliners Source: Qatar Stock Exchange (QSE) Source: Qatar Stock Exchange (QSE) Most Active Shares by Value (QR Million) Most Active Shares by Volume (Million) Source: Qatar Stock Exchange (QSE) Source: Qatar Stock Exchange (QSE) Investor Trading Percentage to Total Value Traded Net Traded Value by Nationality (QR Million) Source: Qatar Stock Exchange (QSE) Source: Qatar Stock Exchange (QSE) 16.9% 14.3% 13.1% 6.6% 3.7% 0.0% 6.0% 12.0% 18.0% Gulf International Services Investment Holding Group Al Khaleej Takaful Insurance Co. Doha Bank Dlala Brokerage & Inv. Holding Co. -8.9% -6.4% -5.8% -4.7% -4.5% -12.0% -8.0% -4.0% 0.0% QatarAluminium Manufacturing Company QatarCinema& FilmDistribution Co. QatarFirstBank QatarOman InvestmentCo. QatariGermanCo. forMedical Dev. 179.4 121.0 67.7 62.6 60.0 0.0 70.0 140.0 210.0 QNB Group Qatar Aluminium Manufacturing Company Qatar Fuel Company Investment Holding Group Industries Qatar 11.7 10.5 7.5 5.1 3.9 0.0 4.0 8.0 12.0 Qatar Aluminium Manufacturing Company Investment Holding Group Qatar First Bank Vodafone Qatar United Development Company 0% 20% 40% 60% 80% 100% Buy Sell 37.82% 45.68% 17.32% 25.23% 13.58% 14.56% 31.28% 14.53% Qatari Individuals Qatari Institutions Non-Qatari Individuals Non-Qatari Institutions 621 505 798 327 (178) 178 (400) (200) - 200 400 600 800 1,000 Qatari Non-Qatari Net Investment Total Sold Total Bought
- 7. Page 7 of 9 TECHNICAL ANALYSIS OF THE QSE INDEX Source: Bloomberg The QE Index managed to close up for the sixth week in a row, gaining by only 0.28% from the week before, and closed at 10,480.52. The Index has been in a pullback phase since March. As a result, we update our next expected resistance level to 10,800 points and the weekly support to 10,000 points. DEFINITIONS OF KEY TERMS USED IN TECHNICAL ANALYSIS RSI (Relative Strength Index) indicator – RSI is a momentum oscillator that measures the speedand change of price movements. The RSI oscillates between 0 to 100. The index is deemed to be overbought once the RSI approaches the 70 level, indicating that a correction is likely. On the other hand, if the RSI approaches 30, it is an indication that the index may be getting oversold and therefore likely to bounce back. MACD (Moving Average Convergence Divergence) indicator – The indicator consists of the MACD line and a signal line. The divergence or the convergence of the MACD line with the signal line indicates the strength in the momentum during the uptrend or downtrend, as the case may be. When the MACD crosses the signal line from below and trades above it, it gives a positive indication. The reverse is the situation for a bearish trend. Candlestick chart – A candlestick chart is a price chart that displays the high, low, open, and close for a security. The ‘body’ of the chart is portion between the open and close price, while the high and low intraday movements form the ‘shadow’. The candlestick may represent any time frame. We use a one-day candlestick chart (every candlestick represents one trading day) in our analysis. Doji candlestick pattern – A Doji candlestick is formed when a security's open and close are practically equal. The pattern indicates indecisiveness, and based on preceding price actions and future confirmation, may indicate a bullish or bearish trend reversal. ShootingStar/Inverted Hammer candlestick patterns – These candlestick patterns have a small real body (open price and close price are near to each other), and a long upper shadow (large intraday movement on the upside). The Shooting Star is a bearish reversal pattern that forms after a rally. The Inverted Hammer looks exactly like a Shooting Star, but forms after a downtrend. Inverted Hammers represent a potential bullish trend reversal.
- 8. Page 8 of 9 Source: Bloomberg Company Name Price May 02 % Change WTD % Change YTD Market Cap. QR Million TTM P/E P/B Div. Yield Qatar National Bank 195.40 (1.15) 0.21 180,480 13.8 2.8 3.1 Qatar Islamic Bank 170.00 0.29 11.84 40,170 15.4 2.7 2.9 Commercial Bank of Qatar 50.70 0.40 28.71 20,520 14.1 1.3 3.0 Doha Bank 23.10 6.60 4.05 7,162 13.4 0.8 4.3 Al Ahli Bank 30.00 (2.12) 17.86 6,942 10.4 1.3 3.0 Qatar International Islamic Bank 69.00 (2.72) 4.36 10,444 12.4 1.9 5.8 Masraf Al Rayan 36.38 (0.05) (12.72) 27,285 12.7 2.2 5.5 Al Khaliji Bank 11.76 (0.34) 1.91 4,234 7.6 0.8 6.4 Qatar First Bank 5.02 (5.82) 23.04 1,004 N/A 1.0 N/A National Leasing 8.30 (1.19) (5.57) 411 37.5 0.6 6.0 Dlala Holding 10.73 3.67 7.30 305 N/A 1.4 N/A Qatar & Oman Investment 5.89 (4.69) 10.30 186 72.8 0.6 5.1 Islamic Holding Group 21.65 (0.96) (0.92) 123 898.8 0.9 N/A Banking and Financial Services 299,264 Zad Holding 120.11 (3.06) 15.49 1,728 13.3 1.8 7.1 Qatar German Co. for Medical Devices 6.17 (4.49) 9.01 71 N/A 1.9 N/A Salam International Investment 4.99 0.60 15.24 570 N/A 0.5 N/A Medicare Group 62.78 0.45 (0.51) 1,767 21.0 1.8 2.9 Qatar Cinema & Film Distribution 19.53 (6.42) 2.68 123 13.8 0.8 7.7 Qatar Fuel 207.89 3.43 25.24 20,670 17.4 2.7 3.8 Qatar Meat and Livestock 59.89 1.51 (14.44) 1,078 10.0 3.5 7.5 Mannai Corp. 43.80 (3.84) (20.29) 1,998 5.5 0.8 4.6 Al Meera Consumer Goods 144.70 1.19 (2.23) 2,894 15.8 2.3 5.9 Consumer Goods and Services 30,899 Qatar Industrial Manufacturing 38.80 (1.02) (9.13) 1,844 10.1 1.2 6.4 Qatar National Cement 66.50 (2.92) 11.76 4,346 13.4 1.5 7.5 Industries Qatar 121.50 1.25 (9.06) 73,508 16.6 2.3 4.9 Qatari Investors Group 23.75 (1.04) (14.60) 2,953 17.1 1.1 3.2 Qatar Electricity and Water 165.50 (0.90) (10.54) 18,205 12.5 1.9 4.7 Aamal 8.92 (2.73) 0.90 5,620 13.3 0.7 6.7 Gulf International Services 17.82 16.85 4.82 3,312 N/A 0.9 N/A Mesaieed Petrochemical Holding 20.50 2.50 36.39 25,755 19.6 1.8 3.9 Invesment Holding Group 6.15 14.31 25.77 510 8.6 0.6 4.1 Qatar Aluminum Manufacturing 10.25 (8.89) (23.22) 5,720 N/A N/A N/A Industrials 141,771 Qatar Insurance 38.75 (1.27) 7.94 12,656 20.9 1.6 3.9 Doha Insurance 11.92 (1.08) (8.94) 596 12.0 0.6 6.7 Qatar General Insurance & Reinsurance 40.02 0.00 (10.83) 3,502 16.8 0.6 2.5 Al Khaleej Takaful Insurance 15.83 13.07 84.28 404 14.0 0.8 3.2 Qatar Islamic Insurance 54.83 0.33 2.09 822 12.7 2.5 6.4 Insurance 17,981 United Development 13.41 (3.87) (9.08) 4,748 10.4 0.4 7.5 Barw a Real Estate 35.40 1.23 (11.30) 13,775 7.2 0.7 7.1 Ezdan Real Estate 10.24 (2.94) (21.11) 27,162 44.8 0.9 N/A Mazaya Qatar Real Estate Development 8.03 2.69 2.95 930 81.1 0.6 6.2 Real Estate 46,614 Ooredoo 64.90 (0.32) (13.47) 20,789 13.9 1.0 3.9 Vodafone Qatar 7.75 0.65 (0.77) 6,552 45.9 1.5 3.2 Telecoms 27,341 Qatar Navigation (Milaha) 67.00 (1.50) 1.50 7,673 14.2 0.5 4.5 Gulf Warehousing 47.49 2.13 23.45 2,783 11.6 1.7 4.0 Qatar Gas Transport (Nakilat) 22.00 (1.57) 22.70 12,189 13.3 1.9 4.5 Transportation 22,645 Qatar Exchange 586,515
- 9. Contacts Saugata Sarkar, CFA, CAIA Shahan Keushgerian Zaid al-Nafoosi , CMT, CFTe Head of Research Senior Research Analyst Senior Research Analyst Tel: (+974) 4476 6534 Tel: (+974) 4476 6509 Tel: (+974) 4476 6535 saugata.sarkar@qnbfs.com.qa shahan.keushgerian@qnbfs.com.qa zaid.alnafoosi@qnbfs.com.qa Mehmet Aksoy, PhD QNB Financial Services Co. W.L.L. Senior Research Analyst Contact Center: (+974) 4476 6666 Tel: (+974) 4476 6589 PO Box 24025 mehmet.aksoy@qnbfs.com.qa Doha, Qatar Disclaimer and Copyright Notice: This publication has been prepared by QNB Financial Services Co. W.L.L. (“QNB FS”) a wholly-owned subsidiary of Qatar National Bank (Q.P.S.C.). QNB FS is regulated by the Qatar Financial Markets Authority and the Qatar Exchange. Qatar National Bank (Q.P.S.C.) is regulated by the Qatar Central Bank. This publication expresses the views and opinions of QNB FS at a given time only. It is not an offer, promotion or recommendation to buy or sell securities or other investments, nor is it intended to constitute legal, tax, accounting, or financial advice. QNB FS accepts no liability whatsoever for any direct or indirect losses arising from use of this report. Any investment decision should depend on the individual circumstances of the investor and be based on specifically engaged investment advice. We therefore strongly advise potential investors to seek independent professional advice before making any investment decision. Although the information in this report has been obtained from sources that QNB FS believes to be reliable, we have not independently verified such information and it may not be accurate or complete. QNB FS does not make any representations or warranties as to the accuracy and completeness of the information it may contain, and declines any liability in that respect. For reports dealing with Technical Analysis, expressed opinions and/or recommendations may be different or contrary to the opinions/recommendations of QNB FS Fundamental Research as a result of depending solely on the historical technical data (price and volume). QNB FS reserves the right to amend the views and opinions expressed in this publication at any time. It may also express viewpoints or make investment decisions that differ significantly from, or even contradict, the views and opinions included in this report. This report may not be reproduced in whole or in part without permission from QNB FS COPYRIGHT: No part of this document may be reproduced without the explicit written permission of QNB FS. Page 9 of 9