QNBFS Weekly Market Report April 28, 2022
•
0 likes•30 views

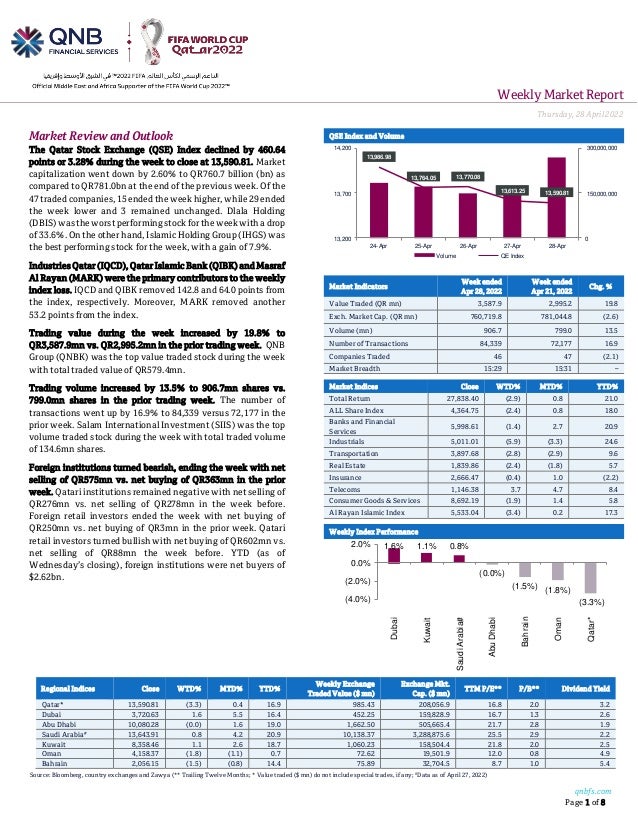
The Qatar Stock Exchange (QSE) Index declined by 460.64 points or 3.28% during the week to close at 13,590.81

Recommended
Recommended
More Related Content
Similar to QNBFS Weekly Market Report April 28, 2022
Similar to QNBFS Weekly Market Report April 28, 2022 (20)
More from QNB Group
More from QNB Group (20)
Recently uploaded
Recently uploaded (20)
QNBFS Weekly Market Report April 28, 2022
- 1. Weekly MarketReport Thursday,28April2022 qnbfs.com Page 1 of 8 Regional Indices Close WTD% MTD% YTD% Weekly Exchange Traded Value ($ mn) Exchange Mkt. Cap. ($ mn) TTM P/E** P/B** Dividend Yield Qatar* 13,590.81 (3.3) 0.4 16.9 985.43 208,056.9 16.8 2.0 3.2 Dubai 3,720.63 1.6 5.5 16.4 452.25 159,828.9 16.7 1.3 2.6 Abu Dhabi 10,080.28 (0.0) 1.6 19.0 1,662.50 505,665.4 21.7 2.8 1.9 Saudi Arabia# 13,643.91 0.8 4.2 20.9 10,138.37 3,288,875.6 25.5 2.9 2.2 Kuwait 8,358.46 1.1 2.6 18.7 1,060.23 158,504.4 21.8 2.0 2.5 Oman 4,158.37 (1.8) (1.1) 0.7 72.62 19,501.9 12.0 0.8 4.9 Bahrain 2,056.15 (1.5) (0.8) 14.4 75.89 32,704.5 8.7 1.0 5.4 Source: Bloomberg, country exchanges and Zawya (** Trailing Twelve Months; * Value traded ($ mn) do not include special trades, if any; #Data as of April 27, 2022) Market Review and Outlook QSE Index and Volume The Qatar Stock Exchange (QSE) Index declined by 460.64 points or 3.28% during the week to close at 13,590.81. Market capitalization went down by 2.60% to QR760.7 billion (bn) as compared to QR781.0bn at the end of the previous week. Of the 47 traded companies, 15 ended the week higher, while 29 ended the week lower and 3 remained unchanged. Dlala Holding (DBIS) wastheworst performingstock fortheweek withadrop of 33.6%. On the other hand, Islamic Holding Group (IHGS) was the best performing stock for the week, with a gain of 7.9%. IndustriesQatar(IQCD),QatarIslamic Bank (QIBK)and Masraf Al Rayan (MARK) were the primary contributors to the weekly index loss. IQCD and QIBK removed 142.8 and 64.0 points from the index, respectively. Moreover, MARK removed another 53.2 points from the index. Trading value during the week increased by 19.8% to QR3,587.9mn vs. QR2,995.2mn in the prior trading week. QNB Group (QNBK) was the top value traded stock during the week with total traded value of QR579.4mn. Trading volume increased by 13.5% to 906.7mn shares vs. 799.0mn shares in the prior trading week. The number of transactions went up by 16.9% to 84,339 versus 72,177 in the prior week. Salam International Investment (SIIS) was the top volume traded stock during the week with total traded volume of 134.6mn shares. Foreign institutions turned bearish, ending the week with net selling of QR575mn vs. net buying of QR363mn in the prior week. Qatari institutions remained negative with net selling of QR276mn vs. net selling of QR278mn in the week before. Foreign retail investors ended the week with net buying of QR250mn vs. net buying of QR3mn in the prior week. Qatari retail investors turned bullish with net buying of QR602mn vs. net selling of QR88mn the week before. YTD (as of Wednesday’s closing), foreign institutions were net buyers of $2.62bn. Market Indicators Week ended Apr 28, 2022 Week ended Apr 21, 2022 Chg. % Value Traded (QR mn) 3,587.9 2,995.2 19.8 Exch. Market Cap. (QR mn) 760,719.8 781,044.8 (2.6) Volume (mn) 906.7 799.0 13.5 Number of Transactions 84,339 72,177 16.9 Companies Traded 46 47 (2.1) Market Breadth 15:29 15:31 – Market Indices Close WTD% MTD% YTD% Total Return 27,838.40 (2.9) 0.8 21.0 ALL Share Index 4,364.75 (2.4) 0.8 18.0 Banks and Financial Services 5,998.61 (1.4) 2.7 20.9 Industrials 5,011.01 (5.9) (3.3) 24.6 Transportation 3,897.68 (2.8) (2.9) 9.6 Real Estate 1,839.86 (2.4) (1.8) 5.7 Insurance 2,666.47 (0.4) 1.0 (2.2) Telecoms 1,146.38 3.7 4.7 8.4 Consumer Goods & Services 8,692.19 (1.9) 1.4 5.8 Al Rayan Islamic Index 5,533.04 (3.4) 0.2 17.3 Weekly Index Performance 13,986.98 13,764.05 13,770.08 13,613.25 13,590.81 0 150,000,000 300,000,000 13,200 13,700 14,200 24-Apr 25-Apr 26-Apr 27-Apr 28-Apr Volume QE Index 1.6% 1.1% 0.8% (0.0%) (1.5%) (1.8%) (3.3%) (4.0%) (2.0%) 0.0% 2.0% Dubai Kuwait Saudi Arabia# Abu Dhabi Bahrain Oman Qatar*
- 2. qnbfs.com Page 2 of 8 Economic, Market & Company News Moody's upgrades Qatar banks outlook to 'stable' on receding Covid-19 challenges – Global credit rating agency Moody's has upgraded its outlook on Qatar’s banking sector to "stable" from "negative" as the pandemic challenges recede. "This reflects our view that operating conditions for the banks have stabilized as the challenges of the pandemic and low oil prices reverse, and the economy recovers," the rating agency said on its report. Heightened tourism activity surrounding the FIFA World Cup to be held in Qatar in 2022 would also support the economy, it said. Finding that the military conflict between Russia and Ukraine has increased global macroeconomic uncertainty, it said "but we expect banks to remain resilient as the dislocation in the global oil market caused by the conflict will keep oil prices higher supporting Qatari banks operating conditions." The banks' loan performance remains strong despite some of the lenders having operations in countries with weaker economic conditions. "The banks are well capitalized, and we expect profitability to improve as higher interest rates boost income, but remain below pre-pandemic levels," it said, adding domestic deposits are expected to grow, driven by higher oil prices. The likelihood of government support for banks in financial difficulty remains high, according to Moody's. The rating agency expects Qatar's real GDP (gross domestic product) to grow by 2.7% in 2022 (2.2% in 2021) after shrinking 3.6% in 2020 as a result of the pandemic and an associated decline in oil prices. The economic growth will be spurred by some large infrastructure projects, government spending linked to the gradual increase in hydrocarbon production and higher oil prices, it said. (Gulf Times) MARK reports net profit of QR506.2mn in 1Q2022, misses our estimate – Masraf Al Rayan's (MARK) reported net profit of QR506.2mn as compared to net profit of QR574.7mn in 1Q2021 and net profit of QR4.4mn in 4Q2021, missing our estimate of QR624.2mn (variation of -18.9%). Total net income from financing and investing activities increased 20.4% YoY and 12.9% QoQ in 1Q2022 to QR1,396.4mn. The company's total income came in at QR1,557mn in 1Q2022, which represents an increase of 21.9% YoY (+14.1% QoQ). Thebank's total assets stood at QR170.8bn at the end ofMarch 31,2022, up 36.1% YoY. However, on QoQ basis, the bank's total assets decreased 1.9%. Financing assets were QR122.2bn, registering a rise of 33.8% YoY (+1.1% QoQ) at the end of March 31, 2022. Customer current accounts rose 3.2% YoY to reach QR9.2bn at the end of March 31, 2022. However, on QoQ basis, customer current accounts fell 0.1%. The earnings per share amounted to QR0.054 in 1Q2022 as compared to QR0.077 in 1Q2021. (QSE, QNBFS Research) DHBK reports net profit of QR401.4mn, in-line with our estimate – Doha Bank (DHBK) reported net profit of QR401.4mn in 1Q2022 as compared to net profit of QR380.2mn in 1Q2021 and net loss of QR188mn in 4Q2021, in line with our estimate of QR393.4mn (variation of +2%). Net interest income decreased 2.7% YoY and 0.9% QoQ in 1Q2022 to QR643.7mn. The company's net operating income came in at QR825.7mn in 1Q2022, which represents an increase of 0.3% YoY (+8.2% QoQ). The bank's total assets stood at QR101.8bn at the end of March 31, 2022, down 9.2% YoY. However, on QoQ basis, the bank's total assets increased 0.7%. Loans and advances to customers were QR60bn, registering a decline of 14.9% YoY (-4.2% QoQ) at the end of March 31, 2022. Customer deposits declined 14.4% YoY to reach QR54.5bn at the end of March 31, 2022. However, on QoQ basis, customer deposits rose 8.2%. The earnings per share amounted to QR0.13 in 1Q2022 as compared to QR0.12 in 1Q2021. (QSE, QNBFS Research) IQCD's bottom line rises 87.3% YoY and 10.3% QoQ in 1Q2022, below our estimate – Industries Qatar's (IQCD) net profit rose 87.3% YoY (+10.3% QoQ) to QR2,703.6mn in 1Q2022, below our estimate of QR2,873.8mn (variation of -5.9%). The company's revenue came in at QR5,280.6mn in 1Q2022, which represents an increase of 85.9% YoY (+11.8% QoQ). EPS amounted to QR0.45 in 1Q2022 as compared to QR0.24 in 1Q2021. Further, EBITDA for 1Q-22 increased by 67% versus 1Q-21 and reached QR3.2bn, while EBITDA margin for 1Q-22 arrived at 46%. Group’s operations remained strong as production volumes for the quarter improved by 5% to reach 3.9mn MT’s in comparison to 1Q-21, while 9% growth was noted in comparison to 4Q-21. Growth in production volumes was mainly driven by multiple factors including the Group’s recent decision to restart one of the previously mothballed DR-2 facility with a larger capacity, while mothballing previously operational DR-1 facility with lower capacity. This decision was made to improve the overall efficiencies on account of raw material mix and offer opportunities to sell excess capacities of DR directly in the market. Additionally, the Group had higher number of operating days during 1Q-22 compared to 1Q-21 and 4Q-21, as there were relatively lower numbers of planned and unplanned shutdowns reported during the current period. Plant utilization rates for the quarter reached 95%, while average reliability factor stood at 97%. Group’s financial performance for the quarter in comparison to the same period of last year was largely attributed to multiple factors. Blended product prices significantly surged by 55% versus 1Q-21 and reached $747/MT. Growth in product prices translated into an increase of QR2.8bn in Group’s net earnings. Sales volumes for the quarter increased by 9% versus the same period of last year, primarily driven by higher plant operating rates, leading to improved production volumes. Group’s operating cost increased by 59% versus same period last year. Group’s financial position continue to remain robust, with cash and bank balances at QR12.6bn as of 31 March 2022, after accounting for a dividend payout relating to the financial year 2021, amounting to QR6.0bn. Currently, the Group has no long-term debt obligations. Group’s reported total assets and total equity reached QR38.8bn and QR36.2bn, respectively, as of 31 March 2022. The Group generated positive operating cash flows1 of QR2.8bn, with free cash flows1 of QR2.6bn during first three months of 2022. Petrochemicals segment reported a net profit of QR673m for the three-month ended 31 March 2022, up by 11% versus the same period of last year. This notable increase was primarily linked to improved product prices owing to better macroeconomic dynamics. The performance of the segment was also aided by higher production volumes as the segment’s fuel additive operations were on a commercial shutdown during 1Q-21. This was partially offset by slightly lower production volumesfrom polyethylene facilities.Blendedproductprices for the segment improved by 18% versus last year, against the backdrop of firm demand and higher energy prices, coupled with supply deficits. Sales volumes have improved by 13% compared to 1Q-21, in-line with the growth in production volumes. Growth in selling prices combined with higher sales volumes, led segmental revenue for 1Q-22 to reach QR1.8bn, with an improvement of 33% versus same period of last year. Fertilizer segment reported a net profit of QR1.7bn for the three-month period ended 31 March 2022, with an increase of 194%, versus the same period of last year. This increase was primarily driven by growth in revenue. Segment’s revenue grew by 147% for the quarter versus the same period of last year, primarily due to improved selling prices. Selling prices improved significantly by 113% versus the same period of last year and reflected positively on the segmental performance. Steel segment reported revenue of QR1.3bn, and net profit of QR261mn, moderately up by 6% and 1% versus 1Q-21, respectively. Segmental profit significantly increased by 199% versus 4Q-21, mainly on account of higher sales volumes. Sales volumes have improved significantly during current quarter, as the segment restarted DR-2 facility during 1Q-22, as against DR-1 which was operational until the end of 2021. DR-2 has a production capacity of 1,500k MT’s per annum compared to DR-1 that has an annual capacity of 800k MT’s per annum. Switch in mothballing of facilities would provide an opportunity of approximately 400k MT’s of DR per annum to be sold directly in the market. Industries Qatar will host an IR Earnings call with investors to discuss thelatestresults,business outlookand other matters on 26th April 2022 at 12:00 pm Doha Time. (QSE, QNBFS Research, Peninsula Qatar) Qatar central depository company amends the percentage of foreign ownership in commercial bank to become 100% of the capital – Qatar Central Securities Depository has modified the foreigners’ ownership limit of Commercial Bank to be 100% of the capital, which is equal to (4,047,253,750) shares. (QSE) QLMI posts 10.2% YoY increase but 13.3% QoQ decline in net profit in 1Q2022 – QLM Life & Medical Insurance Company's (QLMI) net profit rose 10.2% YoY (but declined 13.3% on QoQ basis) to QR27.6mn in 1Q2022.The company's net earned premiums came in at QR233.9mn in 1Q2022, which represents an increase of 18.1% YoY (+3.7% QoQ). EPS amounted to QR0.08 in 1Q2022 as compared to QR0.07 in 1Q2021. (QSE)
- 3. qnbfs.com Page 3 of 8 GISS reports net profit of QR83.3mn in 1Q2022, above our estimate – Gulf International Services (GISS) reported net profit of QR83.3mn in 1Q2022 as compared to net loss of QR5.5mn in 1Q2021 and net profit of QR12.9mn in 4Q2021, above our estimate of QR36.7mn (variation of +127%). The company's revenue came in at QR835mn in 1Q2022, which represents an increase of 18.4% YoY. However, on QoQ basis, revenue fell 1.1%. The earnings per share amounted to QR0.045 in 1Q2022 as compared to loss per share of QR0.003 in 1Q2021. Further, revenue growth from the aviation, drilling and catering segments led to an overall increase in the Group revenue. This was partially offset by a negative contribution in revenue from the insurance segment. GISS reported anEBITDAof QR198mn, an increase of77% from QR112mn during the same period in 2021. The growth in Group revenues led to the overall increase in net earnings. On the other hand, the Group’s direct costs increased by 7% mainly linked to inclined commercial activity. The Group’s total assets remained relatively flat during the year and stood at QR10.1bn as at March 31, 2022, an increase of 2% from QR9.9bn during the previous quarter. Cash and short-term investments stood at QR837mn, up by 20% com-pared to QR698mn in December 2021. Total debt at Group level amounted to QR4.3bn as at March 31, 2022. Current levels of debt continue to weigh on the Group’s net earnings, as finance cost is one of the key cost ingredients, and specifically limits drilling segment’s ability to accomplish the required profitability. Group’s management is in continuous discussion with different key stake-holders to restructure the debt with an aim to provide greater flexibility to manage liquidity and ease pressure on the Group’s financial position. During the first quarter of 2022, the Drilling segment entered international markets with two new contracts for liftboats. New contracts were won in KSA and Maldives for liftboats, building international footprints for the segment, while enhancing asset utilization. The Drilling segment reported a revenue of QR321mn for the first quarter of 2022, up by 62% compared to 1Q2021. The segment reported a net loss of QR10mn for Q1 2022, compared to a net loss of QR72mn during the same period last year. Reduction in losses was mainly attributed to growth in segmental revenue. The Aviation segment continues towitness improved set of performance with better flying activity withinboth domestic and international operations. Also, contributions from MRO and international business continue to support the segment performance. The Group’s Aviation segment reported a total revenue of QR206mn for the first quarter of 2022, with an increase of 25% compared to 1Q2021. The increase was mainly attributed to higher flying activity recorded within both domestic and inter-national operations, coupled with growth in revenue noted across the international operations, mainly from the Turkish subsidiary. The segmental net profit reached QR79mn, representing an increase of 59% compared to 1Q2021, mainly on account of growth in revenue. The Insurance segment managed to build up its strong performance by further expanding its general line of business. However, medical insurance business witnessed loss of certain contracts. Efforts are underway to explore new opportunities within domestic retail and SME markets. Also, performance of the segment investment port-folio remained strong, on the back of surge in capital markets. Revenue within the insurance segment for three-month period ended March 31, 2022 decreased by 24% compared to 1Q2021, to reach QR195mn. Decline in revenue was mainly linked to loss of two insurance contracts within medical line of business. This decline was partially offset by growth in premiums from the general insurance line of business, on account of new contracts and renewals of existing contracts. On the contrary, segmental net earnings increased by 22% compared to 1Q2021, to reach QR19m.The Catering segment improved its performance on the back of realizations from the new contract won during last year. Additionally, certain contracts have been renewed within man-power segments, with broader scope improving overall service volumes for the segment. Moreover, the segment was able to improve its profitability margins, as industry specific pandemic-linked restrictions gradually started to subside. The catering segment reported a revenue of QR113mn, an increase of 31% compared to the same period last year. Revenue increase was mainly due to the growth in revenue within the manpower segment,on theback of realizations froma new contract won during last year. The segment reported a net profit of QR100k for the three-month period ended March 31, 2022, compared to a net loss of QR500mn for 1Q2021, mainly due to higher revenues. (QSE, QNBFS Research, Peninsula Qatar) GWCS posts 6.3% YoY increase but 4.4% QoQ decline in net profit in 1Q2022, in-line with our estimate – Gulf Warehousing Company's (GWCS) net profit rose 6.3% YoY (but declined 4.4% on QoQ basis) to QR57.8mn in 1Q2022, in line with our estimate of QR56.6mn (variation of +2%). The company's revenue came in at QR351.4mn in 1Q2022, which represents an increase of 17.6% YoY. However, on QoQ basis, revenue fell 1.3%. EPS amounted to QR0.10 in 1Q2022 as compared to QR0.09 in 1Q2021. Further, GWCS’ Chairman Sheikh Abdullah bin Fahad bin Jassim bin Jabor Al Thani stated, “Driven by a strong recovery and a rise in exports, Qatar’s economic prospects look great despite global challenges, and GWCS is committed to being a part of this growth trajectory. We will continue to expand and diversify our offerings with the aim of further strengthening Qatar’s position as a global and regional logistics hub and helping the nation achieve the National Vision 2030.” In recognition of its efforts, in the first quarter of 2022, GWCS was awarded the Best Customs Brokerage Company in Qatar by the General Authority of Customs, which reaffirmed its steadfast dedication to its clients as well as the Government. GWCS also became the first company to get accredited as an Authorized Economic Operator (AEO) from Qatar’s General Authority of Customs and will now be able to offer its diversified services with quicker turnarounds and higher compliance to world-class safety and security standards. “GWCS is constantly striving for excellence and identifying innovative ways to make logistics faster, simpler and more cost-effective. With the FIFA World Cup Qatar 2022 just a few months away, we are getting ready to deliver a never-seen-before experience which will redefine mega sports logistics and set new benchmarks,” remarked Ranjeev Menon, Group CEO GWCS. GWCS has recently launched a new multiplatform campaign across Europe, Middle East and Africa (EMEA) to highlight their global logistics. The campaign, titled ‘Life, Delivered’, showcases GWCS’ unique role in providing intricateplanning androbust infrastructurefor logistics spanning various sectors including cold chain, oil and gas, pharmaceuticals, fine art and mega events such as the FIFA World Cup. (QSE, QNBFS Research, Peninsula Qatar) VFQS posts62.7% YoY increasebut15.4% QoQ decline innet profit in 1Q2022, beating our estimate – Vodafone Qatar's (VFQS) net profit rose 62.7% YoY (but declined 15.4% on QoQ basis) to QR107.4mn in 1Q2022, beating our estimate of QR78.8mn (variation of +36.2%). The company's revenue came in at QR730.6mn in 1Q2022, which represents an increase of 24.8% YoY. However, on QoQ basis, revenue fell 6.4%. EPS amounted to QR0.025 in 1Q2022 as compared to QR0.016 in 1Q2021. Further, EBITDA for the period increased by 28% y-o-y to reach QR301mn led by higher service revenue and the continued effectiveness in implementing the Company’s cost optimization program. Consequently, EBITDA margin rose by 1.2 percentage points to 41.2%. Lastly, Vodafone Qatar is now serving 2mn mobile customers representing a growth of 19% compared to last year (QSE, QNBFS Research, Peninsula Qatar) QIIK's bottom line rises 5.0% YoY and 80.3% QoQ in 1Q2022, in-line with our estimate – Qatar International Islamic Bank's (QIIK) net profit rose 5.0% YoY (+80.3% QoQ) to QR294.9mn in 1Q2022, in line with our estimate of QR296.2mn (variation of -0.4%). Total income from financing & investing activities decreased 6.9% YoY and 2.0% QoQ in 1Q2022 to QR516.9mn. The company's total income came in at QR593.4mn in 1Q2022, which represents a decrease of 2.8% YoY (-2.1% QoQ). The bank's total assets stood at QR64.8bn at the end of March 31, 2022, up 4.0%YoY (+4.9% QoQ). Financing assets were QR37.8bn, registering a decline of 10.0% YoY at the end of March 31, 2022. However, on QoQ basis, financing assets increased 2.2%. Customers' current accounts declined 2.1% YoY to reach QR8.0bn at the end of March 31, 2022. However, on QoQ basis, customers' current accounts rose 7.9%. The earnings per share amounted to QR0.19 in 1Q2022 as compared to QR0.19 in 1Q2021. (QSE, QNBFS Research) MPHC's bottom line rises 16.9% YoY and 4.6% QoQ in 1Q2022 – Mesaieed Petrochemical Holding Company's (MPHC) net profit rose 16.9% YoY (+4.6% QoQ) to QR442.9mn in 1Q2022.The company's share of profit from joint ventures came in at QR435.2mn in 1Q2022, which represents an increase of 15.9% YoY (+4.7% QoQ). EPS amounted to QR0.035 in 1Q2022 as compared to QR0.030 in 1Q2021. (QSE) MERS' net profit declines 12.1% YoY and 37.4% QoQ in 1Q2022 – Al Meera Consumer Goods Company's (MERS) net profit declined 12.1% YoY (-37.4% QoQ) to QR43.2mn in 1Q2022.The company's sales came in at QR703mn in 1Q2022, which represents a decrease of 2.8% YoY. However, on QoQ basis, sales rose 2.0%. EPS amounted to QR0.22 in 1Q2022 as compared to QR0.25 in 1Q2021. (QSE)
- 4. qnbfs.com Page 4 of 8 QIMD posts 40.3% YoY increase but 4% QoQ decline in net profit in 1Q2022 – Qatar Industrial Manufacturing Company's (QIMD) net profit rose 40.3% YoY (but declined 4% on QoQ basis) to QR40.8mn in 1Q2022. EPS amounted to QR0.086 in 1Q2022 as compared to QR0.06 in 1Q2021. (QSE) SIIS posts ~11% YoY increase but ~10% QoQ decline in net profit in 1Q2022 – Salam International Investment Limited's (SIIS) net profitrose ~11% YoY(but declined ~10% on QoQ basis) to ~QR12.7mn in 1Q2022. The earnings per share amounted to QR0.011 in 1Q2022 as compared to loss per share of QR0.010 in 1Q2021. (QSE) MCCS' net profit declines 4.5% YoY and 63.2% QoQ in 1Q2022 – Mannai Corporation's (MCCS)net profitdeclined 4.5% YoY (-63.2% QoQ) to QR31.8mn in 1Q2022. EPS amounted to QR0.070 in 1Q2022 as compared to QR0.073 in 1Q2021. (QSE) QATI's bottom line rises 11.1% YoY and 89.5% QoQ in 1Q2022 – Qatar Insurance Company's (QATI) net profit rose 11.1% YoY (+89.5% QoQ) to QR223mn in 1Q2022.The company's net earned premiums came in at QR2,095.1mn in 1Q2022, which represents an increase of 9.4% YoY. However, on QoQ basis, net earned premiums fell 13.5%. EPS amounted to QR0.062 in 1Q2022 as compared to QR0.055 in 1Q2021. (QSE) ORDS posts 241.1% YoY increase but 18.3% QoQ decline in net profit in 1Q2022 – Ooredoo 's (ORDS) net profit rose 241.1% YoY (but declined 18.3% on QoQ basis) to QR659.1mn in 1Q2022.The company's revenue came in at QR5,545mn in 1Q2022, which represents a decrease of 23% YoY (-28.7%QoQ). EPS amounted to QR0.21 in 1Q2022 as compared to QR0.06 in 1Q2021. (QSE, Company financials) QAMC posts 93.5% YoY increase but 23.5% QoQ decline in net profit in 1Q2022 – Qatar Aluminium Manufacturing Company's (QAMC) net profit rose 93.5% YoY (but declined 23.5% on QoQ basis) to QR239.6mn in 1Q2022.The company's share of net results of investment in a joint venture came in at QR233.1mn in 1Q2022, which represents an increase of 89.5% YoY. However, on QoQ basis, share of net results of investment in a joint venture fell 25.2%. EPS amounted to QR0.043 in 1Q2022 as compared to QR0.022 in 1Q2021. (QSE) BLDN's net profit declines 41.2% YoY and 18.9% QoQ in 1Q2022 – Baladna's (BLDN) net profit declined 41.2% YoY (-18.9% QoQ) to QR25.9mn in 1Q2022.The company's revenue came in at QR239.3mn in 1Q2022, which represents an increase of 31.3% YoY (+13.8% QoQ). EPS amounted to QR0.014 in 1Q2022 as compared to QR0.023 in 1Q2021. (QSE) AHCS posts 8.4% YoY increase but 24.7% QoQ decline in net profit in 1Q2022 – Aamal Company's (AHCS) net profit rose 8.4% YoY (but declined 24.7% on QoQ basis) to QR73.6mn in 1Q2022.The company's revenue came in at QR453.5mn in 1Q2022, which represents an increase of 45% YoY. However, on QoQ basis, revenue fell 8.1%. EPS amounted to QR0.012 in 1Q2022 as compared to QR0.011 in 1Q2021. (QSE)
- 5. qnbfs.com Page 5 of 8 Qatar Stock Exchange Top Gainers Top Decliners Source: Qatar Stock Exchange (QSE) Source: Qatar Stock Exchange (QSE) Most Active Shares by Value (QR Million) Most Active Shares by Volume (Million) Source: Qatar Stock Exchange (QSE) Source: Qatar Stock Exchange (QSE) Investor Trading Percentage to Total Value Traded Net Traded Value by Nationality (QR Million) Source: Qatar Stock Exchange (QSE) Source: Qatar Stock Exchange (QSE) 7.9% 4.8% 3.7% 3.6% 2.6% 0.0% 4.0% 8.0% 12.0% Islamic Holding Group Ooredoo QLM Life & Medical Insurance Company Medicare Group Qatar First Bank -33.5% -12.8% -7.9% -7.3% -6.9% -45.0% -30.0% -15.0% 0.0% Dlala Brokerage & Investment Holding Company Mannai Corporation Qatar General Insurance & Reinsurance Company Investment Holding Group Industries Qatar 579.4 525.4 398.2 206.8 201.0 0.0 210.0 420.0 630.0 QNB Group Industries Qatar Masraf Al Rayan The Commercial Bank Qatar Islamic Bank 134.6 116.0 72.3 70.9 70.7 0.0 50.0 100.0 150.0 Salam International Investment Limited Baladna Gulf International Services Investment Holding Group Masraf Al Rayan 0% 20% 40% 60% 80% 100% Buy Sell 50.63% 34.51% 20.70% 28.10% 19.48% 12.79% 9.19% 24.59% Qatari Individuals Qatari Institutions Non-Qatari Individuals Non-Qatari Institutions 2,663 1,070 2,337 1,396 326 -325 -1,000 0 1,000 2,000 3,000 Qatari Non-Qatari Net Investment Total Sold Total Bought
- 6. qnbfs.com Page 6 of 8 TECHNICAL ANALYSIS OF THE QSE INDEX Source: Bloomberg The QE index closed further down (-3.3%) from the previous week; it closed at 13,590.81 points. The indecision candlestick seen in the past weeks is confirmed and the Index moved lower into a correction. Our weekly time-frame support level is at the 12,500 points, and resistance at the 15,000 level. DEFINITIONS OF KEY TERMS USED IN TECHNICAL ANALYSIS RSI (Relative Strength Index) indicator – RSI is a momentum oscillator that measures the speedand change of price movements. The RSI oscillates between 0 to 100. The index is deemed to be overbought once the RSI approaches the 70 level, indicating that a correction is likely. On the other hand, if the RSI approaches 30, it is an indication that the index may be getting oversold and therefore likely to bounce back. MACD (Moving Average Convergence Divergence) indicator – The indicator consists of the MACD line and a signal line. The divergence or the convergence of the MACD line with the signal line indicates the strength in the momentum during the uptrend or downtrend, as the case may be. When the MACD crosses the signal line from below and trades above it, it gives a positive indication. The reverse is the situation for a bearish trend. Candlestick chart – A candlestick chart is a price chart that displays the high, low, open, and close for a security. The ‘body’ of the chart is portion between the open and close price, while the high and low intraday movements form the ‘shadow’. The candlestick may represent any time frame. We use a one-day candlestick chart (every candlestick represents one trading day) in our analysis. Doji candlestick pattern – A Doji candlestick is formed when a security's open and close are practically equal. The pattern indicates indecisiveness, and based on preceding price actions and future confirmation, may indicate a bullish or bearish trend reversal. ShootingStar/Inverted Hammer candlestick patterns – These candlestick patterns have a small real body (open price and close price are near to each other), and a long upper shadow (large intraday movement on the upside). The Shooting Star is a bearish reversal pattern that forms after a rally. The Inverted Hammer looks exactly like a Shooting Star, but forms after a downtrend. Inverted Hammers represent a potential bullish trend reversal.
- 7. qnbfs.com Page 7 of 8 Source: Bloomberg Company Name Price April 28 % Change WTD % Change YTD Market Cap. QR Million TTM P/E P/B Div. Yield Qatar National Bank 23.25 (0.21) 15.16 214,747 17.2 2.8 2.4 Qatar Islamic Bank 24.49 (3.09) 33.61 57,868 16.7 2.8 2.3 Commercial Bank of Qatar 7.69 2.52 13.93 31,119 14.6 1.7 2.1 Doha Bank 2.60 0.04 (18.75) 8,061 14.8 0.8 2.9 Al Ahli Bank 4.00 0.00 9.66 10,205 14.7 1.6 3.6 Qatar International Islamic Bank 11.55 (6.55) 25.41 17,483 19.4 2.8 3.2 Masraf Al Rayan 5.39 (6.23) 16.16 50,127 26.9 2.0 3.2 Qatar First Bank 1.57 2.55 (0.02) 1,252 8.3 1.9 N/A National Leasing 0.89 0.56 (5.11) 441 N/A 0.7 N/A Dlala Holding 1.70 (33.55) (7.70) 324 14.2 1.3 N/A Qatar & Oman Investment 0.85 (2.42) 4.05 267 112.9 0.9 1.2 Islamic Holding Group 6.35 7.94 60.96 360 32.0 2.4 0.8 Banking and Financial Services 392,254 Zad Holding 18.30 0.33 15.06 5,009 27.2 3.1 3.4 Qatar German Co. for Medical Devices 2.20 (4.89) (30.82) 254 206.9 7.7 N/A Salam International Investment 1.01 (3.90) 23.44 1,156 21.9 0.7 N/A Baladna 1.47 (6.69) 1.38 2,785 24.1 1.2 3.6 Medicare Group 6.90 3.56 (18.80) 1,942 26.2 2.0 26.1 Qatar Cinema & Film Distribution 3.50 0.00 (1.41) 220 73.4 1.6 1.7 Qatar Fuel 18.33 (2.03) 0.27 18,225 18.6 2.1 4.1 Qatar Meat and Livestock 3.10 1.31 (13.75) 558 N/A 2.1 N/A Mannai Corp. 8.89 (12.84) 87.24 4,056 15.8 1.9 3.4 Al Meera Consumer Goods 19.00 (1.09) (3.06) 3,800 19.9 2.6 4.7 Consumer Goods and Services 38,004 Qatar Industrial Manufacturing 3.10 (1.15) 1.11 1,475 9.8 0.8 3.9 Qatar National Cement 5.07 (2.25) (0.53) 3,315 14.3 1.1 5.9 Industries Qatar 18.81 (6.88) 21.43 113,801 12.2 3.1 5.3 Qatari Investors Group 2.37 (1.21) 6.76 2,947 12.4 1.0 4.2 Qatar Electricityand Water 17.10 (4.74) 3.01 18,810 12.6 1.5 4.7 Aamal 1.18 (0.93) 8.39 7,403 23.7 1.0 4.3 Gulf International Services 1.95 0.88 13.46 3,618 25.2 1.1 N/A Mesaieed Petrochemical Holding 2.59 (6.50) 23.92 32,539 16.9 2.0 4.2 Invesment Holding Group 2.31 (7.31) 87.71 1,915 71.5 2.2 N/A Qatar Aluminum Manufacturing 2.40 (5.88) 33.26 13,392 14.1 2.2 3.3 Industrials 199,214 Qatar Insurance 2.45 0.82 (10.91) 8,002 16.3 1.0 4.1 QLM Life & Medical Insurance 5.50 3.68 8.91 1,925 17.7 3.6 4.0 Doha Insurance 1.95 (1.62) 1.46 974 11.7 0.8 6.2 Qatar General Insurance & Reinsurance 1.93 (7.89) (3.75) 1,685 16.0 0.3 N/A Al Khaleej Takaful Insurance 3.69 (2.97) 2.42 941 24.2 1.8 2.0 Qatar Islamic Insurance 8.60 1.18 7.50 1,290 15.6 2.9 4.7 Insurance 14,817 United Development 1.45 (2.68) (5.84) 5,134 14.2 0.5 3.8 Barwa Real Estate 3.40 (3.03) 10.95 13,211 11.5 0.6 5.2 Ezdan Real Estate 1.32 (0.83) (1.64) 34,986 517.3 1.1 N/A Mazaya Qatar Real Estate Development 0.89 0.91 (3.15) 1,031 N/A 1.0 N/A Real Estate 54,363 Ooredoo 7.49 4.77 6.68 23,989 46.3 1.0 4.0 Vodafone Qatar 1.65 1.29 (1.08) 6,970 19.0 1.6 3.6 Telecoms 30,959 Qatar Navigation (Milaha) 8.51 (2.64) 11.42 9,669 12.2 0.6 3.5 Gulf Warehousing 4.25 0.00 (6.46) 249 10.8 1.2 2.4 Qatar Gas Transport (Nakilat) 3.42 (3.12) 3.64 18,948 13.3 2.0 3.5 Transportation 28,865 Qatar Exchange 760,720
- 8. qnbfs.com Contacts QNB Financial Services Co. W.L.L. Contact Center: (+974) 4476 6666 info@qnbfs.com.qa Doha, Qatar Saugata Sarkar, CFA, CAIA Head of Research saugata.sarkar@qnbfs.com.qa Shahan Keushgerian Senior Research Analyst shahan.keushgerian@qnbfs.com.qa . Disclaimer and Copyright Notice: This publication has been prepared by QNB Financial Services Co. W.L.L. (“QNBFS”) a wholly-owned subsidiary of Qatar National Bank (Q.P.S.C.). QNB FS is regulated by the Qatar Financial Markets Authority and the Qatar Exchange. Qatar National Bank (Q.P.S.C.) is regulated by the Qatar Central Bank. This publication expresses the views and opinions of QNBFS at a given time only. It is not an offer, promotion or recommendation to buy or sell securities or other investments, nor is it intended to constitute legal, tax, accounting, or financial advice. QNBFS accepts no liability whatsoever for any direct or indirect losses arising from use of this report. Any investment decision should depend on the individual circumstances of the investor and be based on specifically engaged investment advice. We therefore strongly advise potential investors to seek independent professional advice before making any investment decision. Although the information in this report has been obtained from sources that QNBFS believes to be reliable, we have not independently verified such information and it may not be accurate or complete. QNBFS does not make any representations or warranties as to the accuracy and completeness of the information it may contain, and declines any liability in that respect. For reports dealing with Technical Analysis, expressed opinions and/or recommendations may be different or contrary to the opinions/recommendations of QNBFS Fundamental Research as a result of depending solely on the historical technical data (price and volume). QNBFS reserves the right to amend the views and opinions expressed in this publication at any time. It may also express viewpoints or make investment decisions that differ significantly from, or even contradict, the views and opinions included in this report. This report may not be reproduced in whole or in part without permission from QNBFS. COPYRIGHT: No part of this document may be reproduced without the explicit written permission of QNBFS. Page 8 of 8