

Recommended
More Related Content
What's hot
What's hot (20)
Viewers also liked
Viewers also liked (20)
Similar to Weekly market report
Similar to Weekly market report (20)
More from QNB Group
More from QNB Group (20)
Recently uploaded
Recently uploaded (20)
Weekly market report
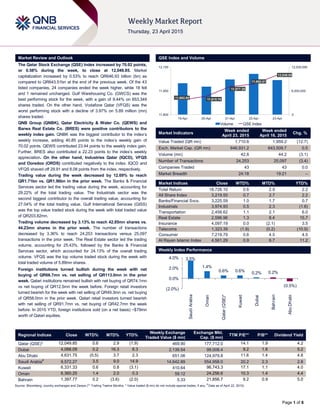
- 1. ` Page 1 of 6 Market Review and Outlook QSE Index and Volume The Qatar Stock Exchange (QSE) Index increased by 70.02 points, or 0.58% during the week, to close at 12,049.85. Market capitalization increased by 0.53% to reach QR646.93 billion (bn) as compared to QR643.51bn at the end of the previous week. Of the 43 listed companies, 24 companies ended the week higher, while 18 fell and 1 remained unchanged. Gulf Warehousing Co. (GWCS) was the best performing stock for the week, with a gain of 9.44% on 653,349 shares traded. On the other hand, Vodafone Qatar (VFQS) was the worst performing stock with a decline of 3.97% on 5.89 million (mn) shares traded. QNB Group (QNBK), Qatar Electricity & Water Co. (QEWS) and Barwa Real Estate Co. (BRES) were positive contributors to the weekly index gain. QNBK was the biggest contributor to the index’s weekly increase, adding 40.85 points to the index’s weekly gain of 70.02 points. QEWS contributed 23.44 points to the weekly index gain. Further, BRES also contributed a 22.23 points to the index’s weekly appreciation. On the other hand, Industries Qatar (IQCD), VFQS and Ooredoo (ORDS) contributed negatively to the index. IQCD and VFQS shaved off 29.91 and 8.08 points from the index, respectively. Trading value during the week decreased by 12.69% to reach QR1.71bn vs. QR1.96bn in the prior week. The Banks & Financial Services sector led the trading value during the week, accounting for 29.22% of the total trading value. The Industrials sector was the second biggest contributor to the overall trading value, accounting for 27.04% of the total trading value. Gulf International Services (GISS) was the top value traded stock during the week with total traded value of QR203.82mn. Trading volume decreased by 3.13% to reach 42.85mn shares vs. 44.23mn shares in the prior week. The number of transactions decreased by 3.36% to reach 24,253 transactions versus 25,097 transactions in the prior week. The Real Estate sector led the trading volume, accounting for 25.43%, followed by the Banks & Financial Services sector, which accounted for 24.13% of the overall trading volume. VFQS was the top volume traded stock during the week with total traded volume of 5.89mn shares. Foreign institutions turned bullish during the week with net buying of QR66.7mn vs. net selling of QR113.0mn in the prior week. Qatari institutions remained bullish with net buying of QR74.1mn vs net buying of QR12.5mn the week before. Foreign retail investors turned bearish for the week with net selling of QR49.3mn vs. net buying of QR58.0mn in the prior week. Qatari retail investors turned bearish with net selling of QR91.7mn vs. net buying of QR42.7mn the week before. In 2015 YTD, foreign institutions sold (on a net basis) ~$79mn worth of Qatari equities. Market Indicators Week ended April 23, 2015 Week ended April 16, 2015 Chg. % Value Traded (QR mn) 1,710.6 1,959.2 (12.7) Exch. Market Cap. (QR mn) 646,931.2 643,509.7 0.5 Volume (mn) 42.8 44.2 (3.1) Number of Transactions 24,253 25,097 (3.4) Companies Traded 43 43 0.0 Market Breadth 24:18 19:21 – Market Indices Close WTD% MTD% YTD% Total Return 18,726.10 0.6 2.9 2.2 All Share Index 3,219.50 0.7 2.7 2.2 Banks/Financial Svcs. 3,225.59 1.0 1.7 0.7 Industrials 3,974.93 0.5 2.3 (1.6) Transportation 2,458.62 1.1 2.1 6.0 Real Estate 2,596.96 1.3 8.4 15.7 Insurance 4,097.19 0.0 (2.1) 3.5 Telecoms 1,323.39 (1.9) (0.2) (10.9) Consumer 7,219.79 0.6 4.5 4.5 Al Rayan Islamic Index 4,561.29 0.9 6.7 11.2 Market Indices Weekly Index Performance Regional Indices Close WTD% MTD% YTD% Weekly Exchange Traded Value ($ mn) Exchange Mkt. Cap. ($ mn) TTM P/E** P/B** Dividend Yield Qatar (QSE)* 12,049.85 0.6 2.9 (1.9) 469.90 177,712.0 14.1 1.9 4.2 Dubai 4,088.09 0.2 16.3 8.3 2,139.54 99,008.4 9.2 1.6 5.2 Abu Dhabi 4,631.75 (0.5) 3.7 2.3 651.06 124,979.8 11.6 1.4 4.8 Saudi Arabia# 9,572.27 3.5 9.0 14.9 14,642.89 554,958.0 20.2 2.3 2.8 Kuwait 6,331.33 0.6 0.8 (3.1) 410.64 96,743.3 17.1 1.1 4.0 Oman 6,360.25 1.4 2.0 0.3 59.12 24,256.6 10.3 1.4 4.4 Bahrain 1,397.77 0.2 (3.6) (2.0) 5.33 21,856.7 9.2 0.9 5.0 Source: Bloomberg, country exchanges and Zawya (** Trailing Twelve Months; * Value traded ($ mn) do not include special trades, if any; # Data as of April 22, 2015) 11,892.95 11,915.76 11,977.35 11,992.61 12,049.85 0 6,000,000 12,000,000 11,800 11,950 12,100 19-Apr 20-Apr 21-Apr 22-Apr 23-Apr Volume QSE Index 3.5% 1.4% 0.6% 0.6% 0.2% 0.2% (0.5%) (2.0%) 0.0% 2.0% 4.0% SaudiArabia Oman Qatar(QSE)* Kuwait Dubai Bahrain AbuDhabi
- 2. Page 2 of 6 News Market & Corporate News CBQK posted a disappointing bottom-line growth in 1Q2015 due to higher-than-expected provisions. CBQK reported a net profit of QR452.3mn falling short of our estimate of QR555.3mn (18.5% deviation) as well as BBG’s consensus of QR528.40mn (14.4% deviation). This miss was mainly due to provisions. The bank’s bottom-line dropped by 15.3% YoY (+22.2% QoQ). However, core income came in line with our estimate. CBQK reported a net interest income of QR625.5mn in-line with our estimate of QR624.3mn. Moreover, the bank registered a total revenue and net operating income of QR1,052mn (in-line with our estimate of QR1,071.5mn) and QR651.2mn (in-line with our estimate of QR645.5mn), respectively. CBQK reported net provisions and impairments of QR176.3mn vs. our estimate of QR62.0mn, which was the main reason behind the miss. QoQ growth in bottom-line was driven by lower provisions while the YoY decline was due to a surge in provisions. The bank’s net interest income was flat QoQ and inched up by 0.8% YoY. Moreover, annualized NIMs seem to have stabilized QoQ at ~2.54%. On a positive note, fees & commissions grew by 7.6% YoY (+12.2% QoQ). The bank’s cost-to-income ratio deteriorated to 38.1% vs. 37.1% in 4Q2014 due to weaker revenue. On the other hand, the bank’s expenses were contained. Lack of growth in loan book vs. domestic peers not encouraging. CBQK’s loan book dipped by 0.8% YTD to QR71.9bn vs. loan growth of 8.5% for MARK, 4.7% for DHBK, 8.1% for QIBK and 6.1% for QIIK. On the other hand, CBQK’s deposits were flat YTD at QR61.7bn. Thus, CBQK ended 1Q2015 with an LDR 117% vs. 118% at the end of 2014. We note that Abank posted a ~10% YTD loan book growth vs. a 11% weakening in TRY spot rates over the same period. Asset quality showing signs of deterioration. The bank’s NPLs increased by 2.2% QoQ with the NPL ratio climbing up to 3.89% vs. 3.79% in FY2014 (1Q2014: 3.55%). On the other hand, the coverage ratio improved to 77% vs. 74% in FY2014. (QNBFS Research, Company Financials) DHBK’s 1Q2015 QoQ profitability driven by a drop in provisions and opex – Doha Bank (DHBK) reported a net income of QR420.2mn in 1Q2015 slightly ahead of our estimate of QR401.8mn (4.6% variation). DHBK’s Net operating income (QR461.3mn) was in-line with our estimate of QR457.8mn (0.8% variation). Thus, the beat was mainly due to lower provisions vs. our estimate. Net income surged by 92.2% QoQ (+5.2% YoY). QoQ growth is primarily attributed to an 80.8% plunge in net provisions (QR38.5mn in 1Q2015 vs. QR200.4mn in 4Q2014 and QR72.5mn in 1Q2014) followed by a 7.1% decline in opex. As such the cost-to-income ratio improved QoQ to 35.4% vs. 39.1% in 4Q2014. The bank’s net interest income rose 6.2% QoQ (+4.4% YoY) to QR506.7mn. Hence, annualized NIM improved to ~2.94% in 1Q2015 vs. ~2.88% in 4Q2014. Fees and commissions dropped by 22.2% QOQ to QR118.7mn while it grew by 24.9% YoY. Overall, non-interest income declined by 5.1% and 2.4% QoQ and YoY, respectively mainly due to a sharp decline investment income (-31.8% QoQ and 78.3% YoY). Net loans grew by 4.7% YTD to QR50.8bn while deposits receded by 1.6% YTD to QR45.2bn. As a result, the LDR was lifted to 112% vs. 106% at the end of 2014. (QNBFS Research, Company Financials) QEWS reports better-than-expected 1Q2015 profitability as margins expand. QEWS reported QR667.2mn in revenue for 1Q2015 vs. our estimate of QR672.6mn. Revenue decreased 10% QoQ and increased 1% YoY; revenue was up 4% YoY excluding the impact of RAF A SAT stations (Al Saliyah and Doha South Super) that were discontinued, as expected, once their PPA expired YE2014. We were projecting QR303.8mn in net income but the company beat our estimate coming in at QR346.1mn (-4% QoQ, +16% YoY). The majority of the beat was due to an increase in GMs with cash cost of sales declining to 39.2% vs. our conservative estimate of 42.4%. Depreciation also come down to QR103.9mn vs. our estimate of QR118.3mn. The beat in depreciation will likely sustain going forward given that Ras Abu Fontas A has been fully depreciated by YE2014. We retain our bullish stance on QEWS with an Accumulate rating and a QR229 price target. We will adjust our net income estimate upward given the beat this quarter and lower depreciation charges going forward. New projects on the horizon: QEWS should benefit from two new water plants, RAF A2 (36 MIGD) from 2H2015 and RAF A3 (36 MIGD) from 4Q2016, adding ~28% to QEWS’ net water capacity. Further, Facility D (2,400 MW & 130 MIGD; 60% share) should be commissioned in 2018. We also expect contribution from Ras Laffan Industrial Water (recently upped to 65 MIGD from 36 MIGD; 60%) later in 2018. The latter two projects are not factored into our estimates/fair value. Overall, these four projects should expand QEWS’ net electricity & water capacity by 27% and 73%, respectively, in 2018. QEWS is seeking regional expansion and has set up a $1bn JV (60% stake), Nebras Power, with QPI/QH. The partners are valuing QEWS’ assets in Oman & Jordon (FY2014 BV: QR279.7mn) for sale to the JV; the Sur IPP in Oman is also planning an IPO in 2015. MARK net profit jumps 18.1% YoY in 1Q2015 – Masraf Al Rayan’s (MARK) bottom-line in 1Q2015 jumped 18.1% YoY to QR511mn as compared to QR432mn in 1Q2014. Earnings beat our estimate by 9% and BBG consensus by 11%. The beat was on the back of better net interest income & investing income and lower operating expenses. Total assets of the bank reached QR83.2bn as compared to QR69.4bn as of March 31, 2014, reflecting a growth of 19.9%. Financing assets grew 37.6% YoY to QR62.8bn whereas customers’ deposits reached QR60.8bn, registering a growth of 16.2% YoY. EPS for the period amounted QR0.68 as compared to QR0.58 in 1Q2014. Further, the bank reported that its capital adequacy ratio reached 17.41% as per Basel-III standards versus 18.65% on March 31, 2014 based on Basel-II standards. Non-performing loans (NPL) ratio continued to be one of the lowest in the banking industry at 0.09%. (Peninsula Qatar) QIIK reports net profit of QR212mn in 1Q2015 – Qatar International Islamic Bank (QIIK) reported a net profit of QR212.3mn (+5.7% and +4.0 QoQ and YoY, respectively) in 1Q2015, in-line with our estimate of QR212.3mn. The primary driver of growth was the reversal of provisions. The bank’s total loans grew by 6.1% YTD to QR23.2bn, while deposits dropped by 5.5% YTD to QR25.2bn. Thus, the LDR was lifted to 92% vs. 82% at the end of 2014. QIIK’s NPL ratio decreased to 0.96% vs. 0.98% at the end of 2014. The bank’s cost to income ratio remained unchanged YoY at 23.1% (4Q2014: 31.9%). QIIK’s capital adequacy under Basel III reached 18.49%. (QNBFS Research, Company Financials) MCCS 1Q2015 net profit climbs 10% YoY – Mannai Corporation (MCCS) reported an increase of 10% YoY in its 1Q2015 bottom-line to QR165.2mn. The company’s revenue grew by 14.33% YoY in 1Q2015. (Peninsula Qatar)
- 3. Page 3 of 6 Qatar Stock Exchange Top Gainers Top Decliners Source: Qatar Stock Exchange (QSE) Source: Qatar Stock Exchange (QSE) Most Active Shares by Value (QR Million) Most Active Shares by Volume (Million) Source: Qatar Stock Exchange (QSE) Source: Qatar Stock Exchange (QSE) Investor Trading Percentage to Total Value Traded Net Traded Value by Nationality (QR Million) Source: Qatar Stock Exchange (QSE) Source: Qatar Stock Exchange (QSE) 9.4% 7.3% 6.2% 6.2% 5.5% 0.0% 4.0% 8.0% 12.0% Gulf Warehousing Qatar & Oman Investment Qatari Investors Group Qatar German Co. for Medical Devices Qatar Electricity and Water -4.0% -2.1% -1.3% -1.2% -1.2% -6.0% -4.0% -2.0% 0.0% Vodafone Qatar Industries Qatar Qatar National Cement Qatar Fuel Ooredoo 203.8 181.9 127.0 121.5 102.8 0.0 80.0 160.0 240.0 Gulf International Services Barwa Real Estate QNB Group Industries Qatar Vodafone Qatar 5.9 5.5 3.9 3.7 2.3 0.0 2.0 4.0 6.0 Vodafone Qatar Ezdan Real Estate Qatar German Co. for Medical Devices Barwa Real Estate Gulf International Services 0% 20% 40% 60% 80% 100% Buy Sell 44.37% 49.73% 16.97% 12.64% 15.36% 18.24% 23.29% 19.39% Qatari Individuals Qatari Institutions Non-Qatari Individuals Non-Qatari Institutions 1,049 661 1,067 644 (18) 17 (200) - 200 400 600 800 1,000 1,200 Qatari Non-Qatari Net Investment Total Sold Total Bought
- 4. Page 4 of 6 TECHNICAL ANALYSIS OF THE QSE INDEX Source: Bloomberg The QSE Index increased slightly from last week, gaining 0.58% from last week yet creating a Hanged man candlestick. Although that candlestick indicates possible bearish turn on the Index; technical indicators show otherwise. The QSE Index is flirting with the moving averages, and the MACD’s Histogram shows a possible positive momentum to be expected. The RSI is flattish, which is a neutral sign. A positive rise to the 12,200 level is possible and a sustained close above that level on the weekly frame can be very positive for the coming month. The Immediate support level is situated around 11,800 level. DEFINITIONS OF KEY TERMS USED IN TECHNICAL ANALYSIS RSI (Relative Strength Index) indicator – RSI is a momentum oscillator that measures the speed and change of price movements. The RSI oscillates between 0 to 100. The index is deemed to be overbought once the RSI approaches the 70 level, indicating that a correction is likely. On the other hand, if the RSI approaches 30, it is an indication that the index may be getting oversold and therefore likely to bounce back. MACD (Moving Average Convergence Divergence) indicator – The indicator consists of the MACD line and a signal line. The divergence or the convergence of the MACD line with the signal line indicates the strength in the momentum during the uptrend or downtrend, as the case may be. When the MACD crosses the signal line from below and trades above it, it gives a positive indication. The reverse is the situation for a bearish trend. Candlestick chart – A candlestick chart is a price chart that displays the high, low, open, and close for a security. The ‘body’ of the chart is portion between the open and close price, while the high and low intraday movements form the ‘shadow’. The candlestick may represent any time frame. We use a one-day candlestick chart (every candlestick represents one trading day) in our analysis. Doji candlestick pattern – A Doji candlestick is formed when a security's open and close are practically equal. The pattern indicates indecisiveness, and based on preceding price actions and future confirmation, may indicate a bullish or bearish trend reversal. Shooting Star/Inverted Hammer candlestick patterns – These candlestick patterns have a small real body (open price and close price are near to each other), and a long upper shadow (large intraday movement on the upside). The Shooting Star is a bearish reversal pattern that forms after a rally. The Inverted Hammer looks exactly like a Shooting Star, but forms after a downtrend. Inverted Hammers represent a potential bullish trend reversal.
- 5. Page 5 of 6 Source: Bloomberg Company Name Price (April 23) % Change 5- Day % Change YTD Market Cap. QR Million TTM P/E P/B Div. Yield Qatar National Bank 193.00 2.39 (9.35) 135,048 12.6 2.5 3.9 Qatar Islamic Bank 102.50 (0.19) 0.29 24,220 14.7 2.3 4.1 Commercial Bank of Qatar 56.50 (0.88) (9.27) 18,455 10.3 1.1 5.6 Doha Bank 53.90 2.08 (5.44) 13,926 10.1 1.3 7.4 Al Ahli Bank 48.50 (0.82) (2.29) 8,813 14.2 2.2 2.8 Qatar International Islamic Bank 80.50 (0.62) (1.47) 12,185 14.6 2.4 5.0 Masraf Al Rayan 48.85 (0.10) 10.52 36,638 17.6 3.5 3.6 Al Khaliji Bank 20.80 3.48 (5.67) 7,488 12.5 1.3 4.8 National Leasing 22.05 2.08 10.25 1,091 25.3 0.9 3.9 Dlala Holding 30.80 0.49 (7.89) 875 13.1 3.0 N/A Qatar & Oman Investment 15.40 7.32 0.00 485 15.8 1.3 5.2 Islamic Holding Group 115.30 (0.60) (7.39) 461 27.9 7.8 2.6 Banking and Financial Services 259,685 Zad Holding 93.00 3.33 10.71 1,217 9.3 1.5 4.3 Qatar German Co. for Medical Devices 13.80 6.15 35.96 159 N/A 1.0 a Salam International Investment 13.60 2.26 (14.20) 1,555 19.5 0.9 4.4 Medicare Group 167.70 4.55 43.33 4,720 24.0 5.7 1.1 Qatar Cinema & Film Distribution 42.40 (1.17) 6.00 266 21.6 1.9 2.1 Qatar Fuel 179.50 (1.21) (12.14) 15,160 13.3 2.5 5.0 Qatar Meat and Livestock 61.00 5.17 0.99 1,098 17.6 4.0 4.1 Al Meera Consumer Goods 227.00 (0.83) 13.50 4,540 20.0 3.2 4.0 Consumer Goods and Services 28,715 Qatar Industrial Manufacturing 46.00 0.00 6.11 2,186 13.6 1.4 6.5 Qatar National Cement 118.90 (1.33) (0.92) 6,422 15.4 2.5 3.1 Industries Qatar 143.00 (2.05) (14.88) 86,515 15.2 2.9 4.9 Qatari Investors Group 48.00 6.19 15.94 5,968 26.4 2.6 1.6 Qatar Electricity and Water 204.00 5.48 8.80 22,440 13.8 3.6 3.7 Mannai Corp. 110.10 3.19 1.01 5,023 9.5 2.3 5.4 Aamal 16.50 1.60 14.06 10,395 18.1 1.4 5.8 Gulf International Services 86.70 1.40 (10.71) 16,112 10.2 4.6 6.3 Mesaieed Petrochemical Holding 26.20 (1.13) -11.2 32,916 22.8 2.5 4.2 Industrials 187,976 Qatar Insurance 78.00 (0.26) (0.99) 14,400 14.7 2.5 2.8 Doha Insurance 25.90 0.58 (10.69) 1,295 12.0 1.2 3.9 Qatar General Insurance & Reinsurance 56.50 0.53 10.13 4,495 4.9 0.8 3.1 Al Khaleej Takaful Insurance 42.80 (0.47) (3.11) 1,093 14.7 1.7 3.0 Qatar Islamic Insurance 82.40 1.73 4.30 1,236 14.7 4.0 4.9 Insurance 22,519 United Development 21.70 0.46 (8.01) 7,684 12.3 0.7 5.8 Barw a Real Estate 49.45 3.56 18.02 19,242 6.7 1.2 4.4 Ezdan Real Estate 17.01 0.41 14.01 45,119 33.6 1.5 2.4 Mazaya Qatar Real Estate Development 19.00 4.72 4.18 1,900 11.8 1.5 1.5 Real Estate 73,945 Qatar Telecom 100.80 (1.18) (18.64) 32,288 15.5 1.4 4.0 Vodafone Qatar 17.19 (3.97) 4.50 14,532 N/A 2.6 1.0 Telecoms 46,821 Qatar Navigation (Milaha) 99.40 (0.30) (0.10) 11,384 10.8 0.8 5.5 Gulf Warehousing 68.40 9.44 21.28 3,253 23.2 3.7 2.2 Qatar Gas Transport (Nakilat) 22.56 0.27 (2.34) 12,634 13.8 4.3 5.3 Transportation 27,271 Qatar Exchange 646,931
- 6. Contacts Saugata Sarkar Sahbi Kasraoui QNB Financial Services SPC Head of Research Head of HNI Contact Center: (+974) 4476 6666 Tel: (+974) 4476 6534 Tel: (+974) 4476 6544 PO Box 24025 saugata.sarkar@qnbfs.com.qa sahbi.alkasraoui@qnbfs.com.qa Doha, Qatar Disclaimer and Copyright Notice: This publication has been prepared by QNB Financial Services SPC (“QNBFS”) a wholly-owned subsidiary of QNB SAQ (“QNB”). QNBFS is regulated by the Qatar Financial Markets Authority and the Qatar Exchange QNB SAQ is regulated by the Qatar Central Bank. This publication expresses the views and opinions of QNBFS at a given time only. It is not an offer, promotion or recommendation to buy or sell securities or other investments, nor is it intended to constitute legal, tax, accounting, or financial advice. QNBFS accepts no liability whatsoever for any direct or indirect losses arising from use of this report. Any investment decision should depend on the individual circumstances of the investor and be based on specifically engaged investment advice. We therefore strongly advise potential investors to seek independent professional advice before making any investment decision. Although the information in this report has been obtained from sources that QNBFS believes to be reliable, we have not independently verified such information and it may not be accurate or complete. QNBFS does not make any representations or warranties as to the accuracy and completeness of the information it may contain, and declines any liability in that respect. For reports dealing with Technical Analysis, expressed opinions and/or recommendations may be different or contrary to the opinions/recommendations of QNBFS Fundamental Research as a result of depending solely on the historical technical data (price and volume). QNBFS reserves the right to amend the views and opinions expressed in this publication at any time. It may also express viewpoints or make investment decisions that differ significantly from, or even contradict, the views and opinions included in this report. This report may not be reproduced in whole or in part without permission from QNBFS COPYRIGHT: No part of this document may be reproduced without the explicit written permission of QNBFS. Page 6 of 6