QNBFS Weekly Market Report October 15, 2020
•
0 likes•111 views

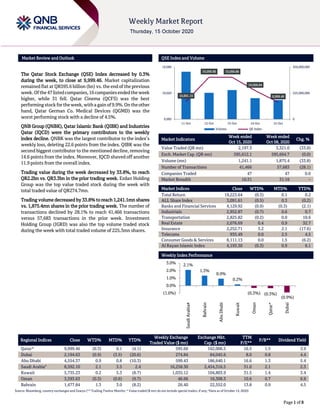
The Qatar Stock Exchange (QSE) Index decreased by 0.3% during the week, to close at 9,999.46

Recommended
Recommended
More Related Content
What's hot
What's hot (20)
Similar to QNBFS Weekly Market Report October 15, 2020
Similar to QNBFS Weekly Market Report October 15, 2020 (20)
More from QNB Group
More from QNB Group (20)
Recently uploaded
Recently uploaded (20)
QNBFS Weekly Market Report October 15, 2020
- 1. `````` Page 1 of 8 Market Review and Outlook QSE Index and Volume The Qatar Stock Exchange (QSE) Index decreased by 0.3% during the week, to close at 9,999.46. Market capitalization remained flat at QR595.6 billion (bn) vs. the end of the previous week. Ofthe47listedcompanies, 16companiesendedtheweek higher, while 31 fell. Qatar Cinema (QCFS) was the best performingstock fortheweek,withagainof9.9%. Ontheother hand, Qatar German Co. Medical Devices (QGMD) was the worst performing stock with a decline of 4.5%. QNB Group (QNBK), Qatar Islamic Bank (QIBK) and Industries Qatar (IQCD) were the primary contributors to the weekly index decline. QNBK was the largest contributor to the index’s weekly loss, deleting 22.6 points from the index. QIBK was the second biggest contributor to the mentioned decline, removing 14.6 points from the index. Moreover, IQCD shaved off another 11.9 points from the overall index. Trading value during the week decreased by 33.8%, to reach QR2.2bn vs. QR3.3bn in the prior trading week. Ezdan Holding Group was the top value traded stock during the week with total traded value of QR274.7mn. Trading volume decreased by 33.8% to reach 1,241.1mn shares vs. 1,875.4mn shares in the prior trading week. The number of transactions declined by 28.1% to reach 41,466 transactions versus 57,683 transactions in the prior week. Investment Holding Group (IGRD) was also the top volume traded stock during the week with total traded volume of 225.3mn shares. Market Indicators Week ended Oct 15, 2020 Week ended Oct 08, 2020 Chg. % Value Traded (QR mn) 2,197.3 3,321.0 (33.8) Exch. Market Cap. (QR mn) 595,612.1 595,664.7 (0.0) Volume (mn) 1,241.1 1,875.4 (33.8) Number of Transactions 41,466 57,683 (28.1) Companies Traded 47 47 0.0 Market Breadth 16:31 31:16 – Market Indices Close WTD% MTD% YTD% Total Return 19,223.64 (0.3) 0.1 0.2 ALL Share Index 3,091.61 (0.5) 0.3 (0.2) Banks and Financial Services 4,129.92 (0.9) (0.3) (2.1) Industrials 2,952.87 (0.7) 0.6 0.7 Transportation 2,825.82 (0.2) 0.0 10.6 Real Estate 2,076.69 0.4 0.9 32.7 Insurance 2,252.71 3.2 2.1 (17.6) Telecoms 935.49 0.0 2.5 4.5 Consumer Goods & Services 8,111.13 0.0 1.5 (6.2) Al Rayan Islamic Index 4,193.30 (0.3) 0.9 6.1 Weekly Index Performance Regional Indices Close WTD% MTD% YTD% Weekly Exchange Traded Value ($ mn) Exchange Mkt. Cap. ($ mn) TTM P/E** P/B** Dividend Yield Qatar* 9,999.46 (0.3) 0.1 (4.1) 595.66 162,006.5 16.5 1.5 3.9 Dubai 2,194.63 (0.9) (3.5) (20.6) 274.84 84,045.6 8.0 0.8 4.4 Abu Dhabi 4,554.37 0.9 0.8 (10.3) 599.43 186,640.1 16.6 1.3 5.4 Saudi Arabia# 8,592.10 2.1 3.5 2.4 16,258.30 2,454,316.5 31.0 2.1 2.3 Kuwait 5,735.23 0.2 5.3 (8.7) 1,035.12 104,803.9 31.5 1.4 3.4 Oman 3,593.63 (0.3) (0.6) (9.7) 46.66 16,308.3 10.6 0.7 6.9 Bahrain 1,477.84 1.3 3.0 (8.2) 26.40 22,552.0 13.8 0.9 4.5 Source: Bloomberg, country exchanges and Zawya (** Trailing Twelve Months; * Value traded ($ mn) do not include special trades, if any; #Data as of October 14, 2020) 10,001.15 10,056.95 10,056.86 10,026.04 9,999.46 0 225,000,000 450,000,000 9,960 10,020 10,080 11-Oct 12-Oct 13-Oct 14-Oct 15-Oct Volume QE Index 2.1% 1.3% 0.9% 0.2% (0.3%) (0.3%) (0.9%) (1.0%) 0.0% 1.0% 2.0% 3.0% SaudiArabia# Bahrain AbuDhabi Kuwait Oman Qatar* Dubai
- 2. Page 2 of 8 News Economic, Market & Corporate News QNB Group Financial Results for the Nine Months ended 30 September 2020; creating long-term shareholder value through sustainable, profitable growth – Net Profit for the nine months period reached QAR9.5 billion, a decrease of 15% from September 2019. Operating Income increased by 1% to reach QAR19.2 billion. This reflects QNB Group’s success in maintaining sustainable growth across a number of revenue segments. Despite the sudden onset of Covid-19, QNB Group continued to take all the necessary actions to protect the well- being of its employees, customers and shareholders. Also, the Group set aside additional QAR1.9 billion in respect of loan loss provisions over the last nine months period as a precautionary measure. The Group’s drive for operational efficiency is yielding cost-savings and improved revenue has helped QNB Group to materially improve efficiency (cost to income) ratio from 25.7% to 24.2%, considered one of the best ratios among large financial institutions in the MEA region. Total Assets reached QAR986 billion, an increase of 8% from 30 September 2019, mainly driven by strong growth in Loans and advances by 10% to reach QAR717 billion. Strong customer deposits generation helped to increase customer deposits by 8% to reach QAR715billion from 30 September 2019. QNB’s robust asset liability management capabilities helped QNB Group to maintain its loans to deposits ratio at 100% as at 30 September 2020. The ratio of non- performing loans to gross loans amounted to 2% as at 30 September 2020, one of the lowest amongst financial institutions in the MEA region, reflecting the high quality of the Group’s loan book and the effective management of credit risk. Also during the last nine months, QNB Group materially increased its loan loss provisioning by QAR1.9 billion, primarily to protect itself from potential loan losses due to ongoing economic challenges faced by borrowers in key markets where QNB Group operates. This helped the Group to maintain a coverage ratio of 104%, which reflects the conservative approach adopted by the Group towards non-performing loans. QNB Group reported robust levels of capital, liquidity and funding measured in terms of CAR achieved at 18.1%, LCR at 173% and NSFR at 104%. All of the required ratios were higher than the regulatory minimum requirements of the Qatar Central Bank and Basel Committee. QNB Group’s solid financial strength was supported by top tier credit ratings that continues to attract institutional, corporate and individual customers to bank with QNB, and provides assurances to investors and market participants. QNB remains the highest-rated bank in Qatar and one of the highest-rated banks in the world with ratings of Aa3 from Moody’s, A from S&P and A+ from Fitch. These ratings are a testament to QNB’s capital strength, governance, prudent risk management, business and operating model. This provides the Bank with a competitive advantage when accessing global capital markets for wholesale funding and enables the Bank to continue its growth and expansion plans in line with the strategy. In September 2020, QNB Group successfully completed the issuance of QNB Group’s first green benchmark bond and first ever green bond issued from Qatar and the largest green issuance by a financial institution in the MENA region. Under the EMTN Programme, a USD600 million tranche in the form of Senior Unsecured Notes was issued with a maturity of 5 years and listed on the London Stock Exchange under Sustainable Bond Market segment. QNB Group received subscriptions in excess of USD1.8 billion demonstrating the global investor’s confidence in QNB Group’s solid financial fundamentals and strong financial performance. The issuance was part of QNB Group’s ongoing strategy to ensure diversification of funding in terms of type, tenor and geography as an example of commitment to ESG principles. In addition to above, QNB Group has issued other bonds during the year, which were part of QNB Group’s ongoing strategy to ensure diversification of funding in terms of type, tenor and geography. These deals attracted strong interest around the world from key global investors, reflecting investors’ confidence in QNB Group’s financial strength and its position as the largest financial institution in the Middle East and Africa region. It also reflects their trust and confidence in QNB Group’s strategy over the coming years. (Press Release) QIBK’s net profit remains almost flat YoY and up 6.9% QoQ in 3Q2020, in-line with our estimate – Qatar Islamic Bank's (QIBK) net profit remained almost flat YoY (rose 6.9% on QoQ basis) to QR790.02mn in 3Q2020 (3Q2019: QR 790.05mn), in line withour estimate of QR762.5mn (variation of +3.6%). ‘Total net income from financing and investing activities’ increased 4.3% YoY in 3Q2020 to QR1,807.0mn. However, on QoQ basis ‘Total net income from financing and investing activities’ declined 1.3%. The company's ‘Total income’ came in at QR1,989.6mn in 3Q2020, which represents an increase of 0.7% YoY. However, on QoQ basis Total income fell 1.9%. EPS remained flat YoY at QR0.33 in 3Q2020 (2Q2020: QR0.31). The bank's total assets stood at QR170.0bn at the end of September 30, 2020, up 9.8% YoY (+2.6% QoQ). Financing assets were QR113.2bn, registering a rise of 5.7% YoY (+0.8% QoQ) at the end of September 30, 2020. Customers' current accounts rose 6.2% YoY to reach QR16.1bn at the end of September 30, 2020. However, on QoQ basis customers' current accounts fell 1.1%. Total shareholders’ equity of the bank has reached QR17.7bn, which is up 7.8% YoY. In 9M2020, QIBK has reported net profit of QR2.22bn, which is in line with the performance during the same period in 2019. Total income grew 4.4% YoY to QR5.96bn with income from financing and investing expanding 4.9% to QR5.36bn, reflecting a healthy performance in its core operating activities despite the support provided to the customers impacted by COVID-19 pandemic. Total operating expenses for the nine months’ period ended September 30 decreased to QR821.9mn from QR827.8mn for the same period in 2019. EPS remained flat YoY at QR0.94 in 9M2020. Strict cost controls, supported by higher operating revenues, enabled further enhancement of efficiencies with cost-to-income ratio improving from 23.4% to 20.5%, which is considered the best in the Qatari banking sector. QIBK was able to contain the ratio of non-performing financing assets to total financing assets at 1.3%; reflecting the quality of the bank’s financing assets portfolio. QIBK continues to pursue the conservative
- 3. Page 3 of 8 impairment provisioning policy and has more than doubled the financing impairment charges to QR960.6mn in January- September 2020 and continues to maintain 100% coverage ratio for non-performing financing assets. Total capital adequacy of the bank under Basel III guidelines is 18.3% as of September 2020, higher than the minimum regulatory requirements stipulated by the Qatar Central Bank and the Basel Committee. (QNB FS Research, QSE, Gulf-Times.com) MARK's bottom line rises 0.6% YoY and 7.9% QoQ in 3Q2020, above our estimate – Masraf Al Rayan's (MARK) net profit rose 0.6% YoY (+7.9% QoQ) to QR578.8mn in 3Q2020, above our estimate of QR544.3mn (variation of +6.3%). ‘Total net income from financing and investing activities’ decreased 3.6% YoY and 0.3% QoQ in 3Q2020 to QR1,139.7mn. The company's Total Income came in at QR1,245.5mn in 3Q2020, which represents a decrease of 7.6% YoY (-0.1% QoQ). The bank's total assets stood at QR116.5bn at the end of September 30, 2020, up 10.9% YoY (+6.6% QoQ). Financing Assets were QR80.8bn, registering a rise of 6.9% YoY (+3.4% QoQ) at the end of September 30, 2020. Customer Current Accounts rose 22.9% YoY and 5.8% QoQ to reach QR8.9bn at the end of September 30, 2020. EPS remained flat YoY at QR0.077 in 3Q2020 (2Q2020: QR0.072). In 9M2020, MARK reported net profit of QR1.662bn, an increase of 0.53% compared to the same period last year. Highlighting the financial indicators, Masraf Al Rayan Group’s CEO, Adel Mustafawi said that return on average assets continues to be one of the highest in the market at 2%. While return on average shareholders’ equity is 15.94%, earnings per share reached QR0.222. Book value per share reached QR1.85 compared to QR1.79 as of September 30, 2019. Capital adequacy ratio, using Basel-III standards and QCB regulations, reached 19.52% as of September 30, 2020. Operational efficiency ratio (the cost to income ratio) stood at 21.74% and continued as one of the best in the region, he said adding non-performing financing ratio of 1.08% is the lowest in the banking sector reflecting strong and prudent credit and risk management policies and procedures. Commenting on the financial result, MARK’s Chairman and Managing Director, HE Ali bin Ahmed Al Kuwari said, “Achieving this result is notable, particularly in light of adverse conditions from the global spread of the COVID-19 pandemic that reflected negatively on financial markets, in addition to the sharp plunge in energy prices.” Kuwari noted that measures taken by Qatar and the support plans it proposed, in particular the extension of the National Insurance Program, helped the private sectors to overcome these difficult circumstances. Mustafawi noted that the potential merger discussions of Masraf Al Rayan and Al Khalij Commercial Bank are ongoing as scheduled. He also added that both the banks are committed to informing the public and investors about any progress in this regard. (QNB FS Research, QSE, Peninsula Qatar, Qatar Tribune) QFLS posts 51.0% YoY decrease but 259.7% QoQ increase in net profit in 3Q2020, above our estimate – Qatar Fuel Company's (QFLS, WOQOD) net profit declined 51.0% YoY (but rose 259.7% on QoQ basis) to QR158.6mn in 3Q2020, above our estimate of QR95.9mn (variation of +65.3%). In 9M2020, QFLS’ net profit stood at QR428.73mn as compare to QR871.80mn in 9M2019. EPS amounted to QR0.43 in 9M2020 as compared to QR0.88 in 9M2019. WOQOD’s Managing Director & CEO, Saad Rashid Al-Muhannadi explained that WOQOD Group’s net profits and overall sales volumes witnessed a considerable increase in 3Q2020 over the second quarter of this year. Al- Muhannadi also explained that WOQOD Group’s QR429mn net profit in 3Q2020 (excluding minority rights) witnessed a 51% decrease rate, or QR443mn over the QR872mn achieved in the same period last year. The decrease in net profits and earnings per share for the period were partly attributed to the market slowdown prompted by the COVID-19 outbreak. Al-Muhannadi said the company’s overall sales of petroleum products decreased by 23% compared to the same period of last year driven by the negative impact of the COVID-19 pandemic. Diesel, super gasoline, and premium gasoline sales decreased by 11%, 14%, and 9%, respectively, while jet fuel volumes decreased by 34% driven by the reduced operations of airlines due to the suspension of air traffic in most countries globally. Bitumen sales have decreased by 64% driven by macro- economic factors, COVID-19 pandemic, and the completion of the major projects. LPG sales decreased by 3% compared to the same period of 2019. Refined petroleum products retail sales from petrol stations decreased by 3% compared to the same period of last year driven by micro-economic factors, as well as the negative impact of COVID-19. On the other hand, he explained that bunkering fuel ‘HFO’ increased by 18%, natural gas sales increased by 9% compared to the same period in 2019, and retail non-fuel revenue, including Sidra sales, increased by 11% as compared to the same period of the last year driven by the opening of new stations. In the field of the petrol stations project, Al-Muhannadi said petrol stations operated by WOQOD as of October 15, 2020, reached a total of 106 stations. The company intends to add five more stations by the end of 2020, he said. “Despite the impact and challenges of the coronavirus, WOQOD, being the sole downstream oil and gas company responsible for securing a continuous and sustainable supply of petroleum products and gas to all sectors within the State of Qatar, was left with no choice but to implement a flexible and effective business plan to ensure the continuity of the supply activities throughout the country on a regular basis and in line with the health safety, security, and environmental sanitation procedures and standards for the time being in force in the petroleum products industry, where the group is persistently communicating and co-coordinating with entities of competent jurisdiction to implement the best standards and measures issued in this regard,” he said. (QNB FS Research, QSE, Gulf- Times.com) ERES' net profit declines 59.1% YoY and 33.4% QoQ in 3Q2020 – Ezdan Holding Group's (ERES) net profit declined 59.1% YoY (- 33.4% QoQ) to QR36.2mn in 3Q2020.The company's Rental Income came in at QR288.68mn in 3Q2020, which represents a decrease of 7.5% YoY (2Q2020: QR288.76mn). In 9M2020, ERES posted net profit of QR208.6mn as compared to QR509.2mn in 9M2019. EPS amounted to QR0.008 in 9M2020 as compared to QR0.019 in 9M2019. The group generated operating revenues of QR1.078bn during the first nine months of the year compared to QR1.264bn in the same period a year earlier. The decrease was mainly driven from a drop in revenues and operating profit of the hotels sector and the malls sector. (QSE, Peninsula Qatar, Gulf-times.com)
- 4. Page 4 of 8 Qatari second-quarter GDP drops to lowest since 2012 on pandemic – Qatar’s economy performed its worst since at least 2012 during the second quarter amid lockdown measures to combat the coronavirus. The gas-rich nation’s GDP fell 6.1% in the April-to-June period on an annual basis, according to estimates by the Planning and Statistics Authority. The economy contracted 1% in the same period of 2019. Transportation, warehousing, retail trade, accommodation, and leisure services in the world’s biggest shipper of liquefied natural gas were especially hit by the COVID-19 pandemic. The International Monetary Fund projects Qatar’s GDP to fall 4.5% this year, the smallest contraction among Arab Gulf states. (Bloomberg) IQCD to disclose 3Q2020 financial statements on October 27 and to hold conference call on November 02 – Industries Qatar (IQCD) intends to disclose the 3Q2020 financial statements for the period ending September 30, 2020, on October 27, 2020. The company will hold its investor relations conference call to discuss the financial results for 3Q2020 on November 02, 2020 at 1:30pm, Doha Time. (QSE) CBQK to disclose 3Q2020 financial statements on October 25 and to hold conference call on October 26 – The Commercial Bank (CBQK) intends to disclose the 3Q2020 financial statements for the period ending September 30, 2020, on October 25, 2020. The company will hold its investor relations conference call to discuss the financial results for 3Q2020 on October 26, 2020 at 1:00pm, Doha Time. (QSE) GISS to disclose 3Q2020 financial statements on October 29 and to hold conference call on November 04 – Gulf International Services (GISS) intends to disclose the 3Q2020 financial statements for the period ending September 30, 2020, on October 29, 2020. The company will hold its investor relations conference call to discuss the financial results for 3Q2020 on November 04, 2020 at 1:30pm, Doha Time. (QSE) KCBK to disclose 3Q2020 financial statements on October 22 – Al Khalij Commercial Bank (KCBK) intends to disclose the 3Q2020 financial statements for the period ending September 30, 2020, on October 22, 2020. Furthermore, a conference call with the Investors to discuss the financial results for 3Q2020 will be held on October 26, 2020 at 2:00pm Doha Time. (QSE) MARK to hold conference call on October 15 – Masraf Al-Rayan (MARK) will hold its investor relations conference call to discuss the financial results for 3Q2020 on October 15, 2020 at 11:30am, Doha Time. (QSE) WDAM to disclose 3Q2020 financial statements on October 21 – Widam Food Company (WDAM) intends to disclose the 3Q2020 financial statements for the period ending September 30, 2020, on October 21, 2020. (QSE) QOIS to disclose 3Q2020 financial statements on October 28 – Qatar Oman Investment Company (QOIS) intends to disclose the 3Q2020 financial statements for the period ending September 30, 2020, on October 28, 2020. (QSE) QIMD to disclose 3Q2020 financial statements on October 27 – Qatar Industrial Manufacturing Company (QIMD) intends to disclose the 3Q2020 financial statements for the period ending September 30, 2020, on October 27, 2020. (QSE) VFQS to disclose 3Q2020 financial statements on October 26 – Vodafone Qatar (VFQS) intends to disclose the 3Q2020 financial statements for the period ending September 30, 2020, on October 26, 2020. (Peninsula Qatar)
- 5. Page 5 of 8 Qatar Stock Exchange Top Gainers Top Decliners Source: Qatar Stock Exchange (QSE) Source: Qatar Stock Exchange (QSE) Most Active Shares by Value (QR Million) Most Active Shares by Volume (Million) Source: Qatar Stock Exchange (QSE) Source: Qatar Stock Exchange (QSE) Investor Trading Percentage to Total Value Traded Net Traded Value by Nationality (QR Million) Source: Qatar Stock Exchange (QSE) Source: Qatar Stock Exchange (QSE) 9.9% 8.3% 5.8% 5.7% 3.3% 0.0% 4.0% 8.0% 12.0% Qatar Cinema & Film Distribution Company Qatar General Insurance & Reinsurance Company Ahli Bank Ezdan Holding Group Qatar Aluminium Manufacturing Company -4.5% -4.5% -4.0% -3.8% -3.5% -6.0% -4.0% -2.0% 0.0% Qatari German Company for Medical Devices Mazaya Qatar Real Estate Development Qatar First Bank Qatar Oman Investment Company Investment Holding Group 274.7 201.5 187.7 159.8 148.9 0.0 100.0 200.0 300.0 Ezdan Holding Group QNB Group Qatar Aluminium Manufacturing Company Salam International Investment Limited Investment Holding Group 225.3 222.8 173.5 125.7 50.5 0.0 85.0 170.0 255.0 Investment Holding Group Salam International Investment Limited Qatar Aluminium Manufacturing Company Ezdan Holding Group Mazaya Qatar Real Estate Development 0% 20% 40% 60% 80% 100% Buy Sell 48.29% 52.44% 19.68% 17.32% 15.77% 16.02% 16.26% 14.22% Qatari Individuals Qatari Institutions Non-Qatari Individuals Non-Qatari Institutions 1,494 704 1,533 664 -39 39 -500 0 500 1,000 1,500 2,000 Qatari Non-Qatari Net Investment Total Sold Total Bought
- 6. Page 6 of 8 TECHNICAL ANALYSIS OF THE QSE INDEX Source: Bloomberg The QE Index lost only 0.33% over the week and closed at 9,999.46. No significant move seen over the week, thus the Index remains around the psychological level the 10,000 points we have mentioned in the previous weeks. The Index remains inside the rising-wedge formation and the trend remains up, but the traded volume of the Index constituents has declined. We remain cautious around the current levels and we keep our resistance at the 10,300 points; our support remains at the 9,500 level. DEFINITIONS OF KEY TERMS USED IN TECHNICAL ANALYSIS RSI (Relative Strength Index) indicator – RSI is a momentum oscillator that measures the speedand change of price movements. The RSI oscillates between 0 to 100. The index is deemed to be overbought once the RSI approaches the 70 level, indicating that a correction is likely. On the other hand, if the RSI approaches 30, it is an indication that the index may be getting oversold and therefore likely to bounce back. MACD (Moving Average Convergence Divergence) indicator – The indicator consists of the MACD line and a signal line. The divergence or the convergence of the MACD line with the signal line indicates the strength in the momentum during the uptrend or downtrend, as the case may be. When the MACD crosses the signal line from below and trades above it, it gives a positive indication. The reverse is the situation for a bearish trend. Candlestick chart – A candlestick chart is a price chart that displays the high, low, open, and close for a security. The ‘body’ of the chart is portion between the open and close price, while the high and low intraday movements form the ‘shadow’. The candlestick may represent any time frame. We use a one-day candlestick chart (every candlestick represents one trading day) in our analysis. Doji candlestick pattern – A Doji candlestick is formed when a security's open and close are practically equal. The pattern indicates indecisiveness, and based on preceding price actions and future confirmation, may indicate a bullish or bearish trend reversal. ShootingStar/Inverted Hammer candlestick patterns – These candlestick patterns have a small real body (open price and close price are near to each other), and a long upper shadow (large intraday movement on the upside). The Shooting Star is a bearish reversal pattern that forms after a rally. The Inverted Hammer looks exactly like a Shooting Star, but forms after a downtrend. Inverted Hammers represent a potential bullish trend reversal.
- 7. Page 7 of 8 Source: Bloomberg Company Name Price October 15 % Change WTD % Change YTD Market Cap. QR Million TTM P/E P/B Div. Yield Qatar National Bank 17.90 (1.49) (13.06) 165,332 15.1 2.3 3.4 Qatar Islamic Bank 16.47 (1.08) 7.44 38,917 13.7 2.2 3.2 Commercial Bank of Qatar 4.15 1.29 (11.70) 16,796 9.5 0.9 4.8 Doha Bank 2.43 2.97 (3.95) 7,534 14.4 0.8 N/A Al Ahli Bank 3.39 5.78 1.58 8,227 13.5 1.4 4.2 Qatar International Islamic Bank 8.34 (0.71) (13.84) 12,624 14.3 2.2 5.1 Masraf Al Rayan 4.18 (0.55) 5.43 31,313 14.3 2.3 5.4 Al Khaliji Bank 1.59 (0.38) 21.60 5,735 9.6 1.0 4.7 Qatar First Bank 1.81 (4.03) 121.52 1,268 N/A 2.6 N/A National Leasing 1.27 (3.41) 80.71 630 23.5 0.9 3.9 Dlala Holding 2.16 1.41 253.52 614 N/A 3.1 N/A Qatar & Oman Investment 0.86 (3.79) 29.00 272 32.8 0.9 2.3 Islamic Holding Group 4.42 (0.18) 132.63 250 81.7 1.8 N/A Banking and Financial Services 289,513 Zad Holding 15.00 (1.64) 8.54 3,555 17.5 2.5 5.7 Qatar German Co. for Medical Devices 2.16 (4.52) 270.27 249 N/A 8.4 N/A Salam International Investment 0.69 0.58 34.24 793 N/A 0.5 N/A Baladna 2.18 (0.59) 117.90 4,142 N/A 1.9 1.0 Medicare Group 8.95 1.82 5.92 2,519 34.7 2.6 20.1 Qatar Cinema & Film Distribution 4.19 9.88 90.50 263 57.4 2.0 2.4 Qatar Fuel 17.70 0.34 (22.71) 17,598 22.7 2.3 4.5 Qatar Meat and Livestock 7.08 (2.29) 4.70 1,274 14.9 3.6 4.2 Mannai Corp. 3.09 (1.56) 0.32 1,410 N/A 0.7 6.5 Al Meera Consumer Goods 19.96 (0.20) 30.46 3,992 20.1 2.9 4.3 Consumer Goods and Services 35,796 Qatar Industrial Manufacturing 3.34 (1.47) (6.44) 1,587 17.0 1.0 4.5 Qatar National Cement 3.91 (0.41) (30.81) 2,555 18.5 0.9 7.7 Industries Qatar 9.84 (1.01) (4.28) 59,532 37.7 1.8 4.1 Qatari Investors Group 1.93 (0.87) 7.82 2,400 23.8 0.9 2.8 Qatar Electricity and Water 16.88 (0.94) 4.91 18,568 12.8 2.2 4.6 Aamal 0.96 (1.44) 18.08 6,048 37.8 0.8 4.2 Gulf International Services 1.62 0.06 (5.58) 3,018 43.7 0.8 N/A Mesaieed Petrochemical Holding 2.10 (0.90) (16.53) 26,320 25.6 1.7 3.3 Invesment Holding Group 0.63 (3.51) 12.06 525 12.2 0.6 N/A Qatar Aluminum Manufacturing 1.07 3.27 37.52 5,993 N/A 1.0 0.9 Industrials 126,545 Qatar Insurance 2.26 3.10 (28.39) 7,391 N/A 1.0 6.6 Doha Insurance 1.15 (2.46) (4.25) 575 13.1 0.6 7.0 Qatar General Insurance & Reinsurance 2.40 8.32 (2.64) 2,096 N/A 0.4 N/A Al Khaleej Takaful Insurance 2.00 (0.94) 0.00 511 15.8 1.0 2.5 Qatar Islamic Insurance 6.30 0.33 (5.66) 945 13.9 2.6 6.0 Insurance 11,517 United Development 1.81 (0.99) 18.88 6,398 28.4 0.6 2.8 Barw a Real Estate 3.45 (0.09) (2.54) 13,425 8.4 0.7 5.8 Ezdan Real Estate 2.22 5.71 260.98 58,885 N/A 1.8 N/A Mazaya Qatar Real Estate Development 1.20 (4.48) 66.20 1,383 54.0 0.1 N/A Real Estate 80,092 Ooredoo 6.78 0.09 (4.24) 21,718 13.0 1.0 3.7 Vodafone Qatar 1.34 (0.15) 15.26 5,651 38.9 1.3 3.7 Telecoms 27,369 Qatar Navigation (Milaha) 5.95 (0.34) (2.48) 6,813 12.7 0.5 5.0 Gulf Warehousing 5.18 (1.50) (5.46) 304 12.8 1.7 3.9 Qatar Gas Transport (Nakilat) 2.70 0.07 12.76 14,931 13.9 2.5 3.7 Transportation 22,048 Qatar Exchange 595,612
- 8. Contacts Saugata Sarkar, CFA, CAIA Shahan Keushgerian Zaid al-Nafoosi , CMT, CFTe Head of Research Senior Research Analyst Senior Research Analyst Tel: (+974) 4476 6534 Tel: (+974) 4476 6509 Tel: (+974) 4476 6535 saugata.sarkar@qnbfs.com.qa shahan.keushgerian@qnbfs.com.qa zaid.alnafoosi@qnbfs.com.qa Mehmet Aksoy, PhD QNB Financial Services Co. W.L.L. Senior Research Analyst Contact Center: (+974) 4476 6666 Tel: (+974) 4476 6589 PO Box 24025 mehmet.aksoy@qnbfs.com.qa Doha, Qatar Disclaimer and Copyright Notice: This publication has been prepared by QNB Financial Services Co. W.L.L. (“QNB FS”) a wholly-owned subsidiary of Qatar National Bank (Q.P.S.C.). QNB FS is regulated by the Qatar Financial Markets Authority and the Qatar Exchange. Qatar National Bank (Q.P.S.C.) is regulated by the Qatar Central Bank. This publication expresses the views and opinions of QNB FS at a given time only. It is not an offer, promotion or recommendation to buy or sell securities or other investments, nor is it intended to constitute legal, tax, accounting, or financial advice. QNB FS accepts no liability whatsoever for any direct or indirect losses arising from use of this report. Any investment decision should depend on the individual circumstances of the investor and be based on specifically engaged investment advice. We therefore strongly advise potential investors to seek independent professional advice before making any investment decision. Although the information in this report has been obtained from sources that QNB FS believes to be reliable, we have not independently verified such information and it may not be accurate or complete. QNB FS does not make any representations or warranties as to the accuracy and completeness of the information it may contain, and declines any liability in that respect. For reports dealing with Technical Analysis, expressed opinions and/or recommendations may be different or contrary to the opinions/recommendations of QNB FS Fundamental Research as a result of depending solely on the historical technical data (price and volume). QNB FS reserves the right to amend the views and opinions expressed in this publication at any time. It may also express viewpoints or make investment decisions that differ significantly from, or even contradict, the views and opinions included in this report. This report may not be reproduced in whole or in part without permission from QNB FS COPYRIGHT: No part of this document may be reproduced without the explicit written permission of QNB FS. Page 8 of 8