QNBFS Weekly Market Report August 10, 2017
•
0 likes•792 views

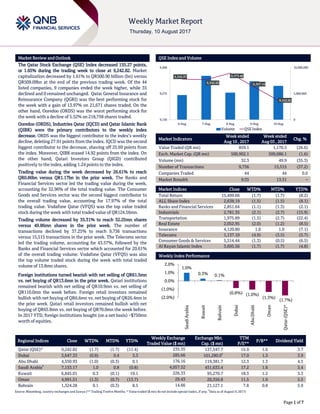
The Qatar Stock Exchange (QSE) Index decreased 155.27 points, or 1.65% during the trading week to close at 9,242.82.

Recommended
More Related Content
What's hot
What's hot (20)
Similar to QNBFS Weekly Market Report August 10, 2017
Similar to QNBFS Weekly Market Report August 10, 2017 (20)
More from QNB Group
More from QNB Group (20)
Recently uploaded
Recently uploaded (20)
QNBFS Weekly Market Report August 10, 2017
- 1. ` Page 1 of 7 Market Review and Outlook QSE Index and Volume The Qatar Stock Exchange (QSE) Index decreased 155.27 points, or 1.65% during the trading week to close at 9,242.82. Market capitalization decreased by 1.61% to QR500.90 billion (bn) versus QR509.09bn at the end of the previous trading week. Of the 44 listed companies, 9 companies ended the week higher, while 35 declined and 0 remained unchanged. Qatar General Insurance and Reinsurance Company (QGRI) was the best performing stock for the week with a gain of 13.97% on 21,671 shares traded. On the other hand, Ooredoo (ORDS) was the worst performing stock for the week with a decline of 5.52% on 218,758 shares traded. Ooredoo (ORDS), Industries Qatar (IQCD) and Qatar Islamic Bank (QIBK) were the primary contributors to the weekly index decrease. ORDS was the biggest contributor to the index’s weekly decline, deleting 27.91 points from the index. IQCD was the second biggest contributor to the decrease, shaving off 25.69 points from the index. Moreover, QIBK erased 14.92 points from the index. On the other hand, Qatari Investors Group (QIGD) contributed positively to the index, adding 1.24 points to the index. Trading value during the week decreased by 26.61% to reach QR0.86bn versus QR1.17bn in the prior week. The Banks and Financial Services sector led the trading value during the week, accounting for 32.96% of the total trading value. The Consumer Goods and Services sector was the second biggest contributor to the overall trading value, accounting for 17.97% of the total trading value. Vodafone Qatar (VFQS) was the top value traded stock during the week with total traded value of QR124.56mn. Trading volume decreased by 35.31% to reach 32.25mn shares versus 49.86mn shares in the prior week. The number of transactions declined by 37.25% to reach 9,736 transactions versus 15,515 transactions in the prior week. The Telecoms sector led the trading volume, accounting for 43.57%, followed by the Banks and Financial Services sector which accounted for 20.61% of the overall trading volume. Vodafone Qatar (VFQS) was also the top volume traded stock during the week with total traded volume of 13.8mn shares. Foreign institutions turned bearish with net selling of QR61.5mn vs. net buying of QR13.6mn in the prior week. Qatari institutions remained bearish with net selling of QR10.9mn vs. net selling of QR110.0mn the week before. Foreign retail investors remained bullish with net buying of QR6.6mn vs. net buying of QR26.4mn in the prior week. Qatari retail investors remained bullish with net buying of QR65.8mn vs. net buying of QR70.0mn the week before. In 2017 YTD, foreign institutions bought (on a net basis) ~$750mn worth of equities. Market Indicators Week ended Aug 10 , 2017 Week ended Aug 03 , 2017 Chg. % Value Traded (QR mn) 859.1 1,170.5 (26.6) Exch. Market Cap. (QR mn) 500,902.1 509,086.1 (1.6) Volume (mn) 32.3 49.9 (35.3) Number of Transactions 9,736 15,515 (37.2) Companies Traded 44 44 0.0 Market Breadth 9:35 13:31 – Market Indices Close WTD% MTD% YTD% Total Return 15,499.66 (1.7) (1.7) (8.2) ALL Share Index 2,638.19 (1.5) (1.5) (8.1) Banks and Financial Services 2,851.64 (1.1) (1.3) (2.1) Industrials 2,781.35 (2.1) (2.7) (15.9) Transportation 1,975.89 (1.5) (2.7) (22.4) Real Estate 2,052.95 (2.0) (1.2) (8.5) Insurance 4,120.80 1.0 1.0 (7.1) Telecoms 1,137.10 (4.9) (3.5) (5.7) Consumer Goods & Services 5,514.44 (1.3) (0.5) (6.5) Al Rayan Islamic Index 3,695.56 (1.7) (1.7) (4.8) Market Indices Weekly Index Performance Regional Indices Close WTD% MTD% YTD% Weekly Exchange Traded Value ($ mn) Exchange Mkt. Cap. ($ mn) TTM P/E** P/B** Dividend Yield Qatar (QSE)* 9,242.82 (1.7) (1.7) (11.4) 235.35 137,547.7 15.9 1.6 3.7 Dubai 3,647.33 (0.8) 0.4 3.3 285.66 101,280.0# 17.0 1.3 3.9 Abu Dhabi 4,550.93 (1.0) (0.3) 0.1 176.16 119,381.7 12.3 1.3 4.5 Saudi Arabia# 7,153.17 1.0 0.8 (0.8) 4,057.52 451,633.4 17.2 1.6 3.4 Kuwait 6,845.01 0.3 (0.1) 19.1 226.33 95,270.7 18.3 1.2 5.3 Oman 4,991.51 (1.3) (0.7) (13.7) 29.43 20,356.8 11.5 1.0 5.5 Bahrain 1,324.28 0.1 (0.3) 8.5 14.66 21,127.1 7.8 0.8 5.9 Source: Bloomberg, country exchanges and Zawya (** Trailing Twelve Months; * Value traded ($ mn) do not include special trades, if any; # Data as of August 9, 2017) 9,345.37 9,342.56 9,373.49 9,307.14 9,242.82 0 5,000,000 10,000,000 9,150 9,275 9,400 6-Aug 7-Aug 8-Aug 9-Aug 10-Aug Volume QSE Index 1.0% 0.3% 0.1% (0.8%) (1.0%) (1.3%) (1.7%) (2.0%) (1.0%) 0.0% 1.0% 2.0% SaudiArabia Kuwait Bahrain Dubai AbuDhabi Oman Qatar(QSE)*
- 2. Page 2 of 7 News Economic & Corporate News MCCS’ net profit narrows to QR76.4mn in 2Q2017 – Mannai Corp. (MCCS) reported net profit of QR76.4mn in 2Q2017 as compared to QR90.1mn in 1Q2017. In 1H2017, the company’s net profit declined to QR166.5mn (from QR219.6mn in 1H2016), whereas revenue fell 7% YoY to QR2.31bn. MCCS said that depressed market conditions in the retail/luxury segment and the general economic slowdown resulted in the net profit decline. Further, the company stated that in continuation of the group’s strategy of diversifying its earnings, the group is further consolidating its stake in GFI Informatique with an increase in its shareholding to 80% during 2017. With this acquisition and other operational efficiencies underway, the group is confident of improving its performance during the remainder of the year. MCCS’ EPS amounted to QR3.65 in 1H2017 as compared to QR4.81 in 1H2016. (QSE, Gulf-Times.com) MERS' bottom line rises 52.6% QoQ in 2Q2017 – Al Meera Consumer Goods Company's (MERS) net profit rose 52.6% QoQ (+16.8% YoY) to QR61.8mn in 2Q2017. EPS remained flat YoY at QR5.12 in 1H2017. (QSE) S&P: Siege nations’ trade balance to be hit – S&P Global Ratings said, “The physical closure of Qatar’s land, air, and sea borders with the blockading nations will affect trade linkages in both directions. We therefore expect the boycott to adversely affect the trade balances of boycotting countries that previously had trade surpluses with Qatar, particularly Saudi Arabia.” However, the countries not participating in the siege, such as Oman and Kuwait, may benefit from diverted trade routes. In 2016, goods exports from Qatar to the GCC and Egypt accounted for 11% of Qatar’s total exports, or roughly 6% of current account receipts ($6bn). (Peninsula Qatar) Qatar lauded for stable supply of LNG to Japan – Chubu Electric Power honorary adviser Toshio Mita lauded Qatar’s stable supply of liquefied natural gas (LNG) to Japan, saying Qatar- Japan relations will never change despite the economic blockade. Speaking in a meeting at the headquarters of the Abdullah Bin Hamad Al-Attiyah International Foundation for Energy and Sustainable Development, he said Japan and Qatar will continue to strengthen its economic and trade relationships amid current circumstances. (Gulf-Times.com) IQCD's net profit declines 26.5% QoQ in 2Q2017; in-line with our estimate – Industries Qatar's (IQCD) net profit declined 26.5% QoQ to QR681.9mn in 2Q2017 as compared to QR927.9mn in 1Q2017, in-line with our estimate of QR788.8mn (variation of -13.5%). The company's revenue reported under IFRS 11 came in at QR917.3mn in 2Q2017, which represents a decrease of 17.2% QoQ. In 1H2017, net profit declined to QR1,610mn in 2Q2017 (a decline of 19.1% YoY). The reduction in 1H2017 net profit was predominantly driven by lower revenue, resulting from slight decrease in sales volumes across most operating segments. However, the company said that operational performance, together with operating costs, is expected to improve further with the on-going cost optimization programs. IQCD’s revenue reported under IFRS 11 came in at QR2,025mn in 1H2017 as compared to QR2,431mn in 1H2016, a decline of 16.7% YoY. The decrease in group revenue was primarily due to modest reduction in sales volumes, driven by decrease in production of polyethylene and fertilizers. The impact of reduced volumes was partially negated by improved product prices, most notably the prices of petrochemicals. The performance in some segments, in particular the operational performance of polyethylene and fertilizer segments was affected due to some planned and unplanned maintenance during 1H2017. IQCD stated that prices, most specifically the prices of polyethylene and fuel additives, have improved on last year as prices troughed during 1H2016 in the backdrop of depressed crude oil prices, which prevailed in early-2016. On the other hand, prices of fertilizer remained relatively stable, while the prices of steel were marginally down last year. IQCD’s EPS amounted to QR2.66 in 1H2017 as compared to QR3.29 in 1H2016. The company’s financial position remains solid as cash across the group stands at QR10.2bn after paying 2016’s dividend of QR2.4bn and periodic debt payments. Overall results are not particularly surprising given market conditions but we expect the stock to react negatively to the earnings miss. We retain our Market Perform rating on the stock. (QNBFS Research, company financials) MDPS: Monthly PPI for Qatar’s industrial sector fell 3.7% in June – According to the Ministry of Development Planning and Statistics (MDPS), the monthly Producer Price Index (PPI) for June for Qatar’s industrial sector fell 3.7% compared to May. The monthly Producer Price Index (PPI) of the Industrial sector has been prepared with the base year taken as 2013, MDPS said. PPI covers goods relating to mining (weight: 72.7%), manufacturing (26.8%), and electricity and water (0.5%). MDPS said the fall in June PPI was primarily due to the decrease in the prices of crude petroleum and natural gas. However, PPI has shown an increase of 14.8% YoY in June. (Gulf-Times.com) Muntajat to export Qatar’s petrochemical products through Hamad Port – State-owned Muntajat will export Qatar’s petrochemical products through Hamad Port for which an agreement was signed by Qatar Ports Management Company (Mwani Qatar) and Qatar Chemical and Petrochemical Marketing and Distribution Company in Doha. As per the MoU, Muntajat will export through Hamad Port a number of its shipments to various destinations around the world while Mwani Qatar will be in charge of providing container loading and unloading services at Hamad Port berths as well as facilitating and developing support services for containers and trucks. The agreement was signed in the presence of HE the Minister of Transport and Communications, Jassim Seif Ahmed Al-Sulaiti, also Mwani Chairman at the Ministry of Transport and Communications in Qatar. (Gulf-Times.com) The First Investor completes acquisition of income yielding asset in Germany – The First Investor (TFI), a subsidiary of Barwa Bank Group and a Qatari closed shareholding investment banking firm, has recently announced the completion of the acquisition of a prime Stuttgart office property via its TFI Europe Income Fund. Located in Stuttgart and leased to one of the leading German automotive groups, the investment is in line with TFI’s strategy to identify
- 3. Page 3 of 7 attractive opportunities in developed markets like Germany and the UK, where it has already made considerable investments. The fund, a close ended Shari’ah-compliant real estate fund, was recently established by TFI and Inovalis with the focus on investing in the income generating commercial real estate assets in highly-lucrative European markets. (Gulf- Times.com) Moody's lowers outlook on Qatar Banking System to ‘Negative’ – Moody’s Investors Service lowered the outlook on Qatar’s banking system to ‘Negative’ from ‘Stable’ due to weakening operating conditions and continued funding pressures facing Qatari banks. (Bloomberg) Milaha launches in-country operations in Oman – Qatar-based maritime and logistics conglomerate Milaha has launched in- country operations in Oman. Initially, Milaha is setting up warehousing and third party logistics (3PL) services within the Sohar Free Zone, while it continues to explore further expansion in Oman of its diverse portfolio of services. The announcement comes on top of the company also shifting its regional transshipment hub to the Port of Sohar, where Milaha is offering competitive transit time for local cargo and a high frequency of Oman to Qatar sailings. (Gulf-Times.com) MPHC reports ~QR256mn net profit in 2Q2017 – Mesaieed Petrochemical Holding Company (MPHC) reported net profit (including tax refund) of ~QR256mn in 2Q2017 as compared to QR212.3mn in 1Q2017. EPS amounted to QR0.37 in 1H2017 as compared to QR0.39 in 1H2016. In 1H2017, net profit (including tax refund) declined to QR468.6mn from QR489.7mn in 1H2016, as reduced sales volumes on periodic turnaround in some of the group companies’ plants were offset by the increase in selling prices. However, the company noted that the financial performance significantly exceeded the group’s budget expectations. The group continued to benefit from the supply of competitively priced ethane feedstock and fuel gas under long-term supply agreements. The group’s 1H2017 profit was also aided by recognition of a tax refund of ~QR42.8mn for the period. The closing cash position after the first six months of operations and after distribution of previous years’ dividends of QR716.5mn was a robust QR876.3mn as on June 30, 2017. (QSE, Gulf-Times.com) QSE sets the listing of Investment Holding Group on August 14, 2017 – Qatar Stock Exchange (QSE) announced that the listing of the Investment Holding Group company will be on August 14, 2017. The decision to list Investment Holding Group on QSE resulted after the company has fulfilled and complied with all necessary listing requirements. Investment Holding Group has a share capital of QR830,000,000 divided into 83,000,000 for a nominal value of QR10. (QSE) QNB Group receives approval to provide UK Home Finance services to individuals – QNB Group, the largest financial institution in the Middle East and Africa, has announced that its London branch received the approvals of the Prudential Regulation Authority and the Financial Conduct Authority for its regulated Home Finance license designed to assist affluent individual customers with buying property in the UK. (Peninsula Qatar) QIBK launches second series of Certificate of Deposit – Qatar Islamic Bank (QIBK) has announced the launch of its second series of Certificates of Deposit. The new Certificates of Deposit will be available for individuals and corporate customers in Qatari riyal and US dollar for different tenors of one and two years. Certificates of Deposit are developed to encourage customers to make long-term saving and get attractive annual profit based on the certificate’s maturity and selected currency. Annual profit of QIBK’s Certificates of Deposit in Qatari riyal is expected to be 3.25% for one year, and 3.75% for two years. As for the Certificates of Deposit in US dollars, the expected annual profit is 2.50% for one year and 2.75% for two years. The minimum subscription in the Certificate of Deposit is QR100,000 or $25,000 with no maximum limit. (Gulf-Times.com) MCGS’ net profit declines 17.7% QoQ in 2Q2017 – Medicare Group's (MCGS) net profit declined 17.7% QoQ to QR14.7mn in 2Q2017 as compared to QR17.9mn in 1Q2017. On YoY basis, net profit declined 11.1% in 2Q2017. EPS amounted to QR1.16 in 1H2017 as compared to QR1.09 in 1H2016. (QSE) MDPS: Qatar's first quarter GDP jumps 14.5% to QR151bn – According to Ministry of Development Planning and Statistics (MDPS) report, Qatar's first quarter GDP, at current prices, jumped 14.5% to QR150.94bn from QR131.79bn in the same period a year ago. The report said that the quarterly GDP in 1Q2017, at constant 2013 prices (QR197.7bn) shows a growth of 2.5% compared with 1Q2016 (QR192.97bn). However, the 1Q2017 GDP showed a decrease of 1.5% when compared with the revised estimate for 4Q2016, of QR200.69bn.The YoY GDP growth rate for 4Q2016 at constant 2013 prices remained at 1.7% after revision, it said. (Qatar Tribune) QNBK: Fall in inventories, stricter compliance to output cut behind oil recovery – QNBK said a fall in crude oil inventories and stricter compliance to the output cut deal by producers is behind the oil price recovery. Oil prices held up for most of the first half of 2017, averaging $54/bbl up to May following the agreement at the end of 2016 between OPEC and some major non-OPEC producers to restrict output. Prices then slumped to an average of $48/bbl during June and July, mainly due to concerns about rising production in the US as well as increasing supply from Nigeria and Libya who were exempt from the OPEC agreement. However, towards the end of July, oil prices rebounded, rising 13% from a low of $47/bbl earlier in the month to $53/bbl at the end of the month. (Gulf- Times.com) DHBK’s CEO: Qatar’s resilience to attract foreign participation in its diversification – Doha Bank’s (DHBK) CEO, R Seetharaman said that Qatar’s resilience will attract foreign participation in its diversification. According to Seetharaman, Qatar-Singapore trade data was close to $3.1bn. He said Singapore has emerged as a strategically-important hub for Qatar’s liquefied natural gas (LNG) exports. He noted that Keppel Group, a Singapore-based multi-national corporation, has a joint venture tie-up with Qatar Gas Transport Company. Qatar’s financial stability is evident and the economic progression is sustainable. Qatar’s economy is opening up on account of the current scenario, which will give enormous opportunities for Singapore companies to participate in Qatar’s development. (Gulf-Times.com)
- 4. Page 4 of 7 Qatar Stock Exchange Top Gainers Top Decliners Source: Qatar Stock Exchange (QSE) Source: Qatar Stock Exchange (QSE) Most Active Shares by Value (QR Million) Most Active Shares by Volume (Million) Source: Qatar Stock Exchange (QSE) Source: Qatar Stock Exchange (QSE) Investor Trading Percentage to Total Value Traded Net Traded Value by Nationality (QR Million) Source: Qatar Stock Exchange (QSE) Source: Qatar Stock Exchange (QSE) 14.0% 2.9% 2.4% 0.7% 0.6% 0.0% 6.0% 12.0% 18.0% Qatar General Insurance & Reinsurance Qatar Cinema & Film Distribution Widam Food Co. Zad Holding Qatari Investors Group -5.5% -4.6% -3.7% -3.6% -3.5% -6.0% -4.0% -2.0% 0.0% Ooredoo QatarNational Cement SalamInternational Investment IslamicHolding Group Al MeeraConsumer Goods 124.6 115.3 80.5 64.4 55.7 0.0 50.0 100.0 150.0 Vodafone Qatar QNB Group Widam Food Co. Industries Qatar Barwa Real Estate 13.8 2.0 1.7 1.6 1.3 0.0 5.0 10.0 15.0 Vodafone Qatar Mazaya Qatar Gulf International Services Barwa Real Estate United Development 0% 20% 40% 60% 80% 100% Buy Sell 60.46% 52.80% 19.27% 20.54% 9.01% 8.24% 11.26% 18.42% Qatari Individuals Qatari Institutions Non-Qatari Individuals Non-Qatari Institutions 685 174 630 229 55 (55) (200) - 200 400 600 800 Qatari Non-Qatari Net Investment Total Sold Total Bought
- 5. Page 5 of 7 TECHNICAL ANALYSIS OF THE QSE INDEX Source: Bloomberg The Index closed down by 1.65% from the week before and now at 9,242.82. Weakness was expected but the good news is that the weakness came with lower traded volumes, which is a good sign. Our first expected resistance is located around the 10,000 mark and the support levels around the 9,000 area. DEFINITIONS OF KEY TERMS USED IN TECHNICAL ANALYSIS RSI (Relative Strength Index) indicator – RSI is a momentum oscillator that measures the speed and change of price movements. The RSI oscillates between 0 to 100. The index is deemed to be overbought once the RSI approaches the 70 level, indicating that a correction is likely. On the other hand, if the RSI approaches 30, it is an indication that the index may be getting oversold and therefore likely to bounce back. MACD (Moving Average Convergence Divergence) indicator – The indicator consists of the MACD line and a signal line. The divergence or the convergence of the MACD line with the signal line indicates the strength in the momentum during the uptrend or downtrend, as the case may be. When the MACD crosses the signal line from below and trades above it, it gives a positive indication. The reverse is the situation for a bearish trend. Candlestick chart – A candlestick chart is a price chart that displays the high, low, open, and close for a security. The ‘body’ of the chart is portion between the open and close price, while the high and low intraday movements form the ‘shadow’. The candlestick may represent any time frame. We use a one-day candlestick chart (every candlestick represents one trading day) in our analysis. Doji candlestick pattern – A Doji candlestick is formed when a security's open and close are practically equal. The pattern indicates indecisiveness, and based on preceding price actions and future confirmation, may indicate a bullish or bearish trend reversal. Shooting Star/Inverted Hammer candlestick patterns – These candlestick patterns have a small real body (open price and close price are near to each other), and a long upper shadow (large intraday movement on the upside). The Shooting Star is a bearish reversal pattern that forms after a rally. The Inverted Hammer looks exactly like a Shooting Star, but forms after a downtrend. Inverted Hammers represent a potential bullish trend reversal.
- 6. Page 6 of 7 Source: Bloomberg Company Name Price August 10 % Change WTD % Change YTD Market Cap. QR Million TTM P/E P/B Div. Yield Qatar National Bank 136.50 (0.73) (7.83) 126,077 10.0 2.0 2.3 Qatar Islamic Bank 94.90 (2.37) (8.66) 22,424 10.8 1.6 5.0 Commercial Bank of Qatar 30.50 (3.17) (1.46) 12,344 291.8 0.7 N/A Doha Bank 31.50 (0.94) (6.53) 9,766 10.1 0.9 9.2 Al Ahli Bank 31.50 (0.79) (15.19) 6,311 9.9 1.3 3.0 Qatar International Islamic Bank 56.90 (1.04) (9.39) 8,613 10.7 1.6 7.0 Masraf Al Rayan 41.10 (0.36) 9.31 30,825 15.1 2.5 4.9 Al Khalij Commercial Bank 13.00 (0.76) (23.53) 4,680 11.0 0.7 5.8 Qatar First Bank 7.54 (0.66) (26.80) 1,508 N/A 0.9 N/A National Leasing 13.81 (2.06) (9.86) 683 N/A 0.7 3.6 Dlala Holding 18.05 (0.55) (16.01) 513 30.6 2.1 N/A Qatar & Oman Investment 8.51 (1.39) (14.47) 268 24.3 0.9 5.9 Islamic Holding Group 50.50 (3.63) (17.21) 286 74.0 2.1 2.0 Banking and Financial Services 224,299 Zad Holding 75.00 0.67 (15.92) 981 9.8 1.1 6.0 Qatar German Co. for Medical Devices 8.20 0.61 (18.81) 95 N/A 1.3 N/A Salam International Investment 9.00 (3.74) (18.55) 1,029 12.2 0.6 8.9 Medicare Group 81.20 (3.10) 29.09 2,285 34.0 2.4 2.2 Qatar Cinema & Film Distribution 27.00 2.86 (1.64) 170 64.4 1.3 3.7 Qatar Fuel 108.20 (1.19) (18.89) 10,758 13.2 1.6 5.9 Widam Food Co. 67.50 2.43 (0.74) 1,215 N/A 4.2 5.2 Mannai Corp. 76.90 (0.26) (3.88) 3,508 7.3 1.4 5.2 Al Meera Consumer Goods 152.90 (3.47) (12.88) 3,058 15.4 2.4 5.9 Consumer Goods and Services 23,098 Qatar Industrial Manufacturing 43.50 0.23 (2.25) 2,067 9.9 1.4 6.9 Qatar National Cement 70.50 (4.60) (9.83) 4,607 11.8 1.5 5.2 Industries Qatar 93.40 (2.71) (20.51) 56,507 21.8 1.7 4.3 Qatari Investors Group 47.70 0.63 (18.46) 5,930 21.9 2.3 2.1 Qatar Electricity and Water 193.80 (3.05) (14.63) 21,318 13.7 2.6 3.9 Aamal 11.00 (1.70) (19.30) 6,930 15.5 0.9 5.5 Gulf International Services 20.64 0.15 (33.63) 3,836 N/A 1.1 4.8 Mesaieed Petrochemical Holding 13.16 0.08 (16.71) 16,533 17.0 1.2 4.6 Industrials 117,729 Qatar Insurance 69.70 (0.43) (5.48) 19,328 20.0 2.0 1.9 Doha Insurance 14.02 (0.50) (22.97) 701 8.2 0.7 4.3 Qatar General Insurance & Reinsurance 33.85 13.97 (27.98) 2,962 17.1 0.5 4.4 Al Khaleej Takaful Insurance 16.50 (2.94) (21.80) 421 28.4 0.8 3.6 Qatar Islamic Insurance 58.00 (1.69) 14.62 870 13.6 2.7 6.0 Insurance 24,283 United Development 16.74 (1.53) (18.93) 5,927 10.3 0.6 7.5 Barw a Real Estate 33.80 (1.46) 1.65 13,152 10.0 0.7 7.4 Ezdan Real Estate 12.79 (2.29) (15.35) 33,925 16.5 1.1 3.9 Mazaya Qatar Real Estate Development 10.87 (3.21) (20.68) 1,258 23.7 0.9 N/A Real Estate 54,264 Ooredoo 92.50 (5.52) (9.14) 29,630 16.2 1.3 3.8 Vodafone Qatar 8.95 (1.65) (4.48) 7,566 N/A 1.6 N/A Telecoms 37,196 Qatar Navigation (Milaha) 65.20 (0.76) (31.80) 7,467 17.4 0.5 5.4 Gulf Warehousing 47.10 (1.88) (15.89) 2,760 13.2 1.8 3.4 Qatar Gas Transport (Nakilat) 17.70 (1.99) (23.34) 9,806 11.4 1.9 5.6 Transportation 20,034 Qatar Exchange 500,902
- 7. Contacts Saugata Sarkar, CFA Shahan Keushgerian Zaid al-Nafoosi , CMT, CFTe Head of Research Senior Research Analyst Senior Research Analyst Tel: (+974) 4476 6534 Tel: (+974) 4476 6509 Tel: (+974) 4476 6535 saugata.sarkar@qnbfs.com.qa shahan.keushgerian@qnbfs.com.qa zaid.alnafoosi@qnbfs.com.qa Mohamed Abo Daff QNB Financial Services Co. W.L.L. Senior Research Analyst Contact Center: (+974) 4476 6666 Tel: (+974) 4476 6589 PO Box 24025 mohd.abodaff@qnbfs.com.qa Doha, Qatar Disclaimer and Copyright Notice: This publication has been prepared by QNB Financial Services Co. W.L.L. (“QNBFS”) a wholly-owned subsidiary of Qatar National Bank (Q.P.S.C.). QNBFS is regulated by the Qatar Financial Markets Authority and the Qatar Exchange. Qatar National Bank (Q.P.S.C.) is regulated by the Qatar Central Bank. This publication expresses the views and opinions of QNBFS at a given time only. It is not an offer, promotion or recommendation to buy or sell securities or other investments, nor is it intended to constitute legal, tax, accounting, or financial advice. QNBFS accepts no liability whatsoever for any direct or indirect losses arising from use of this report. Any investment decision should depend on the individual circumstances of the investor and be based on specifically engaged investment advice. We therefore strongly advise potential investors to seek independent professional advice before making any investment decision. Although the information in this report has been obtained from sources that QNBFS believes to be reliable, we have not independently verified such information and it may not be accurate or complete. QNBFS does not make any representations or warranties as to the accuracy and completeness of the information it may contain, and declines any liability in that respect. For reports dealing with Technical Analysis, expressed opinions and/or recommendations may be different or contrary to the opinions/recommendations of QNBFS Fundamental Research as a result of depending solely on the historical technical data (price and volume). QNBFS reserves the right to amend the views and opinions expressed in this publication at any time. It may also express viewpoints or make investment decisions that differ significantly from, or even contradict, the views and opinions included in this report. This report may not be reproduced in whole or in part without permission from QNBFS COPYRIGHT: No part of this document may be reproduced without the explicit written permission of QNBFS. Page 7 of 7