Log your LOA pain with Pension Lab's brilliant campaign
QSE Index Gains 1.98% as Trading Value Rises 54
1. `
Page 1 of 6
Market Review and Outlook QSE Index and Volume
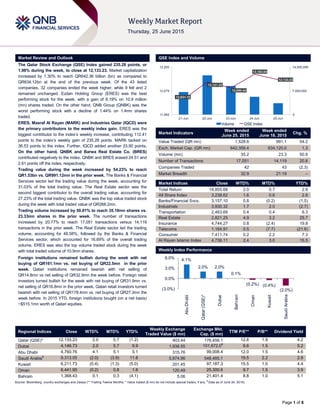
The Qatar Stock Exchange (QSE) Index gained 235.28 points, or
1.98% during the week, to close at 12,133.23. Market capitalization
increased by 1.30% to reach QR642.36 billion (bn) as compared to
QR634.12bn at the end of the previous week. Of the 43 listed
companies, 32 companies ended the week higher, while 9 fell and 2
remained unchanged. Ezdan Holding Group (ERES) was the best
performing stock for the week, with a gain of 8.19% on 10.9 million
(mn) shares traded. On the other hand, QNB Group (QNBK) was the
worst performing stock with a decline of 1.44% on 1.4mn shares
traded.
ERES, Masraf Al Rayan (MARK) and Industries Qatar (IQCD) were
the primary contributors to the weekly index gain. ERES was the
biggest contributor to the index’s weekly increase, contributing 112.41
points to the index’s weekly gain of 235.28 points. MARK tacked on
36.53 points to the index. Further, IQCD added another 33.90 points.
On the other hand, QNBK and Barwa Real Estate Co. (BRES)
contributed negatively to the index. QNBK and BRES erased 24.51 and
2.61 points off the index, respectively.
Trading value during the week increased by 54.23% to reach
QR1.53bn vs. QR991.12mn in the prior week. The Banks & Financial
Services sector led the trading value during the week, accounting for
31.03% of the total trading value. The Real Estate sector was the
second biggest contributor to the overall trading value, accounting for
27.23% of the total trading value. QNBK was the top value traded stock
during the week with total traded value of QR268.2mn.
Trading volume increased by 50.81% to reach 35.18mn shares vs.
23.33mn shares in the prior week. The number of transactions
increased by 20.77% to reach 17,051 transactions versus 14,119
transactions in the prior week. The Real Estate sector led the trading
volume, accounting for 48.58%, followed by the Banks & Financial
Services sector, which accounted for 16.69% of the overall trading
volume. ERES was also the top volume traded stock during the week
with total traded volume of 10.9mn shares.
Foreign institutions remained bullish during the week with net
buying of QR161.1mn vs. net buying of QR22.5mn in the prior
week. Qatari institutions remained bearish with net selling of
QR14.8mn vs net selling of QR32.9mn the week before. Foreign retail
investors turned bullish for the week with net buying of QR31.9mn vs.
net selling of QR16.8mn in the prior week. Qatari retail investors turned
bearish with net selling of QR178.4mn vs. net buying of QR27.3mn the
week before. In 2015 YTD, foreign institutions bought (on a net basis)
~$515.1mn worth of Qatari equities.
Market Indicators
Week ended
June 25, 2015
Week ended
June 18, 2015
Chg. %
Value Traded (QR mn) 1,528.6 991.1 54.2
Exch. Market Cap. (QR mn) 642,359.4 634,120.0 1.3
Volume (mn) 35.2 23.3 50.8
Number of Transactions 17,051 14,119 20.8
Companies Traded 42 43 (2.3)
Market Breadth 32:9 21:19 –
Market Indices Close WTD% MTD% YTD%
Total Return 18,855.68 2.0 0.7 2.9
All Share Index 3,238.62 1.6 0.6 2.8
Banks/Financial Svcs. 3,157.10 0.8 (0.2) (1.5)
Industrials 3,930.32 1.7 2.0 (2.7)
Transportation 2,463.69 0.4 0.4 6.3
Real Estate 2,821.25 4.9 3.2 25.7
Insurance 4,744.27 0.8 (2.4) 19.8
Telecoms 1,164.91 0.5 (7.7) (21.6)
Consumer 7,411.74 0.2 2.2 7.3
Al Rayan Islamic Index 4,736.11 2.4 3.0 15.5
Market Indices
Weekly Index Performance
Regional Indices Close WTD% MTD% YTD%
Weekly Exchange
Traded Value ($ mn)
Exchange Mkt.
Cap. ($ mn)
TTM P/E** P/B** Dividend Yield
Qatar (QSE)* 12,133.23 2.0 0.7 (1.2) 403.44 176,456.1 12.8 1.9 4.2
Dubai 4,146.73 2.0 5.7 9.9 1,938.55 101,672.0#
9.6 1.5 5.2
Abu Dhabi 4,760.76 4.1 5.1 5.1 315.76 99,008.4 12.0 1.5 4.6
Saudi Arabia#
9,313.05 (2.0) (3.9) 11.8 5,974.96 548,485.1 19.5 2.2 2.9
Kuwait 6,211.73 (0.4) (1.3) (5.0) 201.45 97,187.3 15.5 1.0 4.4
Oman 6,441.95 (0.2) 0.8 1.6 120.49 25,300.6 9.7 1.5 3.9
Bahrain 1,368.43 0.1 0.3 (4.1) 5.06 21,401.4 8.8 1.0 5.1
Source: Bloomberg, country exchanges and Zawya (** Trailing Twelve Months; * Value traded ($ mn) do not include special trades, if any;
#
Data as of June 24, 2015)
12,031.15
12,121.22
12,090.44
12,162.04
12,133.23
0
7,000,000
14,000,000
11,950
12,075
12,200
21-Jun 22-Jun 23-Jun 24-Jun 25-Jun
Volume QSE Index
4.1%
2.0% 2.0%
0.1%
(0.2%) (0.4%)
(2.0%)(3.0%)
0.0%
3.0%
6.0%
AbuDhabi
Qatar(QSE)*
Dubai
Bahrain
Oman
Kuwait
SaudiArabia
2. Page 2 of 6
News
Economic News
QNBK: Qatar gas reserves to last 138 years on current
output rates – QNB Group (QNBK) said in a report that Qatar
has enough gas reserves to maintain production at current
rates for around 138 years and is therefore likely to remain
central to global hydrocarbon markets for a number of years to
come. According to QNBK, Qatar remains central to the global
hydrocarbon sector based on new data for 2014 released in
‘BP’s Statistical Review of World Energy’. Qatar remains the
third largest producer of natural gas in the world after the US
and Russia with 5.1% of global production. The country is also
the world’s top exporter of liquefied natural gas (LNG) with 31%
of the total global exports in 2014. This central role is a result of
its large endowment of hydrocarbon reserves. Revenue
generated from Qatar’s hydrocarbon exports provides a stable
source of financing for major infrastructure investments that are
driving the growth and diversification of the domestic economy.
However, gas reserves in Qatar fell 0.6% in 2014 as a result of
the extraction of gas and in the absence of exploration and
development of new reserves due to the moratorium on further
gas development and exploration in the North Field where
almost all of Qatar’s gas reserves are situated. Looking
forward, Qatar is expected to maintain its dominant role in the
global hydrocarbon sector while domestic energy demand is
expected to rise strongly as the population grows. To meet this
rising domestic demand, the Barzan project — a $10.3bn North
Field gas development — is coming online and is expected to
drive growth in the hydrocarbon sector. QNBK expects first
production from Barzan during 2H2015. (Gulf-Times.com)
SFG: Qatar’s inflation to reach 2.5% in 2016; major
infrastructure spending to continue – Samba Financial
Group (SFG) in its latest country report, has said that domestic
population pressures may push Qatar’s inflation to 2.5% in
2016 from 2% in 2015. Consumer prices have fallen sharply
since the index was rebased and reweighted in January 2015,
with inflation standing at 0.9% YoY in April. A major outcome of
the change in the index is a smaller weighting of the rental
component. Rental inflation has been elevated over the last 12
months, offset by the strong dollar and soft international
commodity prices, which have kept a lid on the overall index.
SFG expects these trends to persist. Meanwhile, SFG said
major infrastructure investments in Qatar will go ahead on the
back of planned and ongoing capital expenditure (capex) worth
around $200bn. The spending explicitly linked to the 2022 FIFA
World Cup is about $15.4bn, which represents only 7.5% of the
capex. Aided by large reserves built up from years of
accumulated oil & gas revenues, SFG expects the authorities
concerned to continue implementing the spending set out in the
National Development Strategy (NDS) when oil prices were
over $100 a barrel. (Gulf-Times.com)
MDPS: Qatar inflation edges up in May on education, rents
and transport cost – According to the statistics released by
the Ministry of Development Planning & Statistics (MDPS),
higher education expenses and rents combined with increasing
transportation costs led Qatar’s cost of living based on
consumer price index (CPI) to rise 0.87% YoY in May 2015.
The CPI inflation rose 0.56% MoM mainly on costlier higher
costs for recreation and culture. A MoM analysis of CPI shows
that there are two main groups where respective indices have
risen namely: recreation & culture group (+5.09%), and food &
beverages (+0.04%). A decline in prices is noticed in clothing &
footwear group (-0.21%), restaurants & hotels groups (-0.16%)
and furniture & household equipment (-0.08%). The YoY price
increase is primarily affected by the increasing prices in the
nine groups namely: education (+11.14%), tobacco (+8.59%),
transport (+2.85%), housing & utilities (+2.27%), restaurants &
hotels (+0.74%), furniture & household equipment and food &
beverages by 0.6% each. However, there has been a decrease
in price levels in other groups namely: recreation & culture (-
6.51%), miscellaneous goods & services (-0.41%) and clothing
& footwear (-0.17%). (Gulf-Times.com, QSA)
Market & Corporate News
QNBK to disclose financials on July 8 – QNB Group (QNBK)
will disclose the reviewed financial reports for the period ending
June 30, 2015 on July 8, 2015. (QSE)
DHBK to disclose semi-annual financials on July 14 – Doha
Bank (DHBK) will disclose the reviewed financial reports for the
period ending June 30, 2015 on July 14, 2015. (QSE)
QIBK to disclose financials on July 13 – The Qatar Islamic
Bank (QIBK) will disclose the reviewed financial reports for the
period ending June 30, 2015 on July 13, 2015. (QSE)
MARK to announce financials on July 13 – Masraf Al Rayan
(MARK) will announce the reviewed financial reports for the
period ending June 30, 2015 on July 13, 2015. (QSE)
ABQK to disclose financials on July 12 – Ahli Bank (ABQK)
will disclose the reviewed financial reports for the period ending
June 30, 2015 on July 12, 2015. (QSE)
QFLS to announce financials on July 14 – Woqod (QFLS)
will announce the reviewed financial reports for the period
ending June 30, 2015 on July 14, 2015. (QSE)
CBQK to disclose financials on July 14 – The Commercial
Bank of Qatar (CBQK) will disclose the reviewed financial
reports for the period ending June 30, 2015 on July 14, 2015.
(QSE)
QNCD to announce financials on July 14 – Qatar National
Cement Company (QNCD) will announce the reviewed financial
reports
KCBK finances Al Thumama Mega Reservoir Project – Al
Khalij Commercial Bank (KCBK) has financed a joint venture
(JV) of Consolidated Contractors Group (Offshore) (CCC) and
Teyseer Contracting Company for the construction of the Mega
Reservoir PRPS 5-Al Thumama (Package C) project. This
move is in line with KCBK’s strategy to support rollout of major
infrastructure projects in Qatar and to accommodate growth
requirements of its valuable clients. The Water Security Mega
Reservoir Project involves construction of five huge potable
water mega reservoirs sites and interconnecting network of
large diameter water pipelines. (Zawya)
Woqod to complete 9 fuel stations by 2015-end – According
to Sheikh Hamad bin Saud Al Thani, acting CEO of Woqod
(QFLS), the firm is currently working to set up 20 new fuel
stations across the country and nine of them are expected to be
completed by 2015-end. Meanwhile, work on the remaining 11
stations is scheduled to be completed by 2016-end. He said the
new facilities, once operational, will reduce the rush at existing
fuel stations. The nine stations to be opened this year are in
addition to the Jumailiya and Al Wajba stations opened early in
2015. (Peninsula Qatar)
3. Page 3 of 6
Qatar Stock Exchange
Top Gainers Top Decliners
Source: Qatar Stock Exchange (QSE) Source: Qatar Stock Exchange (QSE)
Most Active Shares by Value (QR Million) Most Active Shares by Volume (Million)
Source: Qatar Stock Exchange (QSE) Source: Qatar Stock Exchange (QSE)
Investor Trading Percentage to Total Value Traded Net Traded Value by Nationality (QR Million)
Source: Qatar Stock Exchange (QSE) Source: Qatar Stock Exchange (QSE)
8.2%
4.5%
3.9%
3.4% 3.2%
0.0%
3.0%
6.0%
9.0%
Ezdan Real
Estate
Islamic
Holding Group
Doha
Insurance
Salam
International
Investment
Masraf Al
Rayan -1.4%
-1.2%
-0.9%
-0.5% -0.5%
-1.5%
-1.0%
-0.5%
0.0%
QNB Group Qatar Fuel Al Khaleej Takaful
Insurance
Milaha Zad Holding
268.2
200.7
142.3
113.4
102.7
0.0
100.0
200.0
300.0
QNB Group Ezdan Real
Estate
Barwa Real
Estate
Industries
Qatar
Gulf
International
Services
10.9
3.9
2.7
2.2
1.4
0.0
4.0
8.0
12.0
Ezdan Real
Estate
Vodafone Qatar Barwa Real
Estate
Mazaya Qatar QNB Group
0%
20%
40%
60%
80%
100%
Buy Sell
39.93%
51.60%
13.60%
14.57%
19.11%
17.02%
27.36%
16.82%
Qatari Individuals Qatari Institutions
Non-Qatari Individuals Non-Qatari Institutions
818
710
1,011
517
(193)
193
(400) (200) - 200 400 600 800 1,000 1,200
Qatari
Non-Qatari
Net Investment Total Sold Total Bought
4. Page 4 of 6
TECHNICAL ANALYSIS OF THE QSE INDEX
Source: Bloomberg
The QSE Index managed to gain 1.98% this week vs. the previous week. Volumes are picking up but still below average. The Index is trapped between the
11,800 support level and the 12,600 resistance level. We cannot say that technical indicators are positive, but we can stipulate that they are improving. If
the Index breaks above 12,200 then it could continue higher. Otherwise, it will be stuck in limbo.
DEFINITIONS OF KEY TERMS USED IN TECHNICAL ANALYSIS
RSI (Relative Strength Index) indicator – RSI is a momentum oscillator that measures the speed and change of price movements. The RSI oscillates
between 0 to 100. The index is deemed to be overbought once the RSI approaches the 70 level, indicating that a correction is likely. On the other hand, if
the RSI approaches 30, it is an indication that the index may be getting oversold and therefore likely to bounce back.
MACD (Moving Average Convergence Divergence) indicator – The indicator consists of the MACD line and a signal line. The divergence or the
convergence of the MACD line with the signal line indicates the strength in the momentum during the uptrend or downtrend, as the case may be. When the
MACD crosses the signal line from below and trades above it, it gives a positive indication. The reverse is the situation for a bearish trend.
Candlestick chart – A candlestick chart is a price chart that displays the high, low, open, and close for a security. The ‘body’ of the chart is portion between
the open and close price, while the high and low intraday movements form the ‘shadow’. The candlestick may represent any time frame. We use a one-day
candlestick chart (every candlestick represents one trading day) in our analysis.
Doji candlestick pattern – A Doji candlestick is formed when a security's open and close are practically equal. The pattern indicates indecisiveness, and
based on preceding price actions and future confirmation, may indicate a bullish or bearish trend reversal.
Shooting Star/Inverted Hammer candlestick patterns – These candlestick patterns have a small real body (open price and close price are near to each
other), and a long upper shadow (large intraday movement on the upside). The Shooting Star is a bearish reversal pattern that forms after a rally. The
Inverted Hammer looks exactly like a Shooting Star, but forms after a downtrend. Inverted Hammers represent a potential bullish trend reversal.
5. Page 5 of 6
Source: Bloomberg
Company Name
Price
(June 25)
% Change 5-
Day
% Change
YTD
Market Cap.
QR Million TTM P/E P/B Div. Yield
Qatar National Bank 185.30 (1.44) (12.96) 129,660 12.1 2.4 4.0
Qatar Islamic Bank 106.70 2.60 4.40 25,212 15.3 2.4 4.0
Commercial Bank of Qatar 55.00 1.85 (11.68) 17,965 10.0 1.1 5.8
Doha Bank 53.30 2.11 (6.49) 13,771 10.0 1.3 7.5
Al Ahli Bank 46.00 0.00 (7.33) 8,359 13.5 2.0 3.0
Qatar International Islamic Bank 80.00 1.01 (2.08) 12,109 14.5 2.4 5.0
Masraf Al Rayan 46.80 3.20 5.88 35,100 16.9 3.3 3.7
Al Khaliji Bank 22.50 0.81 2.04 8,100 13.5 1.4 4.4
National Leasing 21.00 1.45 5.00 1,039 37.5 0.9 4.0
Dlala Holding 27.80 1.46 (16.86) 790 14.0 2.7 N/A
Qatar & Oman Investment 16.22 2.98 5.32 511 16.6 1.5 4.9
Islamic Holding Group 137.80 4.47 10.68 551 33.3 9.3 2.2
Banking and Financial Services 253,168
Zad Holding 100.00 (0.50) 19.05 1,308 11.8 1.6 4.0
Qatar German Co. for Medical Devices 16.50 (0.12) 62.56 191 N/A 1.2 N/A
Salam International Investment 14.07 3.38 (11.23) 1,608 20.1 1.0 4.3
Medicare Group 187.10 1.68 59.91 5,266 26.8 6.3 1.0
Qatar Cinema & Film Distribution 41.60 0.12 4.00 261 21.0 1.8 2.2
Qatar Fuel 171.80 (1.15) (15.91) 14,510 12.7 2.4 5.2
Qatar Meat and Livestock 64.10 1.75 6.13 1,154 21.4 4.5 3.9
Al Meera Consumer Goods 255.20 1.27 27.60 5,104 22.2 4.1 3.5
Consumer Goods and Services 29,402
Qatar Industrial Manufacturing 47.00 2.17 8.42 2,233 14.5 1.6 6.4
Qatar National Cement 120.30 (0.17) 0.25 6,497 15.6 2.6 3.0
Industries Qatar 140.30 2.48 (16.49) 84,882 14.9 2.8 5.0
Qatari Investors Group 54.00 2.08 30.43 6,714 29.0 3.0 1.4
Qatar Electricity and Water 221.30 1.47 18.03 24,343 15.0 3.9 3.4
Mannai Corp. 112.00 0.18 2.75 5,109 9.4 2.5 5.4
Aamal 15.20 0.80 5.07 9,576 16.2 1.4 6.3
Gulf International Services 80.80 1.89 (16.79) 15,016 9.5 4.3 6.8
Mesaieed Petrochemical Holding 24.14 0.29 -18.2 30,328 21.0 2.3 4.6
Industrials 184,698
Qatar Insurance 96.90 0.83 23.00 17,890 18.2 3.1 2.2
Doha Insurance 26.50 3.92 (8.62) 1,325 12.2 1.3 3.8
Qatar General Insurance & Reinsurance 56.00 0.00 9.15 4,455 4.9 0.8 3.1
Al Khaleej Takaful Insurance 42.80 (0.93) (3.11) 1,093 14.7 1.7 3.0
Qatar Islamic Insurance 82.60 0.73 4.56 1,239 14.8 4.3 4.8
Insurance 26,001
United Development 24.64 2.88 4.45 8,725 16.2 0.8 5.1
Barw a Real Estate 52.80 (0.38) 26.01 20,546 3.5 1.1 4.2
Ezdan Real Estate 18.50 8.19 23.99 49,071 34.5 1.7 2.2
Mazaya Qatar Real Estate Development 19.00 1.33 4.18 1,995 11.5 1.5 1.5
Real Estate 80,337
Qatar Telecom 85.20 (0.47) (31.23) 27,291 15.6 1.3 4.7
Vodafone Qatar 16.75 2.82 1.82 14,160 N/A 2.5 1.0
Telecoms 41,452
Qatar Navigation (Milaha) 97.30 (0.51) (2.21) 11,143 10.4 0.9 5.7
Gulf Warehousing 76.00 0.53 34.75 3,615 23.8 4.3 2.0
Qatar Gas Transport (Nakilat) 22.40 1.08 (3.03) 12,544 13.7 4.3 5.4
Transportation 27,302
Qatar Exchange 642,359
6. Contacts
Saugata Sarkar Sahbi Kasraoui QNB Financial Services SPC
Head of Research Head of HNI Contact Center: (+974) 4476 6666
Tel: (+974) 4476 6534 Tel: (+974) 4476 6544 PO Box 24025
saugata.sarkar@qnbfs.com.qa sahbi.alkasraoui@qnbfs.com.qa Doha, Qatar
Disclaimer and Copyright Notice: This publication has been prepared by QNB Financial Services SPC (“QNBFS”) a wholly-owned subsidiary of QNB SAQ (“QNB”). QNBFS is regulated by the
Qatar Financial Markets Authority and the Qatar Exchange QNB SAQ is regulated by the Qatar Central Bank. This publication expresses the views and opinions of QNBFS at a given time only. It is
not an offer, promotion or recommendation to buy or sell securities or other investments, nor is it intended to constitute legal, tax, accounting, or financial advice. QNBFS accepts no liability
whatsoever for any direct or indirect losses arising from use of this report. Any investment decision should depend on the individual circumstances of the investor and be based on specifically
engaged investment advice. We therefore strongly advise potential investors to seek independent professional advice before making any investment decision. Although the information in this report
has been obtained from sources that QNBFS believes to be reliable, we have not independently verified such information and it may not be accurate or complete. QNBFS does not make any
representations or warranties as to the accuracy and completeness of the information it may contain, and declines any liability in that respect. For reports dealing with Technical Analysis,
expressed opinions and/or recommendations may be different or contrary to the opinions/recommendations of QNBFS Fundamental Research as a result of depending solely on the historical
technical data (price and volume). QNBFS reserves the right to amend the views and opinions expressed in this publication at any time. It may also express viewpoints or make investment
decisions that differ significantly from, or even contradict, the views and opinions included in this report. This report may not be reproduced in whole or in part without permission from QNBFS
COPYRIGHT: No part of this document may be reproduced without the explicit written permission of QNBFS.
Page 6 of 6