QNBFS Weekly Market Report November 16, 2023
•
0 likes•2 views

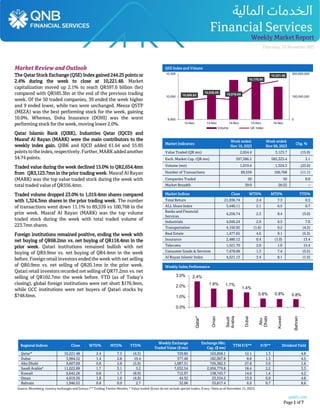
The Qatar Stock Exchange (QSE) Index gained 244.25 points or 2.4% during the week to close at 10,221.48.

Recommended
More Related Content
Similar to QNBFS Weekly Market Report November 16, 2023
Similar to QNBFS Weekly Market Report November 16, 2023 (20)
More from QNB Group
More from QNB Group (20)
Recently uploaded
Recently uploaded (20)
QNBFS Weekly Market Report November 16, 2023
- 1. qnbfs.com Page 1 of 7 Weekly MarketReport Thursday,16 November 2023 Regional Indices Close WTD% MTD% YTD% Weekly Exchange Traded Value ($ mn) Exchange Mkt. Cap. ($ mn) TTM P/E** P/B** Dividend Yield Qatar* 10,221.48 2.4 7.3 (4.3) 729.85 163,858.1 12.1 1.3 4.8 Dubai 3,984.52 1.4 2.8 19.4 377.48 182,067.8 8.8 1.3 4.5 Abu Dhabi 9,607.09 0.8 2.8 (5.9) 1,087.31 726,382.3 27.8 3.0 1.6 Saudi Arabia# 11,022.89 1.7 3.1 5.2 7,032.54 2,956,779.8 18.4 2.2 3.3 Kuwait 6,642.26 0.8 1.7 (8.9) 712.97 138,743.7 14.0 1.4 4.2 Oman 4,619.36 1.8 1.6 (4.9) 44.32 23,554.2 13.9 0.9 4.8 Bahrain 1,946.52 0.8 0.9 2.7 32.06 53,817.4 6.9 0.7 8.6 Source: Bloomberg, country exchanges and Zawya (** Trailing Twelve Months; * Value traded ($ mn) do not include special trades, if any; #Data as of November 15, 2023) Market Review and Outlook QSE Index and Volume The Qatar Stock Exchange (QSE) Index gained 244.25 points or 2.4% during the week to close at 10,221.48. Market capitalization moved up 2.1% to reach QR597.6 billion (bn) compared with QR585.3bn at the end of the previous trading week. Of the 50 traded companies, 39 ended the week higher and 9 ended lower, while two were unchanged. Meeza QSTP (MEZA) was the best performing stock for the week, gaining 10.0%. Whereas, Doha Insurance (DOHI) was the worst performing stock for the week, moving lower 2.0%. Qatar Islamic Bank (QIBK), Industries Qatar (IQCD) and Masraf Al Rayan (MARK) were the main contributors to the weekly index gain. QIBK and IQCD added 61.64 and 55.85 pointsto theindex, respectively. Further, MARK added another 54.74 points. Traded value during the week declined 15.0% to QR2,654.4mn from QR3,123.7mn in the prior trading week. Masraf Al Rayan (MARK) was the top value traded stock during the week with total traded value of QR556.4mn. Traded volume dropped 23.0% to 1,019.4mn shares compared with 1,324.3mn shares in the prior trading week. The number of transactions went down 11.1% to 89,539 vs 100,768 in the prior week. Masraf Al Rayan (MARK) was the top volume traded stock during the week with total traded volume of 223.7mn shares. Foreign institutions remained positive, ending the week with net buying of QR68.2mn vs. net buying of QR118.4mn in the prior week. Qatari institutions remained bullish with net buying of QR9.9mn vs. net buying of QR4.4mn in the week before. Foreign retail investors ended the week with net selling of QR0.9mn vs. net selling of QR20.1mn in the prior week. Qatari retail investors recorded net selling of QR77.2mn vs. net selling of QR102.7mn the week before. YTD (as of Today’s closing), global foreign institutions were net short $176.9mn, while GCC institutions were net buyers of Qatari stocks by $748.6mn. Market Indicators Week ended. Nov 16, 2023 Week ended. Nov 09, 2023 Chg. % Value Traded (QR mn) 2,654.4 3,123.7 (15.0) Exch. Market Cap. (QR mn) 597,586.2 585,323.4 2.1 Volume (mn) 1,019.4 1,324.3 (23.0) Number of Transactions 89,539 100,768 (11.1) Companies Traded 50 50 0.0 Market Breadth 39:9 26:22 – Market Indices Close WTD% MTD% YTD% Total Return 21,936.74 2.4 7.3 0.3 ALL Share Index 3,440.11 2.1 6.5 0.7 Banks and Financial Services 4,256.74 2.3 8.4 (3.0) Industrials 4,046.24 2.9 6.5 7.0 Transportation 4,150.92 (1.6) 0.2 (4.3) Real Estate 1,477.65 4.6 9.1 (5.3) Insurance 2,480.12 0.4 (1.0) 13.4 Telecoms 1,521.70 2.0 1.0 15.4 Consumer Goods & Services 7,478.08 1.3 7.4 (5.5) Al Rayan Islamic Index 4,521.13 3.4 8.1 (1.5) Weekly Index Performance 10,006.93 10,035.05 10,016.65 10,178.90 10,221.48 0 150,000,000 300,000,000 9,800 10,050 10,300 12-Nov 13-Nov 14-Nov 15-Nov 16-Nov Volume QE Index 2.4% 1.8% 1.7% 1.4% 0.8% 0.8% 0.8% 0.0% 1.0% 2.0% 3.0% Qatar* Oman Saudi Arabia Dubai Abu Dhabi Kuwait Bahrain
- 2. qnbfs.com Page 2 of 7 Economic, Market & Company News MSCI Semi-Annual Index Review results: November 2023 - MSCI announced on November 14th, 2023, the results of the MSCI Equity Indexes November 2023 Index Review. For the MSCI Qatar Indices the outcome of the review is as follows: (MSCI and QSE) QNB Group successfully refinances $2bn senior unsecured syndicated term loan facility - QNB Group, the largest financial institution in the Middle East and Africa, announced the successful refinancing of its $2bn unsecured syndicated term loan facility. Abdulla Mubarak Al-Khalifa, QNB’s Group CEO commented: “This refinancing attracted the interest of global and regional banks and helped us further broaden our investor base. The issuance was substantially oversubscribed at competitive all-in pricing, which despite challenging global markets demonstrates our standing as a high-quality issuer. We see this transaction as confirmation of our successful strategy of becoming a leading bank in MEASEA and establishing meaningful relationships.” The $2bn facility, with a maturity of three years was well supported by both regional and international banks with substantial oversubscription. The syndication was led by Bank of America Europe Designated Activity Company, Barclays Bank PLC, HSBC Bank Middle East Limited, J.P. Morgan Securities plc, Mizuho Bank, Ltd., Standard Chartered Bank and SMBC Bank International plc (the Initial Mandated Lead Arrangers). HSBC was mandated as Scheduling Co-Ordinator, SMBC as the Documentation Co-Ordinator, while Mizuho was mandated as the Syndication Co-Ordinator and Facility Agent. QNB Group currently ranks as the most valuable bank brand in the Middle East and Africa. Through its subsidiaries and associate companies, QNB Group extends to more than 28 countries across three continents providing a comprehensive range of advanced products and services. The total number of employees is more than 30,000 operating through 900 locations, with an ATM network of more than 4,800 machines. (Qatar Tribune) Expo 2023 Doha records more than 650,000 visitors - Expo 2023 Doha has recorded more than 650,000 visitors since the exhibition opened on October 2, secretary-general Engineer Mohamed Ali al-Khoury told Gulf Times Monday. Speaking on the sidelines of the inauguration of the Gulf Engineering Union’s pavilion at the International Zone, he said that the expo has drawn visitors, including school students, to learn about preserving the environment, sustainability, Qatar’s future plans, and the cultures and customs of the participating countries. The Gulf Engineering Union, through its pavilion, will educate visitors about the latest trends in sustainability and techniques in the farming and irrigation sectors. The pavilion encompasses four vital areas, with an exclusive area for engineers to exchange experiences. The educational area features engineering techniques in developing agriculture, including smart irrigation methods, and vertical agriculture while highlighting the use of robots in farm management. There are also entertainment and sport areas. “The Gulf Engineering Union pavilion has programs for school students,” al-Khoury said. “Three schools will be received on a daily basis ... the number may increase in the future.” He noted that more than 80% of the expo’s pavilions are now open, with a number of the countries taking part in the expo for only a few months. Al-Khoury said that the exhibition also offers lectures by local universities and seminars organized on the event’s sidelines. Engineer Khaled al-Nasr, chairman of the Board of Directors of the Qatar Society of Engineers, highlighted that the Gulf Engineering Union has made many contributions to the development of agriculture. (Gulf Times) Consumer Price Indexrises by 1.08% inOctober 2023 - The Consumer Price Index (CPI) for October 2023 reached 108.09 points, showing an increase of 1.08% when compared to CPI of September 2023. Compared to CPI of October 2022 (Y-o-Y basis), an increase of 2.52% has been recorded in the generalindex (CPI) of this month. According to a statement issued by the Planning and Statistics Authority (PSA) Wednesday, the monthly increase on CPI of September 2023 was attributed to a rise in six groups: Recreation and Culture by 10.27%; Restaurants and Hotels by 2.83%; Food and Beverages by 0.25%; Communication by 0.18%; Miscellaneous Goods and Services by 0.16%; in addition to a slight increase in Health by 0.08%. A decrease has been recorded in Furniture and Household Equipment by 2.08%, followed by Clothing and Footwear by 0.84%, Transport by 0.67%, Housing, Water, Electricity and other Fuel by 0.59%. Tobacco, and Education remained flat at the last months price level. A comparison of the CPI of October 2023 with the CPI of October 2022 (Annual Change), an increase has been recorded in the general index (CPI) by 2.52%. This Y-o-Y price increase was primary due to the prices rising in six groups namely: Communication by 14.50%, Recreation and Culture by 11.18%, Education by 6.72%, Food and Beverages by 3.86%, Transport by 1.22%, Miscellaneous Goods and Services by 1.21%. A decrease has been shown in price levels in Housing, Water, Electricity and other Fuel by 2.41%, Restaurants and Hotels by 2.35%, Clothing and Footwear by 1.35%, Furniture and Household Equipment by 0.22%, and slight decrease in Health by 0.06%. No changes recorded on Tobacco. (Peninsula Qatar) IGU: Qatar drives Middle East prominence in global LNG landscape - The Middle East, led by Qatar, will be an important region in the global LNG landscape, the International Gas Union (IGU) said in its latest report. With ongoing expansion plans at the huge North Field, Qatar could “potentially boost” LNG export capacity to 126mn tonnes per year (MTPY)by 2030, from77.8MTPY (as of August2023) it said. “Given the low-cost production of North Field East fields and shipping cost advantages, Qatar is primed to serve both European and Asian LNG demand in the long term,” IGU said in its ‘Global gas report 2023’. Qatar, Russia, and Nigeria are the next three dominant exporters of LNG to Europe, with the region’s largest being France, Addition(s) to the MSCI Qatar Index* (*MSCI Qatar Index includes companies included in both MSCI Qatar Large Cap Index and MSCI Qatar Mid Cap Index) None Deletion(s) from the MSCI Qatar Index None Addition(s) to the MSCI Qatar Small Cap Index None Deletion(s) from the MSCI Qatar Small Cap Index None
- 3. qnbfs.com Page 3 of 7 Spain, Belgium, and the Netherlands, it said. The report noted global gas demand decreased by 1.5% in 2022 compared to 2021, with large declines in Europe and Asia off set by strong growth in North America. Falling demand in the regions hit hardest by the energy crisis persisted during the first half (H1) of 2023 and was primarily driven by industrial slowdown and decreased heating demand caused by a mild winter in the northern hemisphere. Although global demand dropped by 1.5% in 2022, regional demand destruction was a lot more pronounced, IGU said. Europe’s gas demand decreased by almost 12% in 2022 year-on-year, in response to the supply and price shocks coming on the heels of the Russia-Ukraine war. The good luck of a very mild 2022- 23 winter was a major contributor to Europe’s reduced gas demand, together with significant losses in industrial demand, gas to coal switch, and renewables uptake. Spikes in international spot LNG prices caused the demand in Asia to fall by 18 bcm (1.9%) in 2022 compared to 2021. Significant demand destruction also happened in South Asia, where the price of LNG became unaffordable, causing switching to coal wherever possible and leading to shortages and blackouts. For instance, Pakistan and Bangladesh saw a 12% and 15% reduction in gas demand, respectively. On the contrary, North American gas demand grew by 4.8% or 49 bcm year-on-year in 2022, a notable increase driven primarily by increased gas-fired power generation as well as residential and commercial applications. The North American market prices remained largely isolated and affordable, due to its predominantly regional nature with domestic production. IGU noted that from January to August of this year, the European Union (EU) saw a cumulative gas consumption decrease of roughly 10% year- on-year (both an effect from industrial slowdown and the EU’s intentional switch from gas to other energy sources), while China saw gas demand grow by 5.4% year-on-year during H1, 2023. (Gulf Times) Freight and logistics industry to amount to over QR44bn by 2029 - The Qatar freight and logistics market is estimated to amount to QR32.15bn ($8.83bn) this year and is expected to amount to QR44.16bn ($12.13bn) by 2029. According to the Mordor Intelligence report, the sector is poised for a compound annual growth rate (CAGR) of 5.44% in the next half a decade. As Qatar is one of the leading liquefied nitrogen gas (LNG) suppliers worldwide, the country has backed and played a crucial role in the growth of the logistics market. The report notes that the market’s growth can be attributed to new expansion plans due to their hosting of FIFA 2022 and expects to be driven by expanding industrial activities, evolving e-commerce and automotive sectors, upcoming infrastructure developments, and continuous investments by the government to enhance logistics infrastructure. It also states that in 2020, the transportation and storage market had a GDP share contribution of nearly 4.1%, the highest from 2017-2022. Accelerating shift in the trade sector and transportation infrastructure in the country, logistics areas project invested roughly over QR29bn ($8bn). However, Qatar’s transportation industry attained a valuation of around QR44bn ($12bn) in 2022. It said: “The nation holds the second position in the region for its effective logistics services and ranks fifth among the GCC countries regarding port capacity.” The contribution of close to QR36bn ($9.9bn) to Qatar’s GDP in 2022 from transportation and storage unlocks doors to diverse possibilities, including investment prospects. “The Logistics Areas Project in the southern region of Qatar is expected to draw QR30bn ($8.17bn) in direct investments for development projects,” the report mentioned. The project, however, is expected to be developed as a regional hub for investments and logistics services, fostering trade sector competition and actively promoting the private sector to partake in the Qatar National Vision 2030. “The project will also offer logistics services, such as assembly, processing, open storage spaces, storage facilities, exhibitions, shops, and commercial offices,” it added. The Qatar Freight and Logistics Market is fragmented, with the top five companies occupying 10.95%. The key players in this market are Gulf Agency Company (GAC), Gulf Ware-housing Company, Milaha Group, Nakilat Agency Company (NAC) - Nakilat, and Qatar Airways Cargo, respectively. (Peninsula Qatar) Qatar’s construction sector anticipates growth of 3.6% - The Qatari construction sector is expected to grow by 3.6% in real terms in 2023, following an estimated annual growth of 4.7% in 2022, states analysts at the Research and Markets. However, growth this year will be aided by the development of energy, utility, and transportation projects as the publisher estimates that oil and gas projects amounting to at least QR38.2bn ($10.5bn) will commence this year. Additionally, the country’s plan to increase Liquefied Natural Gas (LNG) production capacity from 77mn tonnes per year last year to 126mn tonnes per year by 2027, combined with the North Field expansion, with a recently signed partnership deal between Qatar Energy and TotalEnergies for the first and largest phase of construction for almost QR109.2bn ($30bn), will contribute to the construction market’s output in the medium to long term. The research entity states that “In the short to medium term, constraints may arise due to global supply chain issues, a weakening of export markets amid inflationary pressures in major countries, and monetary policy tightening.” During the remaining forecasted period, the industry is anticipated to grow at an annual average rate of 3.8% between 2024 and 2027, supported by investment in the industrial, renewable energy, housing, and oiland gas sectors. “Qatar Energy signed agreements with Qatar QSC and its subsidiary, Qatar Fertilizer, to construct a blue ammonia plant capable of producing up to 1.2mn tonnes of ammonia per year, with construction beginning in 2023 and ending in 2026, the report noted. On the other hand, Qatar Energy and Chevron Phillips Chemical inked a partnership deal of a final investment decision (FID) earlier this year aiming to invest a total of QR21.8bn ($6bn) in the industry of the integrated olefins and polyethylene complex, which is expected to be completed by 2026. Research and Markets mentioned that the sector will regain some growth momentum from 2025, supported by investments in the transport, renewable energy, housing, and oil and gas sectors. In May 2023, Qatar’s Public Works Authority (Ashghal) announced a plan to invest QR4.1bn ($1.1bn) on 22 building projects. Of the total, 10 projects, with an estimated value of over QR3bn ($824.2m), are under implementation. Among the important developments include the construction of the Hamad General Hospital, the establishment of the Madinat Khalifa Health Centre, and the rehabilitation of the veterinary laboratory building of the Ministry of Municipality. The report said that“Qatar’s planto increase Liquefied NaturalGas (LNG) production capacity from 77mn tons per year in 2022 to 126mn tons per year by 2027, combined with investments as part of the North Field expansion project, will also boost the industry’s growth over the forecast period.”QatarEnergy also awarded a QR2bn ($5660mn) contract to the Spanish engineering firm Técnicas Reunidas for carrying out Engineering, Procurement, and Construction (EPC) work related to the North Field South Project (NFS) in August 2023. (Peninsula Qatar)
- 4. qnbfs.com Page 4 of 7 Qatar Stock Exchange Top Gainers Top Decliners Source: Qatar Stock Exchange (QSE) Source: Qatar Stock Exchange (QSE) Most Active Shares by Value (QR Million) Most Active Shares by Volume (Million) Source: Qatar Stock Exchange (QSE) Source: Qatar Stock Exchange (QSE) Investor Trading Percentage to Total Value Traded Net Traded Value by Nationality (QR Million) Source: Qatar Stock Exchange (QSE) Source: Qatar Stock Exchange (QSE) 10.1% 8.7% 8.7% 8.6% 7.9% 0.0% 4.0% 8.0% 12.0% MEEZA QSTP Medicare Group Widam Food Company Masraf Al Rayan Qatari Investors Group -2.0% -1.9% -1.6% -1.5% -1.3% -3.0% -2.0% -1.0% 0.0% Doha Insurance Group Qatar Gas Transport Company Limited Damaan Islamic Insurance Company Qatar Navigation Mannai Corporation 556.4 237.7 144.0 138.2 121.7 0.0 200.0 400.0 600.0 Masraf Al Rayan QNB Group Qatar Islamic Bank Gulf International Services Industries Qatar 223.7 82.5 70.6 63.8 52.4 0.0 100.0 200.0 300.0 Masraf Al Rayan Ezdan Holding Group Qatar Aluminium Manufacturing Company Mazaya Qatar Real Estate Development Lesha Bank 0% 20% 40% 60% 80% 100% Buy Sell 30.06% 33.03% 38.05% 37.67% 13.25% 13.23% 18.65% 16.08% Qatari Individuals Qatari Institutions Non-Qatari Individuals Non-Qatari Institutions 1,808 847 1,877 778 -69 69 -500 0 500 1,000 1,500 2,000 Qatari Non-Qatari Net Investment Total Sold Total Bought
- 5. qnbfs.com Page 5 of 7 TECHNICAL ANALYSIS OF THE QSE INDEX Source: Bloomberg The QE index closed up (2.5% from the week before); it closed at 10,221.5 points. The current move, on the weekly chart, suggests that the V-shaped recovery is expected to continue more on the upside. We have to signify the fact that, technically, the Index remains inside a downtrend channel. The 9,200-9,000 levels remain to be our support levels on the weekly chart and the resistance level at the 10,500 points on the Index. DEFINITIONS OF KEY TERMS USED IN TECHNICAL ANALYSIS RSI (Relative Strength Index) indicator – RSI is a momentum oscillator that measures the speedand change of price movements. The RSI oscillates between 0 to 100. The index is deemed to be overbought once the RSI approaches the 70 level, indicating that a correction is likely. On the other hand, if the RSI approaches 30, it is an indication that the index may be getting oversold and therefore likely to bounce back. MACD (Moving Average Convergence Divergence) indicator – The indicator consists of the MACD line and a signal line. The divergence or the convergence of the MACD line with the signal line indicates the strength in the momentum during the uptrend or downtrend, as the case may be. When the MACD crosses the signal line from below and trades above it, it gives a positive indication. The reverse is the situation for a bearish trend. Candlestick chart – A candlestick chart is a price chart that displays the high, low, open, and close for a security. The ‘body’ of the chart is portion between the open and close price, while the high and low intraday movements form the ‘shadow’. The candlestick may represent any time frame. We use a one-day candlestick chart (every candlestick represents one trading day) in our analysis. Doji candlestick pattern – A Doji candlestick is formed when a security's open and close are practically equal. The pattern indicates indecisiveness, and based on preceding price actions and future confirmation, may indicate a bullish or bearish trend reversal. ShootingStar/Inverted Hammer candlestick patterns – These candlestick patterns have a small real body (open price and close price are near to each other), and a long upper shadow (large intraday movement on the upside). The Shooting Star is a bearish reversal pattern that forms after a rally. The Inverted Hammer looks exactly like a Shooting Star, but forms after a downtrend. Inverted Hammers represent a potential bullish trend reversal.
- 6. qnbfs.com Page 6 of 7 Source: Bloomberg Com pan y Nam e P rice Nove m be r 16 % Ch an ge We e kly % Ch an ge YTD Marke t Cap. QR Million TTM P /E P /B Div. Yie ld Qatar National Bank 15.83 (0.31) (12.06) 146,213 10.4 1.7 3.8 Qatar Islamic Bank 18.79 4.39 1.24 44,399 11.1 1.8 3.3 Commercial Bank of Qatar 5.45 2.46 9.00 22,058 8.2 1.1 4.6 Doha Bank 1.73 2.43 (11.52) 5,358 19.3 0.5 4.3 Al Ahli Bank 3.75 0.00 (6.46) 9,569 12.3 1.4 5.3 Qatar International Islamic Bank 9.98 1.88 (4.04) 15,107 14.5 2.1 4.0 Masraf Al Rayan 2.53 8.63 (20.25) 23,520 20.0 1.0 4.0 Lesha Bank 1.40 3.03 21.92 1,564 21.4 1.3 N/A National Leasing 0.74 1.78 5.40 367 25.2 0.6 4.0 Dlala Holding 1.38 3.44 21.10 263 N/A 1.4 N/A Qatar & Oman Investment 0.90 1.36 62.91 282 N/A 1.2 N/A Islamic Holding Group 3.96 (1.17) (3.77) 224 34.5 1.5 1.3 Dukhan Bank 3.99 4.53 (8.21) 20,900 1.8 0.2 4.0 Ban kin g an d Fin an cial Se rvice s 289,823 Zad Holding 13.50 0.00 (2.91) 3,880 21.0 3.1 4.4 Qatar German Co. for Medical Devices 1.58 2.26 26.01 183 N/A 5.3 N/A Salam International Investment 0.70 0.29 13.68 798 19.6 0.6 N/A Baladna 1.27 4.08 (16.79) 2,422 26.6 1.0 N/A Medicare Group 5.63 8.73 (9.33) 1,584 21.5 1.6 4.7 Qatar Cinema & Film Distribution 3.01 0.00 (3.37) 189 42.3 1.5 2.0 Qatar Fuel 16.22 0.75 (9.64) 16,127 15.9 1.8 5.5 Widam Food 2.32 8.65 14.32 418 N/A 3.4 N/A Mannai Corp. 3.98 (1.29) (47.50) 1,817 N/A 1.9 2.5 Al Meera Consumer Goods 13.08 (0.46) (14.62) 2,694 14.1 1.7 3.3 Mekdam Holding Group 5.19 2.65 (9.94) 421 12.2 3.0 5.1 Meeza QSTP 2.87 10.07 32.44 1,865 N/A N/A N/A Con sum e r Goods an d Se rvice s 32,400 Qatar Industrial Manufacturing 3.00 1.63 (6.57) 1,425 8.7 0.8 4.3 Qatar National Cement 3.60 0.90 (25.58) 2,354 11.2 0.8 8.3 Industries Qatar 13.38 3.88 4.45 80,949 17.4 2.1 8.2 Qatari Investors Group 1.62 7.93 (3.91) 2,014 12.7 0.7 9.3 Qatar Electricity and Water 17.40 2.65 (1.69) 19,140 12.3 1.3 5.5 Aamal 0.84 1.95 (14.15) 5,273 14.7 0.7 6.0 Gulf International Services 2.78 0.22 90.27 5,159 11.8 1.3 3.6 Mesaieed Petrochemical Holding 1.62 1.25 (23.84) 20,352 17.8 1.2 6.8 Estithmar Holding 2.05 0.05 13.89 6,978 20.4 1.5 N/A Qatar Aluminum Manufacturing 1.29 1.57 (15.00) 7,210 15.3 1.1 7.0 In dustrials 150,854 Qatar Insurance 2.43 0.21 26.11 7,920 33.7 1.4 N/A QLM Life & Medical Insurance 2.70 3.85 (43.74) 945 10.9 1.6 4.6 Doha Insurance 2.23 (2.02) 12.68 1,115 7.6 0.9 6.7 Qatar General Insurance & Reinsurance 1.21 1.68 (17.57) 1,059 N/A 0.2 N/A Al Khaleej Takaful Insurance 3.01 3.94 30.73 768 13.4 1.3 3.3 Qatar Islamic Insurance 8.80 (0.90) 1.15 1,320 10.3 2.9 5.1 Damaan Islamic Insurance Company 3.69 (1.60) (12.35) 738 N/A 1.5 4.3 In suran ce 13,865 United Development 1.02 3.45 (21.54) 3,612 8.8 0.3 5.4 Barwa Real Estate 2.81 5.47 (2.05) 10,950 9.3 0.5 6.2 Ezdan Real Estate 0.91 5.79 (8.69) 24,244 N/A 0.7 N/A Mazaya Qatar Real Estate Development 0.68 1.19 (2.01) 790 24.9 0.8 N/A Re al Estate 39,595 Ooredoo 9.99 2.12 8.58 31,997 10.8 1.2 4.3 Vodafone Qatar 1.80 1.75 13.44 7,600 13.5 1.6 5.6 Te le com s 39,597 Qatar Navigation (Milaha) 9.44 (1.48) (6.97) 10,729 10.4 0.6 3.7 Gulf Warehousing 3.10 1.60 (23.34) 182 7.8 0.8 3.2 Qatar Gas Transport (Nakilat) 3.39 (1.94) (7.43) 18,781 12.6 1.6 3.8 Tran sportation 29,692 Qatar Exch an ge 597,586
- 7. qnbfs.com Contacts QNB Financial Services Co. W.L.L. Contact Center: (+974) 4476 6666 info@qnbfs.com.qa Doha, Qatar Saugata Sarkar, CFA, CAIA Head of Research saugata.sarkar@qnbfs.com.qa Shahan Keushgerian Senior Research Analyst shahan.keushgerian@qnbfs.com.qa Phibion Makuwerere, CFA Senior Research Analyst phibion.makuwerere@qnbfs.com.qa Roy Thomas Senior Research Analyst roy.thomas@qnbfs.com.qa Dana Saif Al Sowaidi Research Analyst dana.alsowaidi@qnbfs.com.qa Disclaimer and Copyright Notice: This publication has been prepared by QNB Financial Services Co. W.L.L. (“QNBFS”) a wholly-owned subsidiary of Qatar National Bank (Q.P.S.C.). QNB FS is regulated by the Qatar Financial Markets Authority and the Qatar Exchange. Qatar National Bank (Q.P.S.C.) is regulated by the Qatar Central Bank. This publication expresses the views and opinions of QNBFS at a given time only. It is not an offer, promotion or recommendation to buy or sell securities or other investments, nor is it intended to constitute legal, tax, accounting, or financial advice. QNBFS accepts no liability whatsoever for any direct or indirect losses arising from use of this report. Any investment decision should depend on the individual circumstances of the investor and be based on specifically engaged investment advice. We therefore strongly advise potential investors to seek independent professional advice before making any investment decision. Although the information in this report has been obtained from sources that QNBFS believes to be reliable, we have not independently verified such information and it may not be accurate or complete. QNBFS does not make any representations or warranties as to the accuracy and completeness of the information it may contain, and declines any liability in that respect. For reports dealing with Technical Analysis, expressed opinions and/or recommendations may be different or contrary to the opinions/recommendations of QNBFS Fundamental Research as a result of depending solely on the historical technical data (price and volume). QNBFS reserves the right to amend the views and opinions expressed in this publication at any time. It may also express viewpoints or make investment decisions that differ significantly from, or even contradict, the views and opinions included in this report. This report may not be reproduced in whole or in part without permission from QNBFS. COPYRIGHT: No part of this document may be reproduced without the explicit written permission of QNBFS. Page 7 of 7