QNBFS Weekly Market Report April 16, 2020
•
0 likes•208 views

The Qatar Stock Exchange (QSE) Index declined by 413.46 points, or 4.60% during the week, to close at 8,576.32

Recommended
Recommended
More Related Content
What's hot
What's hot (20)
Similar to QNBFS Weekly Market Report April 16, 2020
Similar to QNBFS Weekly Market Report April 16, 2020 (19)
More from QNB Group
More from QNB Group (20)
Recently uploaded
Recently uploaded (20)
QNBFS Weekly Market Report April 16, 2020
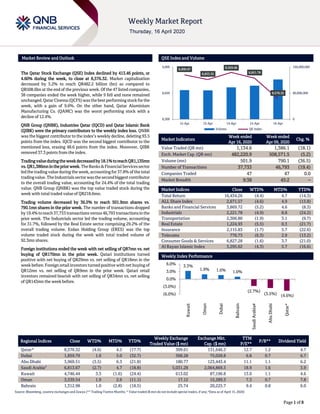
- 1. ```` Page 1 of 8 Market Review and Outlook QSE Index and Volume The Qatar Stock Exchange (QSE) Index declined by 413.46 points, or 4.60% during the week, to close at 8,576.32. Market capitalization decreased by 5.2% to reach QR482.2 billion (bn) as compared to QR508.6bn at the end of the previous week. Of the 47 listed companies, 38 companies ended the week higher, while 9 fell and none remained unchanged. QatarCinema (QCFS)was the best performingstockforthe week, with a gain of 9.6%. On the other hand, Qatar Aluminium Manufacturing Co. (QAMC) was the worst performing stock with a decline of 12.4%. QNB Group (QNBK), Industries Qatar (IQCD) and Qatar Islamic Bank (QIBK) were the primary contributors to the weekly index loss. QNBK was the biggest contributor to the index’s weekly decline, deleting 93.5 points from the index. IQCD was the second biggest contributor to the mentioned loss, erasing 48.6 points from the index. Moreover, QIBK removed 37.3 points from the index. Tradingvalueduringtheweekdecreasedby18.1%toreachQR1,135mn vs.QR1,386mn inthe priorweek.TheBanks&FinancialServicessector led the trading value during the week, accounting for 37.8% of the total tradingvalue.TheIndustrialssectorwasthesecondbiggestcontributor to the overall trading value, accounting for 24.4% of the total trading value. QNB Group (QNBK) was the top value traded stock during the week with total traded value of QR218.6mn. Trading volume decreased by 36.5% to reach 501.9mn shares vs. 790.1mn shares in the prior week. The number of transactions dropped by19.4%toreach37,733 transactionsversus46,793 transactionsinthe prior week. The Industrials sector led the trading volume, accounting for 31.7%, followed by the Real Estate sector comprising 29.2% of the overall trading volume. Ezdan Holding Group (ERES) was the top volume traded stock during the week with total traded volume of 92.3mn shares. Foreign institutions ended the week with net selling of QR7mn vs. net buying of QR170mn in the prior week. Qatari institutions turned positive with net buying of QR29mn vs. net selling of QR18mn in the week before. Foreign retail investors turned positive with net buying of QR12mn vs. net selling of QR9mn in the prior week. Qatari retail investors remained bearish with net selling of QR34mn vs. net selling of QR143mn the week before. Market Indicators Week ended Apr 16, 2020 Week ended Apr 09, 2020 Chg. % Value Traded (QR mn) 1,134.6 1,386.1 (18.1) Exch. Market Cap. (QR mn) 482,220.9 508,571.5 (5.2) Volume (mn) 501.9 790.1 (36.5) Number of Transactions 37,733 46,793 (19.4) Companies Traded 47 47 0.0 Market Breadth 9:38 45:2 – Market Indices Close WTD% MTD% YTD% Total Return 16,434.26 (4.4) 4.7 (14.3) ALL Share Index 2,671.57 (4.6) 4.9 (13.8) Banks and Financial Services 3,869.72 (5.2) 4.6 (8.3) Industrials 2,221.78 (4.9) 8.8 (24.2) Transportation 2,306.80 (1.9) 3.1 (9.7) Real Estate 1,224.93 (5.5) 0.3 (21.7) Insurance 2,115.83 (1.7) 5.7 (22.6) Telecoms 776.73 (6.3) 2.9 (13.2) Consumer Goods & Services 6,827.28 (1.6) 3.7 (21.0) Al Rayan Islamic Index 3,295.62 (4.3) 5.7 (16.6) Market Indices Weekly Index Performance Regional Indices Close WTD% MTD% YTD% Weekly Exchange Traded Value ($ mn) Exchange Mkt. Cap. ($ mn) TTM P/E** P/B** Dividend Yield Qatar* 8,576.32 (4.6) 4.5 (17.7) 309.61 131,646.3 12.7 1.2 4.7 Dubai 1,859.79 1.6 5.0 (32.7) 368.28 75,028.8 6.8 0.7 6.7 Abu Dhabi 3,969.51 (3.5) 6.3 (21.8) 180.77 123,443.4 11.1 1.1 6.2 Saudi Arabia# 6,813.67 (2.7) 4.7 (18.8) 5,031.28 2,064,869.3 18.9 1.6 3.9 Kuwait 4,746.44 3.3 (1.6) (24.4) 613.02 87,196.8 13.0 1.1 4.6 Oman 3,539.54 1.9 2.6 (11.1) 17.12 15,289.3 7.3 0.7 7.8 Bahrain 1,312.98 1.0 (2.8) (18.5) 25.74 20,225.7 9.4 0.8 6.0 Source: Bloomberg, country exchanges and Zawya (** Trailing Twelve Months; * Value traded ($ mn) do not include special trades, if any; #Data as of April 15, 2020) 8,896.87 8,833.35 8,929.66 8,851.78 8,576.32 0 80,000,000 160,000,000 8,300 8,650 9,000 12-Apr 13-Apr 14-Apr 15-Apr 16-Apr Volume QE Index 3.3% 1.9% 1.6% 1.0% (2.7%) (3.5%) (4.6%)(6.0%) (3.0%) 0.0% 3.0% 6.0% Kuwait Oman Dubai Bahrain SaudiArabia# AbuDhabi Qatar*
- 2. Page 2 of 8 News Economic News / Market & Corporate News Moody’s affirms Qatar’s rating at ‘Aa3’ with a ‘Stable’ outlook – In its update last night, Moody’s Investor Service (Moody’s) said, “Qatar's credit profile reflects the government's strong balance sheet, vast hydrocarbon reserves and exceptionally high per capita income. These factors provide significant shock- absorption capacity and mitigate the vulnerability of government revenue to temporary declines in oil prices, such as the one caused by the coronavirus pandemic, as well as the economic and financial risks arising from Qatar's exposure to regional geopolitical tensions.” Moody’s added, “The ‘Stable’ outlook reflects our assessment that Qatar’s credit metrics are likely to remain consistent with the ‘Aa3’ rating, even as oil prices remain subdued due to depressed global oil demand caused by the coronavirus pandemic. The ‘Stable’ outlook balances fiscal and economic risks stemming from the decline in oil prices with Qatar's very large fiscal and foreign currency reserve buffers in the form of sovereign wealth fund assets.” On factors that could lead to an upgrade, Moody’s said, “A sustained and material reduction in external vulnerabilities through a decrease in external debt and a rebuilding of foreign exchange reserves would likely prompt an upgrade of the rating, especially if accompanied by greater transparency about the size and composition of the government’s financial assets.” On factors that could lead to a downgrade, Moody’s noted, “An escalation of regional tensions or a significantly longer than anticipated shock to hydrocarbon demand that would threaten to disrupt Qatar’s hydrocarbon exports on a prolonged basis, put material pressure on the government’s financial position, including through a crystallization of wider public-sector liabilities on the government’s balance sheet, and lead to a significant erosion of external buffers, would likely lead us to downgrade the rating.” An analyst said, “Given the current market conditions, this is a good rating as other markets in the region have been downgraded. Moody's affirmation of Qatar’s rating at ‘Aa3’ with a ‘Stable’ outlook reaffirms the country’s economic resilience.” Qatar is the world's leading exporter of liquefied natural gas (LNG), accounting for one-third of global LNG exports. At the current rate of production, its proven natural gas reserves would last for an estimated 130 years, Moody’s noted. (Gulf-Times.com) QNB Group reports stable net profits for the first quarter of 2020 – For the three months ended 31 March 2020, Net Profit reached QAR3.6 billion, in line with March 2019 profitability. Operating Income increased by 8% to QAR6.7 billion. This reflects QNB Group’s success in maintaining sustainable growth across a number of revenue segments. Thanks to QNB Group’s robust risk management practices, the first quarter results of QNB Group were not materially impacted by the sudden onset of the covid-19 pandemic. QNB Group has taken all the necessary actions to protect the well-being of its employees, customers and shareholders. In addition, the Group opted to build more loan loss provisions during the first quarter of 2020 as a precautionary measure. The Group’s drive for operational efficiency is yielding cost-savings and improved revenue that has helped QNB Group to improve efficiency (cost to income) ratio from 25.9% to 25.6%, which is considered one of the best ratios among large financial institutions in the MEA region. Total Assets reached QAR964 billion, an increase of 9% from 31 March 2019, mainly driven by strong growth in Loans and advances by 13% to reach QAR708 billion. Strong customer deposits generation helped to increase customer deposits by 11% to reach QAR706 billion from 31 March 2019. QNB’s robust asset liability management capabilities helped QNB Group to maintain its loans to deposits ratio at 100% as at 31 March 2020. The ratio of non-performing loans to gross loans amounted to 1.9% as at 31 March 2020, one of the lowest amongst financial institutions in the MEA region, reflecting the high quality of the Group’s loan book and the effective management of credit risk. Also during this quarter QNB Group increased its loan loss provisioning by QAR272 million, in light of the recent turmoil due to covid-19 pandemic and the associated issues arising from lockdown and slowdown in the key markets where QNB Group operates. Group Capital Adequacy Ratio (CAR) as at 31 March 2020 amounted to 18.4%, higher than the regulatory minimum requirements of the Qatar Central Bank and Basel Committee. QNB Group’s solid financial strength was supported by top tier credit ratings that continues to attract institutional, corporate and individual customers to bank with QNB, and for investors and markets to believe in the Group’s strong financial position and strategy. QNB remains the highest-rated bank in Qatar and one of the highest-rated banks in the world with ratings of Aa3 from Moody’s, A from S&P and A+ from Fitch. These ratings are a testament to our capital strength, governance, prudent risk management, business and operating model. This provides us with a competitive advantage to access global capital markets for wholesale funding and enables us to continue our growth and expansion plans in line with our strategy. During the first quarter of 2020, QNB Group issued a USD1.0 billion bond with a maturity of seven years under its Medium Note Programme (MTN) and another successful completion of a USD600 million Formosa bond issuance with a maturity of forty years, callable every five years, dual listed on the Taipei and London Stock Exchanges. The issuances were part of QNB Group’s ongoing strategy to ensure diversification of funding in terms of type, tenor and geography. These deals attracted strong interest around the world from key global investors, reflecting investors’ confidence in QNB Group’s financial strength and its position as the largest financial institution in the Middle East and Africa region. It also reflects their trust and confidence in QNB Group’s strategy over the coming years. Furthermore, during March 2020, QNB Group completed updating of its MTN programme to permit the issuances of Social and Green Bonds. Based on the Group’s continuous strong performance, driven by its strength and international footprint, QNB has been recognized as the most valuable banking brand in the MEA region by Brand Finance (2019), with its brand value increasing to USD6.03 billion to rise to 52nd place globally. QNB continued its outstanding achievements by topping the Middle East and Africa (MEA) region, in the Banker mag
- 3. Page 3 of 8 CBQK announces the sale of the bank's treasury shares – In accordance to the bank’s announcements relating to the Qatar Financial Market Authority’s (QFMA) approval to sell The Commercial Bank (CBQK) held treasury shares (65,335,250 shares), published on July 18, 2019, July 25, 2019, February 02, 2020 and March 3, 2020, CBQK confirmed that as at March 31, 2020, it has sold all of the held treasury shares. (QSE) QIBK posts 0.3% YoY increase but 18.2% QoQ decline in net profit in 1Q2020, below our estimate – Qatar Islamic Bank's (QIBK) net profit rose 0.3% YoY (but declined 18.2% on QoQ basis) to QR687.5mn in 1Q2020, below our estimate of QR721.4mn (variation of -4.7%). Total net income from financing and investing activities increased 3.1% YoY in 1Q2020 to QR1,727.5mn. However, on QoQ basis total net income from financing and investing activities declined 4.9%. The company's total income came in at QR1,944.2mn in 1Q2020, which represents an increase of 5.1% YoY. However, on QoQ basis total income fell 4.1%. The bank's total assets stood at QR166.1bn at the end of March 31, 2020, up 6.9% YoY (+1.5% QoQ). Financing assets were QR114.0bn, registering a rise of 7.2% YoY (+0.2% QoQ) at the end of March 31, 2020. Customers' current accounts rose 2.2% YoY and 3.1% QoQ to reach QR15.4bn at the end of March 31, 2020. The earnings per share remained flat YoY at QR0.29 in 1Q2020. Total expenses of QR271mn for the three months’ period ended March 31, 2020 with strict cost controls supporting higher operating revenues enabled further enhancement of efficiency and further decreased the cost to income ratio to 22.7% for the first quarter of 2020. QIBK was able to maintain the ratio of non-performing financing assets to total financing assets at 1.3% reflecting the quality of the bank’s financing assets portfolio. QIBK continues to pursue the conservative impairment provisioning policy with the coverage ratio for non-performing financing assets at 100% as of March 2020. QIBK’s efficient risk management framework have ensured that the results for the period ended March 31, 2020 have not been materially impacted by the events related to COVID-19. However, the bank prudently has taken total impairment charge of QR276mn representing an increment of QR74mn compared to same period in 2019. The bank continues to take necessary precautionary measures to ensure that its employees, customers and shareholders are safe and protected. Total Shareholders’ Equity of the bank has reached QR16.3bn. Total Capital adequacy of the bank under Basel III guidelines is 18.9% as of March 2020, higher than the minimum regulatory requirements prescribed by Qatar Central Bank and Basel Committee. In April 2020, Standard & Poor’s (S&P) affirmed the bank’s credit rating at ‘A-’ with a Stable outlook. In November 2019, Fitch Ratings affirmed Qatar Islamic Bank at 'A' with a Stable outlook. Also in December 2019, Moody's Investors Service has affirmed the Long-term deposit ratings of QIBK at “A1” with a Stable outlook. In May 2019, Capital Intelligence Ratings (CI) has affirmed the bank’s Long-term Currency Rating (LTCR) of ‘A+’ with a Stable outlook. (QNB FS Research, Company Press Release QSE) QFLS' net profit declines 30.8% YoY and 34.4% QoQ in 1Q2020, below our estimate – Qatar Fuel Company's (QFLS) net profit declined 30.8% YoY (-34.4% QoQ) to QR226.1mn in 1Q2020, below our estimate of QR270.5mn (variation of -16.4%). The company's revenues came in at QR4,978.6mn in 1Q2020, which represents a decrease of 2.4% YoY (-13.3% QoQ). EPS amounted to QR0.23 in 1Q2020 as compared to QR0.33 in 1Q2019. The decrease in net profits and earning per share for the period were partly attributed to the market slowdown prompted by the spread of COVID-19, and partly to supply and demand factors, where the completion of many projects that consume fuel had brought in a pro rata decrease in the overall fuel demand, the statement said. With regard to the company's operations, QFLS’ Managing Director and CEO, Saad Rashid Al-Muhannadi explained that the company's overall sales decreased by 6.0% compared to the same period last year because of the COVID-19 impact. Diesel and super gasoline sales decreased by 8.0% and 7.4%, respectively, while jet fuel volumes decreased by 6.4% driven by the reduced operations of Qatar Airways and partial operations of private airlines. Bitumen sales have decreased by 65.0% due to the market situation and the completion of consuming projects. On the other hand, Al-Muhannadi explained that premium gasoline sales increased by 0.9%, while retail non-fuel revenue and fuel retail sales increased by 5.8% and 3.5%, respectively compared to the same period last year due to the opening of new stations and higher footfall in C- stores. HFO off take increased by 39.5% driven by market demand, while LPG and natural gas sales were higher by 3.1% and 22.8%, respectively driven by market demand. Al- Muhannadi indicated that QFLS has been working closely with its partners and stakeholders to coordinate the implementation all the governmental directives issued in preventing the spread of COVID-19. At the same time, being the sole downstream oil and gas company responsible for securing a continuous and sustainable supply of petroleum products and gas to all sectors within the state of Qatar, QFLS has implemented a suitable, flexible, and resilient business continuity plan that could effectively secure a persistent nonstop countrywide distribution of these vital energy products. (QNB FS Research, QSE, Gulf-Time.com) QNCD posts 18.1% YoY decrease but 27.4% QoQ increase in net profit in 1Q2020 – Qatar National Cement Company's (QNCD) net profit declined 18.1% YoY (but rose 27.4% on QoQ basis) to QR54.4mn in 1Q2020.The company's sales came in at QR166.1mn in 1Q2020, which represents a decrease of 22.1% YoY. However, on QoQ basis Sales rose 0.9%. EPS amounted to QR0.08 in 1Q2020 as compared to QR0.10 in 1Q2019. The company will held its Investors Relation conference call on April 16, 2020 at 1:00 pm. (QSE) GISS restructuring, refinancing $1.3bn debt of fully owned subsidiary GDI – Gulf International Services (GISS) is in the process of restructuring and refinancing a total $1.3bn debt of its fully owned subsidiary – Gulf Drilling International (GDI) as part of the strategy to reduce the interest burden and drive fast along the growth path. The restructuring is part of strategies to ensure that the group maintains an optimum sustainable debt and capital level, along with streamlining the overall maturity profile, Qatar Petroleum, Manager (Privatized Companies Affair), Mohamed Jaber Al-Sulaiti told shareholders on Sunday at the Annual General Assembly meeting. Highlighting that the total debt subject to restructuring and refinancing will amount up to $1.3bn; he said under the new terms, the group would be optimizing its finance cost. “The refinancing exercise will allow the group to re-adjust its maturity profile for sustainable
- 4. Page 4 of 8 future,” he said, adding underpinned by management business plan, this new debt structure would allow for gradual deleveraging of the GISS' financial position. With the negotiated lower margins and in the current low-interest rate environment, the refinancing would not only assist the group in reducing interest cost, but also provide a more optimum and efficient debt structure with greater flexibility to drive forward its subsidiary’s growth plan and support in tapping any new business opportunities, according to him. “Going forward in 2020, we are currently assessing the business impacts of the current pandemic situation due to the spread of COVID-19, which would require us to revisit our cost structures, where work has already been started to review operating and capital expenditure,” Al-Sulaiti said. The expenditure review is aimed at reducing overall expenditures, and where possible at rationalizing costs and enhance cash reserves, which could positively affect the overall financial performance of the group, he said, noting that GDI was able to reduce QR35mn in direct costs and another QR23mn savings on general and administrative costs compared to last year. (Gulf-Times.com) Qatar Airways, Standard Chartered sign $850mn financing deal – Qatar Airways and Standard Chartered have successfully signed $850mn financing in respect of seven Boeing 787-9 aircraft. This transaction demonstrates the confidence that the banking market has in Qatar Airways and also highlights the strong relationship between Qatar Airways and Standard Chartered. Qatar Airways Group’s Chief Executive, HE Akbar Al-Baker said, “I am grateful to Standard Chartered for their continued support to Qatar Airways. The bank has been a close partner of Qatar Airways for many years and have proven their support for the airline by closing this transaction during difficult times resulting from COVID-19. Qatar Airways' focus remains on finding solutions to get as many people back to their homes to be with their families and loved ones during these difficult times and this is made possible by the support we have from so many people including our close partners such as Standard Chartered.” Standard Chartered’s Chief Executive, Bill Winters stated, “We value our partnership with Qatar Airways and are very pleased to close this landmark deal at this difficult time. At Standard Chartered, we continue to support our clients and communities despite the ongoing challenges with COVID-19 and are proud to have been able to provide Qatar Airways with this financing.” (Gulf-Times.com)
- 5. Page 5 of 8 Qatar Stock Exchange Top Gainers Top Decliners Source: Qatar Stock Exchange (QSE) Source: Qatar Stock Exchange (QSE) Most Active Shares by Value (QR Million) Most Active Shares by Volume (Million) Source: Qatar Stock Exchange (QSE) Source: Qatar Stock Exchange (QSE) Investor Trading Percentage to Total Value Traded Net Traded Value by Nationality (QR Million) Source: Qatar Stock Exchange (QSE) Source: Qatar Stock Exchange (QSE) 9.6% 5.3% 3.5% 3.2% 2.6% 0.0% 4.0% 8.0% 12.0% Qatar Cinema & Film Distribution Company Qatari German Company for Medical Devices Qatar Industrial Manufacturing Company Zad Holding Company Al Meera Consumer Goods Company -12.4% -11.6% -10.0% -8.2% -7.8% -15.0% -10.0% -5.0% 0.0% Qatar Aluminium Manufacturing Company Barwa Real Estate Company Mesaieed Petrochemical Holding Company Vodafone Qatar Dlala Brokerage & Investment Holding Company 218.6 104.2 103.7 70.7 68.8 0.0 80.0 160.0 240.0 QNB Group Mesaieed Petrochemical Holding Company Barwa Real Estate Company Masraf Al Rayan Qatar Fuel Company 92.3 52.6 42.7 38.3 34.4 0.0 40.0 80.0 120.0 Ezdan Holding Group Mesaieed Petrochemical Holding Company Qatar Aluminium Manufacturing Company Salam International Investment Limited Barwa Real Estate Company 0% 20% 40% 60% 80% 100% Buy Sell 29.72% 32.69% 22.32% 19.80% 13.33% 12.26% 34.63% 35.25% Qatari Individuals Qatari Institutions Non-Qatari Individuals Non-Qatari Institutions 590 544 596 539 -5 5 -200 0 200 400 600 800 Qatari Non-Qatari Net Investment Total Sold Total Bought
- 6. Page 6 of 8 TECHNICAL ANALYSIS OF THE QSE INDEX Source: Bloomberg The QSE Index gained ground and closed down by 4.6% from the week before; it closed at the 8,576.32 level. Last week, we expected that the market remains in a downtrend momentum and traders should be cautious. Our major support remains at the 8,000 level and the resistance is now at the 9,000 level. DEFINITIONS OF KEY TERMS USED IN TECHNICAL ANALYSIS RSI (Relative Strength Index) indicator – RSI is a momentum oscillator that measures the speedand change of price movements. The RSI oscillates between 0 to 100. The index is deemed to be overbought once the RSI approaches the 70 level, indicating that a correction is likely. On the other hand, if the RSI approaches 30, it is an indication that the index may be getting oversold and therefore likely to bounce back. MACD (Moving Average Convergence Divergence) indicator – The indicator consists of the MACD line and a signal line. The divergence or the convergence of the MACD line with the signal line indicates the strength in the momentum during the uptrend or downtrend, as the case may be. When the MACD crosses the signal line from below and trades above it, it gives a positive indication. The reverse is the situation for a bearish trend. Candlestick chart – A candlestick chart is a price chart that displays the high, low, open, and close for a security. The ‘body’ of the chart is portion between the open and close price, while the high and low intraday movements form the ‘shadow’. The candlestick may represent any time frame. We use a one-day candlestick chart (every candlestick represents one trading day) in our analysis. Doji candlestick pattern – A Doji candlestick is formed when a security's open and close are practically equal. The pattern indicates indecisiveness, and based on preceding price actions and future confirmation, may indicate a bullish or bearish trend reversal. ShootingStar/Inverted Hammer candlestick patterns – These candlestick patterns have a small real body (open price and close price are near to each other), and a long upper shadow (large intraday movement on the upside). The Shooting Star is a bearish reversal pattern that forms after a rally. The Inverted Hammer looks exactly like a Shooting Star, but forms after a downtrend. Inverted Hammers represent a potential bullish trend reversal.
- 7. Page 7 of 8 Source: Bloomberg Company Name Price April 16 % Change WTD % Change YTD Market Cap. QR Million TTM P/E P/B Div. Yield Qatar National Bank 17.70 (6.84) (14.04) 163,485 13.0 2.4 3.4 Qatar Islamic Bank 15.05 (2.90) (1.83) 35,562 12.6 2.2 3.5 Commercial Bank of Qatar 3.91 (6.68) (16.81) 15,825 9.0 0.9 5.1 Doha Bank 1.91 (2.60) (24.35) 5,934 10.8 0.6 N/A Al Ahli Bank 3.09 (1.44) (7.30) 7,508 11.1 1.3 4.6 Qatar International Islamic Bank 8.06 (3.76) (16.71) 12,203 13.9 2.0 5.3 Masraf Al Rayan 3.73 (2.33) (5.81) 27,975 12.8 2.0 6.0 Al Khaliji Bank 1.22 (2.86) (6.56) 4,406 7.4 0.7 6.1 Qatar First Bank 0.90 (1.10) 10.02 630 N/A 0.9 N/A National Leasing 0.61 (2.56) (13.48) 302 12.5 0.4 8.2 Dlala Holding 0.48 (7.75) (22.09) 135 N/A 0.7 N/A Qatar & Oman Investment 0.43 (0.69) (35.72) 135 15.7 0.4 4.7 Islamic Holding Group 1.36 (5.55) (28.37) 77 167.4 0.6 N/A Banking and Financial Services 274,178 Zad Holding 14.45 3.21 4.56 3,425 16.2 2.2 5.9 Qatar German Co. for Medical Devices 0.60 5.28 2.75 69 N/A 2.3 N/A Salam International Investment 0.26 (2.26) (49.90) 296 N/A 0.3 N/A Baladna 0.98 (2.50) (2.50) 1,853 N/A N/A N/A Medicare Group 6.07 (1.00) (28.18) 1,708 23.8 1.7 29.7 Qatar Cinema & Film Distribution 2.53 9.59 14.77 159 24.8 1.1 4.0 Qatar Fuel 16.69 (3.58) (27.12) 16,594 14.9 2.0 4.8 Qatar Meat and Livestock 5.19 0.27 (23.30) 933 9.5 2.7 N/A Mannai Corp. 3.10 (0.74) 0.65 1,414 7.0 0.5 6.5 Al Meera Consumer Goods 16.00 2.56 4.58 3,200 17.2 2.2 5.3 Consumer Goods and Services 29,652 Qatar Industrial Manufacturing 2.65 3.52 (25.77) 1,259 12.2 0.8 5.7 Qatar National Cement 3.34 (5.86) (40.87) 2,183 15.4 0.8 9.0 Industries Qatar 6.86 (5.50) (33.27) 41,503 16.1 1.2 5.8 Qatari Investors Group 1.29 (4.59) (28.04) 1,601 12.1 0.6 4.3 Qatar Electricity and Water 14.62 0.97 (9.14) 16,082 11.4 1.6 5.3 Aamal 0.53 (4.82) (34.44) 3,358 10.5 0.4 7.5 Gulf International Services 1.24 (0.96) (27.85) 2,306 51.9 0.6 N/A Mesaieed Petrochemical Holding 1.84 (10.00) (26.53) 23,166 19.5 1.5 3.8 Invesment Holding Group 0.39 (3.68) (30.32) 326 5.9 0.4 N/A Qatar Aluminum Manufacturing 0.60 (12.41) (23.18) 3,348 N/A 0.6 1.7 Industrials 95,134 Qatar Insurance 2.20 (2.18) (30.35) 7,189 13.0 0.9 6.8 Doha Insurance 1.06 (2.04) (11.92) 529 10.8 0.5 7.6 Qatar General Insurance & Reinsurance 2.02 (1.22) (17.97) 1,766 N/A 0.4 5.0 Al Khaleej Takaful Insurance 1.60 1.27 (20.00) 408 13.7 0.8 3.1 Qatar Islamic Insurance 6.05 (5.45) (9.45) 907 12.4 2.4 6.2 Insurance 10,799 United Development 0.99 (6.00) (35.07) 3,495 9.7 0.3 5.1 Barw a Real Estate 2.82 (11.60) (20.34) 10,973 7.7 0.6 7.1 Ezdan Real Estate 0.53 (3.82) (13.98) 14,032 83.2 0.4 N/A Mazaya Qatar Real Estate Development 0.54 (4.12) (25.59) 619 62.4 0.5 N/A Real Estate 29,119 Ooredoo 6.00 (5.81) (15.25) 19,219 11.2 0.8 4.2 Vodafone Qatar 0.91 (8.17) (21.55) 3,847 27.0 0.9 5.5 Telecoms 23,066 Qatar Navigation (Milaha) 4.90 (1.80) (19.67) 5,612 10.9 0.4 6.1 Gulf Warehousing 4.69 0.92 (14.36) 275 11.0 1.5 4.3 Qatar Gas Transport (Nakilat) 2.15 (2.49) (10.04) 11,912 11.9 1.7 4.7 Transportation 17,798 Qatar Exchange 482,221
- 8. Contacts Saugata Sarkar, CFA, CAIA Shahan Keushgerian Zaid al-Nafoosi , CMT, CFTe Head of Research Senior Research Analyst Senior Research Analyst Tel: (+974) 4476 6534 Tel: (+974) 4476 6509 Tel: (+974) 4476 6535 saugata.sarkar@qnbfs.com.qa shahan.keushgerian@qnbfs.com.qa zaid.alnafoosi@qnbfs.com.qa Mehmet Aksoy, PhD QNB Financial Services Co. W.L.L. Senior Research Analyst Contact Center: (+974) 4476 6666 Tel: (+974) 4476 6589 PO Box 24025 mehmet.aksoy@qnbfs.com.qa Doha, Qatar Disclaimer and Copyright Notice: This publication has been prepared by QNB Financial Services Co. W.L.L. (“QNB FS”) a wholly-owned subsidiary of Qatar National Bank (Q.P.S.C.). QNB FS is regulated by the Qatar Financial Markets Authority and the Qatar Exchange. Qatar National Bank (Q.P.S.C.) is regulated by the Qatar Central Bank. This publication expresses the views and opinions of QNB FS at a given time only. It is not an offer, promotion or recommendation to buy or sell securities or other investments, nor is it intended to constitute legal, tax, accounting, or financial advice. QNB FS accepts no liability whatsoever for any direct or indirect losses arising from use of this report. Any investment decision should depend on the individual circumstances of the investor and be based on specifically engaged investment advice. We therefore strongly advise potential investors to seek independent professional advice before making any investment decision. Although the information in this report has been obtained from sources that QNB FS believes to be reliable, we have not independently verified such information and it may not be accurate or complete. QNB FS does not make any representations or warranties as to the accuracy and completeness of the information it may contain, and declines any liability in that respect. For reports dealing with Technical Analysis, expressed opinions and/or recommendations may be different or contrary to the opinions/recommendations of QNB FS Fundamental Research as a result of depending solely on the historical technical data (price and volume). QNB FS reserves the right to amend the views and opinions expressed in this publication at any time. It may also express viewpoints or make investment decisions that differ significantly from, or even contradict, the views and opinions included in this report. This report may not be reproduced in whole or in part without permission from QNB FS COPYRIGHT: No part of this document may be reproduced without the explicit written permission of QNB FS. Page 8 of 8