QNBFS Weekly Market Report October 21, 2021
•
0 likes•129 views

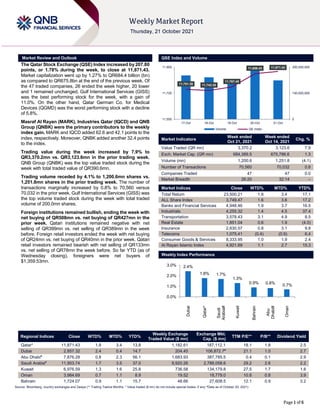
The Qatar Stock Exchange (QSE) Index increased by 207.80 points, or 1.78% during the week, to close at 11,871.43.

Recommended
Recommended
More Related Content
What's hot
What's hot (20)
Similar to QNBFS Weekly Market Report October 21, 2021
Similar to QNBFS Weekly Market Report October 21, 2021 (20)
More from QNB Group
More from QNB Group (20)
Recently uploaded
Recently uploaded (20)
QNBFS Weekly Market Report October 21, 2021
- 1. ``````` Page 1 of 6 Market Review and Outlook QSE Index and Volume The Qatar Stock Exchange (QSE) Index increased by 207.80 points, or 1.78% during the week, to close at 11,871.43. Market capitalization went up by 1.27% to QR684.4 billion (bn) as compared to QR675.8bn at the end of the previous week. Of the 47 traded companies, 26 ended the week higher, 20 lower and 1 remained unchanged. Gulf International Services (GISS) was the best performing stock for the week, with a gain of 11.0%. On the other hand, Qatar German Co. for Medical Devices (QGMD) was the worst performing stock with a decline of 5.8%. Masraf Al Rayan (MARK), Industries Qatar (IQCD) and QNB Group (QNBK) were the primary contributors to the weekly index gain. MARK and IQCD added 62.6 and 42.1 points to the index, respectively. Moreover, QNBK added another 32.4 points to the index. Trading value during the week increased by 7.9% to QR3,370.2mn vs. QR3,123.6mn in the prior trading week. QNB Group (QNBK) was the top value traded stock during the week with total traded value of QR390.6mn. Trading volume receded by 4.1% to 1,200.6mn shares vs. 1,251.8mn shares in the prior trading week. The number of transactions marginally increased by 0.8% to 70,560 versus 70,032 in the prior week. Gulf International Services (GISS) was the top volume traded stock during the week with total traded volume of 200.0mn shares. Foreign institutions remained bullish, ending the week with net buying of QR508mn vs. net buying of QR427mn in the prior week. Qatari institutions remained negative with net selling of QR399mn vs. net selling of QR389mn in the week before. Foreign retail investors ended the week with net buying of QR24mn vs. net buying of QR40mn in the prior week. Qatari retail investors remained bearish with net selling of QR133mn vs. net selling of QR78mn the week before. So far YTD (as of Wednesday closing), foreigners were net buyers of $1,359.53mn. Market Indicators Week ended Oct 21, 2021 Week ended Oct 14, 2021 Chg. % Value Traded (QR mn) 3,370.2 3,123.6 7.9 Exch. Market Cap. (QR mn) 684,389.5 675,786.6 1.3 Volume (mn) 1,200.6 1,251.8 (4.1) Number of Transactions 70,560 70,032 0.8 Companies Traded 47 47 0.0 Market Breadth 26:20 32:14 – Market Indices Close WTD% MTD% YTD% Total Return 23,500.21 1.8 3.4 17.1 ALL Share Index 3,749.47 1.6 3.6 17.2 Banks and Financial Services 4,948.46 1.9 3.7 16.5 Industrials 4,255.32 1.4 4.5 37.4 Transportation 3,578.43 3.1 4.9 8.5 Real Estate 1,851.04 0.6 1.9 (4.0) Insurance 2,630.57 0.8 3.1 9.8 Telecoms 1,075.41 (0.4) (0.9) 6.4 Consumer Goods & Services 8,333.95 1.0 1.9 2.4 Al Rayan Islamic Index 4,921.69 1.1 2.7 15.3 Weekly Index Performance Regional Indices Close WTD% MTD% YTD% Weekly Exchange Traded Value ($ mn) Exchange Mkt. Cap. ($ mn) TTM P/E** P/B** Dividend Yield Qatar* 11,871.43 1.8 3.4 13.8 1,182.61 187,112.1 18.1 1.8 2.5 Dubai 2,857.32 2.4 0.4 14.7 204.45 106,872.7# 21.1 1.0 2.7 Abu Dhabi# 7,876.28 0.8 2.3 56.1 1,683.93 387,785.5 0.4 0.1 2.9 Saudi Arabia# 11,903.74 1.7 3.5 37.0 9,920.26 2,788,058.6 29.2 2.6 2.2 Kuwait 6,976.59 1.3 1.6 25.8 736.58 134,179.8 27.5 1.7 1.8 Oman 3,984.69 0.7 1.1 8.9 19.52 18,779.0 10.8 0.8 3.9 Bahrain 1,724.07 0.9 1.1 15.7 48.66 27,608.5 12.1 0.9 3.2 Source: Bloomberg, country exchanges and Zawya (** Trailing Twelve Months; * Value traded ($ mn) do not include special trades, if any; #Data as of October 20, 2021) 11,751.38 11,743.35 11,767.45 11,856.43 11,871.43 0 150,000,000 300,000,000 11,550 11,725 11,900 17-Oct 18-Oct 19-Oct 20-Oct 21-Oct Volume QE Index 2.4% 1.8% 1.7% 1.3% 0.9% 0.8% 0.7% 0.0% 1.0% 2.0% 3.0% Dubai Qatar* Saudi Arabia# Kuwait Bahrain Abu Dhabi# Oman
- 2. Page 2 of 6 Economic, Market & Company News QIBK's bottom line rises 17.7% YoY and 10.0% QoQ in 3Q2021, above our estimate – Qatar Islamic Bank's (QIBK) net profit rose 17.7% YoY (+10.0% QoQ) to QR929.9mn in 3Q2021, above our estimate of QR849.4mn (variation of +9.5%). Total net income from financing and investing activities decreased 1.1% YoY in 3Q2021 to QR1,786.9mn. However, on QoQ basis total net income from financing and investing activities rose marginally (+0.1%). The company's total income came in at QR2,011.7mn in 3Q2021, which represents an increase of 1.1% YoY. However, on QoQ basis total income fell marginally. The bank's total assets stood at QR186.0bn at the end of September 30, 2021, up 9.4% YoY (+1.2% QoQ). Financing assets were QR127.1bn, registering a rise of 12.3% YoY (flat QoQ) at the end of September 30, 2021. Customers' current accounts rose 8.8% YoY to reach QR17.5bn at the end of September 30, 2021. However, on QoQ basis customers' current accounts fell 2.2%. EPS amounted to QR0.39 in 3Q2021 as compared to QR0.36 in 2Q2021 and QR0.33 in 3Q2020. QIBK’s customer deposits now stand at QR129bn, higher by 9% compared to December and a growth of 15% compared to September 2020. QIBK has been able to bring down the “finance to deposit” ratio to 99% compared to 101% at the end of December 2020. Total income for the nine months’ period that ended in September this year was QR6.12bn compared to QR5.96bn for the same period in 2020 registering a growth of 2.7%. Income from financing and investing activities was QR5.33bn, marginally below same period last year on account of lower market interest rates. Total operating expenses for the nine months’ period that ended in September decreased to QR797mn from QR822mn for the same period in 2020. Strict cost controls supported by higher operating revenues enabled further enhancement of efficiencies with cost to income ratio improving from 20.5% to 17.5% for the nine months period that ended in September, the “best” in the Qatari banking sector. QIBK was able to maintain the ratio of non-performing financing assets to total financing assets at 1.4% reflecting the quality of the Bank’s financing assets portfolio. The bank continued to create additional precautionary impairment charge on financing assets of QR1.19bn for the nine months’ period that ended in September compared to QR961mn set aside during the same period last year. In line with the bank’s conservative impairment policy the coverage ratio for non-performing financing assets as of September 2021 was improved to 95% compared to 92.3% as at December 2020. Total shareholders’ equity reached QR19.9bn, up 8.9% compared to December and higher by 12.8% compared to September 2020. Total capital adequacy of the Bank under Basel III guidelines is 18% as of September, higher than the minimum regulatory requirements prescribed by Qatar Central Bank and Basel Committee. (QNB FS Research, QSE, Gulf-Times.com) MARK posts 1.5% YoY decrease but 0.2% QoQ increase in net profit in 3Q2021, in-line with our estimate – Masraf Al Rayan's (MARK) net profit declined 1.5% YoY (but rose 0.2% on QoQ basis) to QR570.0mn in 3Q2021, in-line with our estimate of QR588.6mn (variation of -3.2%). Total net income from financing and investing activities decreased 5.6% YoY and 4.7% QoQ in 3Q2021 to QR1,075.5mn. The company's total income came in at QR1,201.8mn in 3Q2021, which represents a decrease of 3.5% YoY (-4.9% QoQ). The bank's total assets stood at QR124.8bn at the end of September 30, 2021, up 7.1% YoY. However, on QoQ basis the bank's total assets decreased 0.2%. Financing assets were QR87.0bn, registering a rise of 7.7% YoY at the end of September 30, 2021. However, on QoQ basis Financing assets decreased 4.6%. Customer current accounts declined 2.9% YoY to reach QR8.6bn at the end of September 30, 2021. However, on QoQ basis customer current accounts rose 3.0%. EPS amounted to QR0.08 in 3Q2021 as compared to QR0.08 in 2Q2021. MARK registered a net profit of QR1.71bn for the nine month period that ended in September, a growth of 3.1% compared to the same period last year. Total shareholders' equity reached QR14,834mn in September compared to QR13,889mn in the same period last year, an increase of 6.8%. Commenting on the results, Chairman and Managing Director, HE Ali bin Ahmed Al-Kuwari said, “We are pleased to see Masraf Al Rayan maintain its performance, and continue to grow steadily and strongly, promising good results towards the end of the year, despite the circumstances facing the world as a whole, foremost of which are the negative consequences imposed by the spread of the Covid-19 pandemic, without forgetting in return the other positive factors which had a good impact on the financial markets, the most important of which is the presence of a strong and growing economy supported by a noticeable rise in energy prices. “The announcement of these good results comes along with the success of the Extraordinary General Assembly meeting of Masraf Al Rayan and the approval of the shareholders on the merger between Masraf Al Rayan and Al Khalij Commercial Bank, aimed at achieving the main objective of the merger, which is to reach a larger financial institution with a strong financial position and great liquidity that will continue to support the added value for our valued shareholders. On the other hand, the merger’s integration adviser and the work team assigned by the two banks are working on completing the process of technical integration between the two banks, as well as obtaining other regulatory approvals necessary to complete the merger process successfully.” (QNB FS Research, QSE, Gulf-Times.com) QGTS's bottom line rises 5.0% YoY and 16.7% QoQ in 3Q2021, above our estimate – Qatar Gas Transport Company Limited's (QGTS, Nakilat) net profit rose 5.0% YoY (+16.7% QoQ) to QR367.7mn in 3Q2021, above our estimate of QR337.3mn (variation of +9.0%). The company's total income came in at QR1,054.9mn in 3Q2021, which represents an increase of 1.0% YoY (+4.6% QoQ). EPS amounted to QR0.18 in 9M2021 as compared to QR0.16 in 9M2020. Nakilat reported a net profit of QR1bn in 9M2021, an 11.5% YoY increase compared to the net profit of QR900mn reported during the same period in 2020. The key financial highlights from the third quarter of 2021 include: Revenue of QR3.071bn, increased by 0.2%; general and administrative expenses decreased by 4.8%; and operating expenses decreased by 0.9%. The shipping and maritime company’s solid earnings results are primarily attributed to the implementation of the company’s strategic initiatives across all levels, driven by the company’s growth strategy and cost optimization. The close alignment with Qatar National Vision 2030, which aims to create a sustainable future for the country, is championed by the Board of Directors. Nakilat has been diversifying its portfolio and expanding international outreach in response to the greater global demand for clean energy. The company is continuously expanding its shipping management capabilities with the latest addition of technologically advanced LNG carrier newbuilds, a key factor in its success and testament to an unwavering commitment to excellence. In 2021, Nakilat’s fleet has stands at 74 vessels, just under 12% of the current global LNG fleet, bearing testament to the company’s strong shipping management capabilities. (QNB FS Research, QSE, Peninsula Qatar)
- 3. Page 3 of 6 Qatar Stock Exchange Top Gainers Top Decliners Source: Qatar Stock Exchange (QSE) Source: Qatar Stock Exchange (QSE) Most Active Shares by Value (QR Million) Most Active Shares by Volume (Million) Source: Qatar Stock Exchange (QSE) Source: Qatar Stock Exchange (QSE) Investor Trading Percentage to Total Value Traded Net Traded Value by Nationality (QR Million) Source: Qatar Stock Exchange (QSE) Source: Qatar Stock Exchange (QSE) 11.0% 9.6% 8.8% 5.3% 5.3% 0.0% 4.0% 8.0% 12.0% Gulf International Services Mannai Corporation QLM Life & Medical Insurance Company Qatar Gas Transport Company Limited Masraf Al Rayan -5.8% -5.1% -3.4% -3.2% -3.2% -7.5% -5.0% -2.5% 0.0% Qatari German Company for Medical Devices Mazaya Qatar Real Estate Development Qatar Aluminium Manufacturing Company Alijarah Holding Ezdan Holding Group 390.6 373.8 217.9 216.6 204.4 0.0 150.0 300.0 450.0 QNB Group Gulf International Services Masraf Al Rayan Qatar Aluminium Manufacturing Company Industries Qatar 200.0 136.6 107.6 63.9 63.8 0.0 80.0 160.0 240.0 Gulf International Services Salam International Investment Limited Qatar Aluminium Manufacturing Company Mesaieed Petrochemical Holding Company Investment Holding Group 0% 20% 40% 60% 80% 100% Buy Sell 41.75% 45.71% 20.97% 32.82% 14.37% 13.65% 22.90% 7.83% Qatari Individuals Qatari Institutions Non-Qatari Individuals Non-Qatari Institutions 2,114 1,256 2,647 724 -533 533 -1,000 0 1,000 2,000 3,000 Qatari Non-Qatari Net Investment Total Sold Total Bought
- 4. Page 4 of 6 TECHNICAL ANALYSIS OF THE QSE INDEX Source: Bloomberg The QE Index closed higher by 1.78%, versus the week before; it printed last at the 11,871.43 level. We remain bullish as the major trend remains up and current market trajectory seems to be positive. Moreover, the General Index remained at its five-year-high levels; further uptick is expected. That been said, this recent rally could induce a correction, which may be used for accumulation. Our expected resistance levels remains around the 11,900 – 12,000 points and the support at 11,000 points. DEFINITIONS OF KEY TERMS USED IN TECHNICAL ANALYSIS RSI (Relative Strength Index) indicator – RSI is a momentum oscillator that measures the speed and change of price movements. The RSI oscillates between 0 to 100. The index is deemed to be overbought once the RSI approaches the 70 level, indicating that a correction is likely. On the other hand, if the RSI approaches 30, it is an indication that the index may be getting oversold and therefore likely to bounce back. MACD (Moving Average Convergence Divergence) indicator – The indicator consists of the MACD line and a signal line. The divergence or the convergence of the MACD line with the signal line indicates the strength in the momentum during the uptrend or downtrend, as the case may be. When the MACD crosses the signal line from below and trades above it, it gives a positive indication. The reverse is the situation for a bearish trend. Candlestick chart – A candlestick chart is a price chart that displays the high, low, open, and close for a security. The ‘body’ of the chart is portion between the open and close price, while the high and low intraday movements form the ‘shadow’. The candlestick may represent any time frame. We use a one-day candlestick chart (every candlestick represents one trading day) in our analysis. Doji candlestick pattern – A Doji candlestick is formed when a security's open and close are practically equal. The pattern indicates indecisiveness, and based on preceding price actions and future confirmation, may indicate a bullish or bearish trend reversal. Shooting Star/Inverted Hammer candlestick patterns – These candlestick patterns have a small real body (open price and close price are near to each other), and a long upper shadow (large intraday movement on the upside). The Shooting Star is a bearish reversal pattern that forms after a rally. The Inverted Hammer looks exactly like a Shooting Star, but forms after a downtrend. Inverted Hammers represent a potential bullish trend reversal.
- 5. Page 5 of 6 Source: Bloomberg Company Name Price October 21 % Change WTD % Change YTD Market Cap. QR Million TTM P/E P/B Div. Yield Qatar National Bank 20.20 1.81 13.29 186,576 15.8 2.3 2.2 Qatar Islamic Bank 18.27 1.00 6.78 43,171 13.6 2.2 2.2 Commercial Bank of Qatar 6.15 1.13 39.75 24,887 16.6 1.4 1.6 Doha Bank 2.97 1.40 25.52 9,211 14.7 0.9 2.5 Al Ahli Bank 3.90 (0.03) 13.14 9,476 13.5 1.5 3.8 Qatar International Islamic Bank 9.74 0.90 7.60 14,743 17.1 2.4 3.3 Masraf Al Rayan 4.82 5.33 6.49 36,180 16.2 2.4 3.5 Al Khaliji Bank 2.24 0.00 21.87 8,064 12.9 1.2 2.5 Qatar First Bank 1.83 (0.54) 6.33 1,281 18.5 2.5 N/A National Leasing 1.05 (3.22) (15.37) 521 20.9 0.8 2.4 Dlala Holding 1.55 0.26 (13.59) 441 29.8 2.0 N/A Qatar & Oman Investment 0.97 0.52 9.47 306 31.0 1.0 N/A Islamic Holding Group 4.97 (1.99) (2.93) 281 40.4 2.0 1.0 Banking and Financial Services 335,137 Zad Holding 16.00 1.91 18.04 4,171 21.5 2.9 4.0 Qatar German Co. for Medical Devices 3.50 (5.82) 56.33 404 132.5 12.2 N/A Salam International Investment 0.96 (1.84) 47.47 1,097 N/A 0.7 N/A Baladna 1.62 (1.64) (9.50) 3,080 N/A 1.4 3.3 Medicare Group 8.72 3.36 (1.31) 2,455 27.2 2.4 20.6 Qatar Cinema & Film Distribution 3.63 (0.55) (9.09) 228 61.1 1.7 2.8 Qatar Fuel 18.20 1.11 (2.57) 18,095 17.8 2.1 2.5 Qatar Meat and Livestock 4.14 (0.53) (34.53) 745 N/A 2.3 2.4 Mannai Corp. 5.04 9.57 68.00 2,299 6.9 1.1 0.2 Al Meera Consumer Goods 19.78 0.92 (4.49) 3,956 21.3 2.7 4.6 Consumer Goods and Services 36,531 Qatar Industrial Manufacturing 3.15 (0.03) (1.81) 1,497 13.9 0.9 3.2 Qatar National Cement 5.05 (0.51) 21.69 3,300 14.0 1.1 4.0 Industries Qatar 16.16 2.34 48.67 97,768 19.5 2.8 2.0 Qatari Investors Group 2.55 (2.79) 40.59 3,165 23.0 1.1 2.4 Qatar Electricity and Water 16.89 0.12 (5.38) 18,579 14.4 1.8 3.7 Aamal 1.05 2.85 22.46 6,596 28.2 0.9 3.8 Gulf International Services 1.92 10.95 11.66 3,559 N/A 1.1 N/A Mesaieed Petrochemical Holding 2.40 (0.41) 17.24 30,152 23.1 1.9 1.7 Invesment Holding Group 1.46 0.62 143.74 1,212 57.6 1.4 N/A Qatar Aluminum Manufacturing 1.98 (3.37) 104.86 11,054 30.1 1.9 1.8 Industrials 176,883 Qatar Insurance 2.48 (0.80) 5.12 8,110 19.5 1.0 N/A QLM Life & Medical Insurance 5.24 8.81 #N/A N/A 1,834 N/A 3.2 N/A Doha Insurance 1.93 0.00 38.29 963 13.7 0.8 5.2 Qatar General Insurance & Reinsurance 2.08 3.23 (21.80) 1,820 10.6 0.4 N/A Al Khaleej Takaful Insurance 4.60 0.68 142.36 1,174 25.5 2.4 1.1 Qatar Islamic Insurance 7.96 1.92 15.29 1,193 15.9 3.1 4.1 Insurance 15,094 United Development 1.60 3.56 (3.20) 5,672 19.8 0.5 3.1 Barw a Real Estate 3.19 0.47 (6.29) 12,401 10.1 0.6 3.9 Ezdan Real Estate 1.56 (3.17) (12.16) 41,379 115.1 1.3 N/A Mazaya Qatar Real Estate Development 1.05 (5.13) (16.55) 1,220 39.7 1.0 2.8 Real Estate 60,673 Ooredoo 7.20 (0.54) (4.24) 23,066 N/A 1.1 3.5 Vodafone Qatar 1.66 (0.12) 24.05 7,021 27.0 1.6 3.0 Telecoms 30,087 Qatar Navigation (Milaha) 7.58 0.65 6.84 8,679 44.1 0.6 4.0 Gulf Warehousing 5.06 (0.63) (0.84) 296 12.9 1.5 2.0 Qatar Gas Transport (Nakilat) 3.31 5.35 4.12 18,344 14.4 2.2 3.3 Transportation 27,319 Qatar Exchange 684,389
- 6. Contacts QNB Financial Services Co. W.L.L. Contact Center: (+974) 4476 6666 info@qnbfs.com.qa Doha, Qatar Saugata Sarkar, CFA, CAIA Shahan Keushgerian Head of Research Senior Research Analyst saugata.sarkar@qnbfs.com.qa shahan.keushgerian@qnbfs.com.qa Disclaimer and Copyright Notice: This publication has been prepared by QNB Financial Services Co. W.L.L. (“QNBFS”) a wholly-owned subsidiary of Qatar National Bank (Q.P.S.C.). QNB FS is regulated by the Qatar Financial Markets Authority and the Qatar Exchange. Qatar National Bank (Q.P.S.C.) is regulated by the Qatar Central Bank. This publication expresses the views and opinions of QNBFS at a given time only. It is not an offer, promotion or recommendation to buy or sell securities or other investments, nor is it intended to constitute legal, tax, accounting, or financial advice. QNBFS accepts no liability whatsoever for any direct or indirect losses arising from use of this report. Any investment decision should depend on the individual circumstances of the investor and be based on specifically engaged investment advice. We therefore strongly advise potential investors to seek independent professional advice before making any investment decision. Although the information in this report has been obtained from sources that QNBFS believes to be reliable, we have not independently verified such information and it may not be accurate or complete. QNBFS does not make any representations or warranties as to the accuracy and completeness of the information it may contain, and declines any liability in that respect. For reports dealing with Technical Analysis, expressed opinions and/or recommendations may be different or contrary to the opinions/recommendations of QNBFS Fundamental Research as a result of depending solely on the historical technical data (price and volume). QNBFS reserves the right to amend the views and opinions expressed in this publication at any time. It may also express viewpoints or make investment decisions that differ significantly from, or even contradict, the views and opinions included in this report. This report may not be reproduced in whole or in part without permission from QNBFS. COPYRIGHT: No part of this document may be reproduced without the explicit written permission of QNBFS. Page 6 of 6