

Recommended
More Related Content
What's hot
What's hot (20)
Viewers also liked
Viewers also liked (20)
Similar to Weekly market report
Similar to Weekly market report (20)
More from QNB Group
More from QNB Group (20)
Recently uploaded
Recently uploaded (20)
Weekly market report
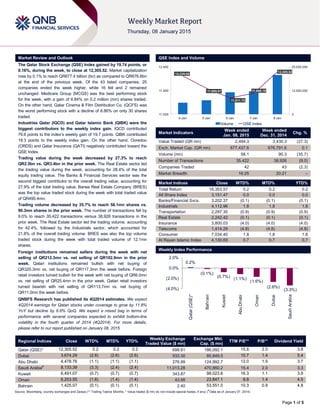
- 1. Page 1 of 5 Market Review and Outlook QSE Index and Volume The Qatar Stock Exchange (QSE) Index gained by 19.74 points, or 0.16%, during the week, to close at 12,305.52. Market capitalization rose by 0.1% to reach QR677.4 billion (bn) as compared to QR676.8bn at the end of the previous week. Of the 43 listed companies, 25 companies ended the week higher, while 16 fell and 2 remained unchanged. Medicare Group (MCGS) was the best performing stock for the week, with a gain of 6.84% on 0.2 million (mn) shares traded. On the other hand, Qatar Cinema & Film Distribution Co. (QCFS) was the worst performing stock with a decline of 8.86% on only 30 shares traded. Industries Qatar (IQCD) and Qatar Islamic Bank (QIBK) were the biggest contributors to the weekly index gain. IQCD contributed 79.6 points to the index’s weekly gain of 19.7 points. QIBK contributed 18.3 points to the weekly index gain. On the other hand, Ooredoo (ORDS) and Qatar Insurance (QATI) negatively contributed toward the QSE Index. Trading value during the week decreased by 27.3% to reach QR2.5bn vs. QR3.4bn in the prior week. The Real Estate sector led the trading value during the week, accounting for 28.4% of the total equity trading value. The Banks & Financial Services sector was the second biggest contributor to the overall trading value, accounting for 27.9% of the total trading value. Barwa Real Estate Company (BRES) was the top value traded stock during the week with total traded value of QR495.4mn. Trading volume decreased by 35.7% to reach 58.1mn shares vs. 90.3mn shares in the prior week. The number of transactions fell by 9.0% to reach 35,422 transactions versus 38,926 transactions in the prior week. The Real Estate sector led the trading volume, accounting for 42.4%, followed by the Industrials sector, which accounted for 21.8% of the overall trading volume. BRES was also the top volume traded stock during the week with total traded volume of 12.1mn shares. Foreign institutions remained sellers during the week with net selling of QR212.3mn vs. net selling of QR102.9mn in the prior week. Qatari institutions remained bullish with net buying of QR320.3mn vs. net buying of QR117.3mn the week before. Foreign retail investors turned bullish for the week with net buying of QR6.0mn vs. net selling of QR25.4mn in the prior week. Qatari retail investors turned bearish with net selling of QR113.7mn vs. net buying of QR11.0mn the week before. QNBFS Research has published its 4Q2014 estimates. We expect 4Q2014 earnings for Qatari stocks under coverage to grow by 11.8% YoY but decline by 6.6% QoQ. We expect a mixed bag in terms of performance with several companies expected to exhibit bottom-line volatility in the fourth quarter of 2014 (4Q2014). For more details, please refer to our report published on January 08, 2015. Market Indicators Week ended Jan. 08, 2015 Week ended Dec. 31, 2014 Chg. % Value Traded (QR mn) 2,494.3 3,430.3 (27.3) Exch. Market Cap. (QR mn) 677,437.6 676,791.6 0.1 Volume (mn) 58.1 90.3 (35.7) Number of Transactions 35,422 38,926 (9.0) Companies Traded 42 43 (2.3) Market Breadth 16:25 20:21 – Market Indices Close WTD% MTD% YTD% Total Return 18,353.57 0.2 0.2 0.2 All Share Index 3,151.47 0.0 0.0 0.0 Banks/Financial Svcs. 3,202.37 (0.1) (0.1) (0.1) Industrials 4,112.96 1.8 1.8 1.8 Transportation 2,297.30 (0.9) (0.9) (0.9) Real Estate 2,242.42 (0.1) (0.1) (0.1) Insurance 3,800.03 (4.0) (4.0) (4.0) Telecoms 1,414.29 (4.8) (4.8) (4.8) Consumer 7,034.40 1.8 1.8 1.8 Al Rayan Islamic Index 4,130.69 0.7 0.7 0.7 Market Indices Weekly Index Performance Regional Indices Close WTD% MTD% YTD% Weekly Exchange Traded Value ($ mn) Exchange Mkt. Cap. ($ mn) TTM P/E** P/B** Dividend Yield Qatar (QSE)* 12,305.52 0.2 0.2 0.2 698.81 186,092.1 15.8 2.0 3.8 Dubai 3,674.29 (2.6) (2.6) (2.6) 933.30 85,849.5 10.7 1.4 5.4 Abu Dhabi 4,478.76 (1.1) (1.1) (1.1) 276.99 124,992.7 12.0 1.5 3.7 Saudi Arabia# 8,133.39 (3.3) (2.4) (2.4) 11,013.28 470,860.2 15.4 2.0 3.3 Kuwait 6,491.07 (0.7) (0.7) (0.7) 343.87 98,023.6 16.3 1.1 3.9 Oman 6,253.55 (1.6) (1.4) (1.4) 43.98 23,847.1 8.8 1.4 4.5 Bahrain 1,425.07 (0.1) (0.1) (0.1) 2.40 53,551.0 10.3 0.9 4.8 Source: Bloomberg, country exchanges and Zawya (** Trailing Twelve Months; * Value traded ($ mn) do not include special trades, if any) ( # Data as of January 07, 2014) 12,229.08 11,995.67 11,811.75 11,898.18 12,305.52 0 12,500,000 25,000,000 11,500 11,950 12,400 4-Jan 5-Jan 6-Jan 7-Jan 8-Jan Volume QSE Index 0.2% (0.1%) (0.7%) (1.1%) (1.6%) (2.6%) (3.3%)(4.0%) (2.0%) 0.0% 2.0% Qatar(QSE)* Bahrain Kuwait AbuDhabi Oman Dubai SaudiArabia
- 2. Page 2 of 5 News Economic News QCB auctions T-bills worth QR4bn on January 4 – The Qatar Central Bank (QCB) has auctioned treasury bills worth QR4bn on January 4, 2015, for which it received bids totaling QR8.26bn. T-bills worth QR2bn with a three-month maturity period were auctioned at a yield of 0.74%. T-bills worth QR1bn with a six- month maturity period were sold at a yield of 0.87%, while T-bills worth QR1bn with a nine-month maturity period were auctioned at a yield of 0.94%. (QCB) Qatar’s inflation surges 3.5% in 3Q2014 on rising rents – According to data released by the Ministry of Development Planning & Statistics (MDPS), Qatar’s inflation rose to 3.5% YoY in 3Q2014. As per the Consumer Price Index (CPI) for 3Q2014, increases were recorded in all the major groups of commodities and services, but the highest rise of 7.9% was seen in the ‘rentals, fuel & energy’ group (represents 32% weight in CPI). The MDPS report said the rentals have been driving up the overall price inflation in Qatar. Further, prices in the ‘furniture, textile & home appliances’ category rose 5.2% YoY in 3Q2014. Goods under the ‘clothing & footwear’ group became costlier by 2.8% YoY. Services under the transport & communications category rose by 2.3%. Meanwhile, QoQ comparisons showed that rentals and prices of fuel & energy topped the list, which increased by 1.6% in 3Q2014 as compared to the prices in 2Q2014. This was followed by ‘transport & communication’, which rose by 1.1% QoQ. The overall CPI touched 118.6 in 3Q2014 as compared to 117.6 in 2Q2014, showing an increase of 0.9% QoQ. (Peninsula Qatar) QNBK: Crude price decline may put pressure on Big 3 Gulf markets – QNB Group (QNBK) has said in its latest investment outlook that the sharp decline in the crude oil price will put some pressure on equity markets in the GCC region and cause the region’s three major markets to shed their previous gains in the year. Qatar, Saudi Arabia and the UAE are the three major markets in the GCC region. The prevailing sentiment is that those governments may reduce their public spending in the medium-to-long term, which will reflect on the equity market and make some of the investors to reduce their positions in big sectors like petrochemicals. QNBK believes a healthy market correction is due before any rally ahead of the year-end earnings and dividend season. Market fundamentals are still strong in the GCC region. Despite the stock market decline toward the end of 2014, QNBK maintains its positive outlook for the region with a growth forecast at 4.5-5.0% for 2014 and 5.0-5.5% in 2015. According to QNBK’s outlook, economic growth in the Eurozone and China is likely to be slower in 4Q2014, while lower commodity prices and the risk of contagion from Russia may dent the outlook for selected emerging markets, GCC and Sub- Sahara African countries. (Gulf-Times.com) Market & Corporate News GISS announces QR5.50 cash dividend for 2014, MPHC QR1.10 – Gulf International Services (GISS) and Mesaieed Petrochemical Holding Company (MPHC) have recommended 2014 dividends for shareholders. GISS’ Board of Directors announced a cash DPS of QR5.50 for 2014 vs. QR1.60 (adjusted for 25% bonus shares) in 2013, which translates into a 243.7% YoY growth. We maintain our bullish opinion on GISS. Much of the company’s drilling business remains secured, despite the decline in oil prices, through existing contracts with just two offshore rigs (Al-Rayyan and Leshat) and two onshore rigs (GDI-5 and GDI-6) up for renewal in 2015 and 2016. Consequently, all remaining offshore rigs, except one, in a total fleet of 10 (9 currently in operation) are already secured by announced contracts with disclosed attractive rig rates that were fixed before the decline in oil prices. These contracts are mostly five years in duration with the earliest ending in 2Q2017. Meanwhile, MPHC, a holding entity for Q- Chem, Q-Chem II and Qatar Vinyl Company, has announced 11% cash dividend, which is equivalent to QR1.10 per share (of face value QR10). The dividend distribution of both the companies will have to be approved by the shareholders at the annual general assembly, whose dates have not been scheduled yet. (QNBFS Research, QSE, Gulf-Times.com) BRES acquires remaining 50% stake in Lusail Golf Development – Barwa Real Estate Company (BRES) through its subsidiary Barwa International Company has completed acquisition of the remaining 50% stake in Lusail Golf Development for a purchase consideration of QR2.48bn. Following the acquisition, BRES now holds a 100% stake in Lusail Golf Development. (Bloomberg) QIBK underwrites Murabaha financing for KFH-Turkey – Kuwait Finance House’s (KFH) Turkish subsidiary, Kuveyt Turk Katilim Bankasi (KFH-Turkey) has secured a $350mn two year syndicated Murabaha facility. Qatar Islamic Bank (QIBK), along with other GCC banks, acted as the lead arranger and book runner for the facility. QIBK’s underwriting was $40mn. (QSE) QATI establishes fully owned EU subsidiary – Qatar Insurance Company (QATI) has established a fully-owned Malta-based European Union (EU) subsidiary, QIC Europe Limited (QEL), through which it aims to enhance its property, casualty and specialty insurance cover in the EU and other non-EU European jurisdictions. QEL will become a key strategic platform for the group to underwrite European Economic Area risks by leveraging the group’s other platforms as Qatar Re and Antares. Meanwhile, the global ratings agency Standard & Poor’s has assigned an “A” rating (stable) to QEL based on the parental guarantee provided by QATI. (Gulf- Times.com) QDREIC transferred 61.98mn KCBK shares to QIA – Qatari Diar Real Estate Investment Company (QDREIC), the largest shareholder of Al Khalij Commercial Bank (KCBK), has transferred its 61.98mn shares in KCBK to Qatar Investment Authority (QIA) on January 6, 2015, represented by Qatar Holding Company. (QSE) QIBK BoD to meet on January 18 – Qatar Islamic Bank (QIBK) board of directors will meet on January 18, 2015 to approve the company’s financial results for the year ended December 31, 2014. (QSE) DHBK BoD to meet on January 20 – Doha Bank’s (DHBK) board of directors will meet on January 20, 2015 to approve the company’s financial results for the year ended December 31, 2014. (QSE) DOHI BoD meeting on January 25 – Doha Insurance Company’s (DOHI) Board of Directors will hold their meeting on January 25, 2015, which was previously scheduled for January 26, 2015, to discuss and approve the financial results for the year ended December 31, 2014. (QSE) MARK BoD will meet on January 26 – Masraf Al Rayan (MARK) board of directors will meet on January 26, 2015 to approve the company’s financial results for the year ended December 31, 2014. (QSE)
- 3. Page 3 of 5 Qatar Stock Exchange Top 5 Gainers Top 5 Decliners Source: Qatar Stock Exchange (QSE) Source: Qatar Stock Exchange (QSE) Most Active Shares by Value (QR Million) Most Active Shares by Volume (Million) Source: Qatar Stock Exchange (QSE) Source: Qatar Stock Exchange (QSE) Investor Trading Percentage to Total Value Traded Net Traded Value by Nationality (QR Million) Source: Qatar Stock Exchange (QSE) Source: Qatar Stock Exchange (QSE) 6.8% 4.8% 3.0% 2.7% 2.4% 0.0% 3.0% 6.0% 9.0% Medicare Group Industries Qatar Gulf International Services Qatar Islamic Bank Barwa Real Estate -8.9% -6.8% -5.8% -5.4% -5.2% -12.0% -8.0% -4.0% 0.0% Qatar Cinema & Film Distribution Islamic Holding Group Vodafone Qatar Qatar Insurance Qatari Investors Group 495.4 254.2 211.4 202.6 147.1 0.0 200.0 400.0 600.0 Barwa Real Estate Industries Qatar Islamic Holding Group Gulf International Services Masraf Al Rayan 12.1 6.4 6.2 5.1 4.9 0.0 5.0 10.0 15.0 Barwa Real Estate Aamal Ezdan Real Estate Mazaya Qatar Vodafone Qatar 0% 20% 40% 60% 80% 100% Buy Sell 43.10% 47.66% 24.51% 11.67% 17.99% 17.75% 14.40% 22.91% Qatari Individuals Qatari Institutions Non-Qatari Individuals Non-Qatari Institutions 1,686 808 1,480 1,014 207 (206) (500) - 500 1,000 1,500 2,000 Qatari Non-Qatari Net Investment Total Sold Total Bought
- 4. Page 4 of 5 TECHNICAL ANALYSIS OF THE QSE INDEX Source: Bloomberg The QSE Index started the year on a weaker note, losing 0.16% from the week before. The Index experienced a sharp fall at the start of the week (lost 5.6%) then recovered, creating a long legged Doji candlestick. This type of candlestick indicates indecision among market participants. However, the Index is still in a general, long-term uptrend. Volumes were weak throughout the week and the technical indicators exhibited neutral-to-bearish signs due to the non-directional movement of the Index. On the weekly frame, the Index is looking at an immediate resistance at 12,800 while the support is situated at 11,600. DEFINITIONS OF KEY TERMS USED IN TECHNICAL ANALYSIS RSI (Relative Strength Index) indicator – RSI is a momentum oscillator that measures the speed and change of price movements. The RSI oscillates between 0 to 100. The index is deemed to be overbought once the RSI approaches the 70 level, indicating that a correction is likely. On the other hand, if the RSI approaches 30, it is an indication that the index may be getting oversold and therefore likely to bounce back. MACD (Moving Average Convergence Divergence) indicator – The indicator consists of the MACD line and a signal line. The divergence or the convergence of the MACD line with the signal line indicates the strength in the momentum during the uptrend or downtrend, as the case may be. When the MACD crosses the signal line from below and trades above it, it gives a positive indication. The reverse is the situation for a bearish trend. Candlestick chart – A candlestick chart is a price chart that displays the high, low, open, and close for a security. The ‘body’ of the chart is portion between the open and close price, while the high and low intraday movements form the ‘shadow’. The candlestick may represent any time frame. We use a one-day candlestick chart (every candlestick represents one trading day) in our analysis. Doji candlestick pattern – A Doji candlestick is formed when a security's open and close are practically equal. The pattern indicates indecisiveness, and based on preceding price actions and future confirmation, may indicate a bullish or bearish trend reversal. Shooting Star/Inverted Hammer candlestick patterns – These candlestick patterns have a small real body (open price and close price are near to each other), and a long upper shadow (large intraday movement on the upside). The Shooting Star is a bearish reversal pattern that forms after a rally. The Inverted Hammer looks exactly like a Shooting Star, but forms after a downtrend. Inverted Hammers represent a potential bullish trend reversal.
- 5. Contacts Saugata Sarkar Abdullah Amin, CFA Shahan Keushgerian Head of Research Senior Research Analyst Senior Research Analyst Tel: (+974) 4476 6534 Tel: (+974) 4476 6569 Tel: (+974) 4476 6509 saugata.sarkar@qnbfs.com.qa abdullah.amin@qnbfs.com.qa shahan.keushgerian@qnbfs.com.qa Sahbi Kasraoui Ahmed Al-Khoudary QNB Financial Services SPC Manager – HNWI Head of Sales Trading – Institutional Contact Center: (+974) 4476 6666 Tel: (+974) 4476 6544 Tel: (+974) 4476 6548 PO Box 24025 sahbi.alkasraoui@qnbfs.com.qa ahmed.alkhoudary@qnbfs.com.qa Doha, Qatar Disclaimer and Copyright Notice: This publication has been prepared by QNB Financial Services SPC (“QNBFS”) a wholly-owned subsidiary of QNB SAQ (“QNB”). QNBFS is regulated by the Qatar Financial Markets Authority and the Qatar Exchange QNB SAQ is regulated by the Qatar Central Bank. This publication expresses the views and opinions of QNBFS at a given time only. It is not an offer, promotion or recommendation to buy or sell securities or other investments, nor is it intended to constitute legal, tax, accounting, or financial advice. QNBFS accepts no liability whatsoever for any direct or indirect losses arising from use of this report. Any investment decision should depend on the individual circumstances of the investor and be based on specifically engaged investment advice. We therefore strongly advise potential investors to seek independent professional advice before making any investment decision. Although the information in this report has been obtained from sources that QNBFS believes to be reliable, we have not independently verified such information and it may not be accurate or complete. QNBFS does not make any representations or warranties as to the accuracy and completeness of the information it may contain, and declines any liability in that respect. For reports dealing with Technical Analysis, expressed opinions and/or recommendations may be different or contrary to the opinions/recommendations of QNBFS Fundamental Research as a result of depending solely on the historical technical data (price and volume). QNBFS reserves the right to amend the views and opinions expressed in this publication at any time. It may also express viewpoints or make investment decisions that differ significantly from, or even contradict, the views and opinions included in this report. This report may not be reproduced in whole or in part without permission from QNBFS. COPYRIGHT: No part of this document may be reproduced without the explicit written permission of QNBFS. Page 5 of 5 Source: Bloomberg Com pany Nam e Price (January 08) % Change 5-Day % Change YTD Market Cap. QR Million TTM P/E P/B Div. Yield Qatar National Bank 213.00 0.05 0.05 149,042 14.3 2.7 3.3 Qatar Islamic Bank 105.00 2.74 2.74 24,811 16.8 2.1 3.8 Commercial Bank of Qatar 68.00 (0.73) (0.73) 20,192 11.2 1.2 2.5 Doha Bank 56.30 (1.23) (1.23) 14,546 10.2 1.3 8.0 Al Ahli Bank 54.60 0.00 0.00 9,020 15.8 2.2 N/A Qatar International Islamic Bank 80.50 (1.47) (1.47) 12,185 15.1 2.3 4.7 Masraf Al Rayan 43.90 (0.68) (0.68) 32,925 17.5 3.0 3.4 Al Khaliji Bank 22.00 (0.23) (0.23) 7,920 14.1 1.4 4.5 National Leasing 20.02 0.10 0.10 991 24.7 0.8 7.5 Dlala Holding 43.00 0.47 0.47 955 12.0 3.2 N/A Qatar & Oman Investment 15.36 (0.26) (0.26) 484 19.2 1.3 3.9 Islamic Holding Group 116.00 (6.83) (6.83) 464 32.8 7.2 1.5 Banking and Financial Services 273,534 Zad Holding 84.00 0.00 0.00 1,099 10.2 0.8 4.2 Qatar German Co. for Medical Devices 9.82 (3.25) (3.25) 113 N/M 0.7 N/A Salam International Investment 15.87 0.13 0.13 1,814 24.8 1.1 6.3 Medicare Group 125.00 6.84 6.84 3,518 23.6 4.2 1.4 Qatar Cinema & Film Distribution 40.10 (8.86) (8.86) 229 19.3 1.6 N/A Qatar Fuel 207.90 1.76 1.76 17,559 15.3 2.7 3.7 Qatar Meat and Livestock 61.00 0.99 0.99 1,098 20.5 4.3 3.4 Al Meera Consumer Goods 199.60 (0.20) (0.20) 3,992 14.7 2.9 4.0 Consum er Goods and Services 29,422 Qatar Industrial Manufacturing 43.95 1.38 1.38 2,089 10.7 1.3 N/A Qatar National Cement 132.60 0.45 0.45 6,511 14.6 2.5 4.5 Industries Qatar 176.00 4.76 4.76 106,480 16.7 3.3 6.3 Qatari Investors Group 39.25 (5.19) (5.19) 4,880 22.9 2.2 1.9 Qatar Electricity and Water 188.50 0.53 0.53 20,735 13.4 3.2 3.6 Mannai Corp. 107.80 (1.10) (1.10) 4,918 9.3 2.4 5.1 Aamal 14.57 (4.08) (4.08) 8,742 16.1 1.2 N/A Gulf International Services 100.00 2.99 2.99 18,584 18.6 5.2 1.6 Mesaieed Petrochemical Holding 28.85 (2.20) -2.2 36,245 N/A 2.6 1.2 Industrials 209,183 Qatar Insurance 85.70 (5.41) (5.41) 13,758 13.7 2.4 2.3 Doha Insurance 28.20 (2.76) (2.76) 1,410 10.0 1.3 7.1 Qatar General Insurance & Reinsurance 58.60 (0.68) (0.68) 4,054 2.7 0.7 2.1 Al Khaleej Takaful Insurance 50.60 (0.39) (0.39) 1,123 12.8 1.6 N/A Qatar Islamic Insurance 77.40 (2.03) (2.03) 1,161 14.1 3.9 4.9 Insurance 21,506 United Development 23.80 0.89 0.89 8,427 22.4 0.8 4.0 Barw a Real Estate 42.90 2.39 2.39 16,693 12.2 1.2 4.7 Ezdan Real Estate 14.70 (1.47) (1.47) 38,992 29.0 1.3 2.1 Mazaya Qatar Real Estate Development 19.20 0.26 0.26 1,920 9.0 1.6 3.9 Real Estate 66,032 Qatar Telecom 118.30 (4.52) (4.52) 37,894 14.9 1.5 3.4 Vodafone Qatar 15.50 (5.78) (5.78) 13,104 N/M 2.3 1.1 Telecom s 50,998 Qatar Navigation (Milaha) 98.00 (1.51) (1.51) 11,223 11.2 0.8 5.1 Gulf Warehousing 55.90 (0.89) (0.89) 2,659 20.6 3.2 2.7 Qatar Gas Transport (Nakilat) 23.00 (0.43) (0.43) 12,880 14.6 3.5 4.8 Transportation 26,762 Qatar Exchange 677,438