1. Page 1 of 5
Market Review and Outlook QSE Index and Volume
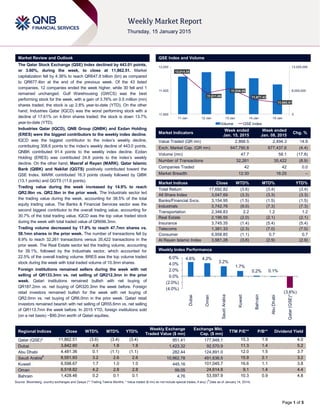
The Qatar Stock Exchange (QSE) Index declined by 443.01 points,
or 3.60%, during the week, to close at 11,862.51. Market
capitalization fell by 4.38% to reach QR647.8 billion (bn) as compared
to QR677.4bn at the end of the previous week. Of the 43 listed
companies, 12 companies ended the week higher, while 30 fell and 1
remained unchanged. Gulf Warehousing (GWCS) was the best
performing stock for the week, with a gain of 3.76% on 0.5 million (mn)
shares traded; the stock is up 2.8% year-to-date (YTD). On the other
hand, Industries Qatar (IQCD) was the worst performing stock with a
decline of 17.61% on 4.6mn shares traded; the stock is down 13.7%
year-to-date (YTD).
Industries Qatar (IQCD), QNB Group (QNBK) and Ezdan Holding
(ERES) were the biggest contributors to the weekly index decline.
IQCD was the biggest contributor to the index’s weekly decline,
contributing 308.6 points to the index’s weekly decline of 443.0 points.
QNBK contributed 91.4 points to the weekly index decline. Ezdan
Holding (ERES) was contributed 24.8 points to the index’s weekly
decline. On the other hand, Masraf al Rayan (MARK), Qatar Islamic
Bank (QIBK) and Nakilat (QGTS) positively contributed toward the
QSE Index. MARK contributed 16.3 points closely followed by QIBK
(13.1 points) and QGTS (11.6 points).
Trading value during the week increased by 14.9% to reach
QR2.9bn vs. QR2.5bn in the prior week. The Industrials sector led
the trading value during the week, accounting for 38.5% of the total
equity trading value. The Banks & Financial Services sector was the
second biggest contributor to the overall trading value, accounting for
30.7% of the total trading value. IQCD was the top value traded stock
during the week with total traded value of QR696.3mn.
Trading volume decreased by 17.8% to reach 47.7mn shares vs.
58.1mn shares in the prior week. The number of transactions fell by
8.9% to reach 32,261 transactions versus 35,422 transactions in the
prior week. The Real Estate sector led the trading volume, accounting
for 39.1%, followed by the Industrials sector, which accounted for
22.5% of the overall trading volume. BRES was the top volume traded
stock during the week with total traded volume of 10.3mn shares.
Foreign institutions remained sellers during the week with net
selling of QR133.3mn vs. net selling of QR212.3mn in the prior
week. Qatari institutions remained bullish with net buying of
QR187.2mn vs. net buying of QR320.3mn the week before. Foreign
retail investors remained bullish for the week with net buying of
QR2.0mn vs. net buying of QR6.0mn in the prior week. Qatari retail
investors remained bearish with net selling of QR55.6mn vs. net selling
of QR113.7mn the week before. In 2015 YTD, foreign institutions sold
(on a net basis) ~$90.2mn worth of Qatari equities.
Market Indicators
Week ended
Jan. 15, 2015
Week ended
Jan. 08, 2015
Chg. %
Value Traded (QR mn) 2,866.5 2,494.3 14.9
Exch. Market Cap. (QR mn) 647,790.8 677,437.6 (4.4)
Volume (mn) 47.7 58.1 (17.8)
Number of Transactions 32,261 35,422 (8.9)
Companies Traded 42 42 0.0
Market Breadth 12:30 16:25 –
Market Indices Close WTD% MTD% YTD%
Total Return 17,692.82 (3.6) (3.4) (3.4)
All Share Index 3,047.69 (3.3) (3.3) (3.3)
Banks/Financial Svcs. 3,154.95 (1.5) (1.5) (1.5)
Industrials 3,742.76 (9.0) (7.3) (7.3)
Transportation 2,346.83 2.2 1.2 1.2
Real Estate 2,196.55 (2.0) (2.1) (2.1)
Insurance 3,745.35 (1.4) (5.4) (5.4)
Telecoms 1,381.33 (2.3) (7.0) (7.0)
Consumer 6,958.85 (1.1) 0.7 0.7
Al Rayan Islamic Index 3,981.28 (3.6) (2.9) (2.9)
Market Indices
Weekly Index Performance
Regional Indices Close WTD% MTD% YTD%
Weekly Exchange
Traded Value ($ mn)
Exchange Mkt.
Cap. ($ mn)
TTM P/E** P/B** Dividend Yield
Qatar (QSE)* 11,862.51 (3.6) (3.4) (3.4) 951.41 177,948.1 15.3 1.9 4.0
Dubai 3,842.60 4.6 1.8 1.8 1,423.32 92,570.9 11.3 1.4 5.2
Abu Dhabi 4,481.36 0.1 (1.1) (1.1) 282.44 124,891.0 12.0 1.5 3.7
Saudi Arabia#
8,551.93 3.2 2.6 2.6 10,962.78 491,636.5 15.9 2.1 3.2
Kuwait 6,598.67 1.7 1.0 1.0 445.16 101,045.7 16.6 1.1 3.8
Oman 6,518.82 4.2 2.8 2.8 99.05 24,614.8 9.1 1.4 4.4
Bahrain 1,428.46 0.2 0.1 0.1 4.76 53,597.9 10.3 0.9 4.8
Source: Bloomberg, country exchanges and Zawya (** Trailing Twelve Months; * Value traded ($ mn) do not include special trades, if any) (
#
Data as of January 14, 2014)
12,014.35
11,911.69
11,936.58
11,877.43
11,862.51
0
6,000,000
12,000,000
11,800
11,925
12,050
11-Jan 12-Jan 13-Jan 14-Jan 15-Jan
Volume QSE Index
4.6% 4.2%
3.2%
1.7%
0.2% 0.1%
(3.6%)
(4.0%)
(2.0%)
0.0%
2.0%
4.0%
6.0%
Dubai
Oman
SaudiArabia
Kuwait
Bahrain
AbuDhabi
Qatar(QSE)*
2. Page 2 of 5
News
Economic News
MEED: Qatar to see $30bn new project deals in 2015 –
According to the latest data from MEED Projects, Qatar's
infrastructure projects pipeline is set to soar with more than
$30bn worth of new projects deals happening in 2015. There
will be major project awards as part of the Public Works
Authority’s (Ashghal) expressway, local roads and drainage
programs, as well as significant investment in real estate and
transport projects such as Lusail and the New Port Project. This
year will be boosted by project awards on the Al Karaana
petrochemical complex worth more than $5bn, the rolling stock
& systems contract on the Doha Metro exceeding $2bn, and
five multi-billion dollar packages on the mega water reservoirs.
Meanwhile, the MEED Qatar Projects Conference will be held
on March 10 and 11, 2015 on the theme: The resilience of
Qatar’s economy and its commitment to the objectives of the
Qatar National Vision 2030. (Gulf-Times.com, Peninsula Qatar)
QNB Group: Qatar’s international reserves hit record high
of $46.5bn in November – The QNB Group (QNBK), in its
latest ”Qatar Monthly Monitor”, said Qatar’s international
reserves jumped $6.9bn from November 2013 to reach an all-
time high of $46.5bn by the end of November 2014. QNBK said
the large increase in Qatar’s international reserves reflects the
strong current account surplus the country is enjoying, despite
lower international oil prices. The import cover stood at 8.7
months at end-November, well above the IMF-recommended
level of three months for pegged exchange rates. Going
forward, QNBK expects international reserves to rise further in
2015 on the back of continued current account surpluses.
Qatar’s crude oil production has been on a general decline, but
redevelopment plans should stabilize its output. Qatar
Petroleum (QP) is implementing a redevelopment program with
heavy investment in its existing oil fields such as Bul Hanine, Al
Shaheen and Dukhan, which should stabilize oil production at
about 700,000 barrels per day (bpd). Further, QNBK stated the
country’s foreign merchandise trade balance registered a
surplus of QR24.9bn in November 2014. The surplus
decreased 17.9% YoY partly because of lower international
crude oil prices, which reduced total exports by 10.7%. At the
same time, imports rose strongly, 13.8% YoY, reflecting the
growing population and large investment spending. Total
exports in November stood at QR35.0bn and imports at
QR10.1bn. Japan topped the export destination in November,
accounting for 22.6% of Qatar’s exports, followed by South
Korea (16.8%) and India (13.5%). The US was the largest
exporter to Qatar in November (13.2%), followed by China
(9.5%) and Germany (7.8%). QNBK’s monthly monitor shows
the country’s non-hydrocarbon sector continues to drive
economic growth, pushing its share of GDP to over half (50.7%)
in 3Q2014. (Gulf-Times.com)
MDPS: Qatar’s inflation declines 0.3% MoM in December –
According to the latest data released by the Ministry of
Development Planning & Statistics (MDPS), Qatar’s inflation
(CPI) declined by 0.3% MoM in December 2014. However, the
overall CPI increased by 2.7% on a YoY basis. As per the CPI,
prices of various goods and services across all major groups
have either remained flat or declined by varying degrees in
December 2014. The decline was attributed to price falls in the
food, beverages & tobacco group by 0.4%, garments &
footwear by 0.1%, furniture, textiles & home appliances by
0.3%, transport & communication by 0.5% and entertainment,
recreation & culture by 1.0%. On a YoY basis, price increases
were observed in all of the groups except the food, beverages
& tobacco group, which declined by 0.4%. (Peninsula Qatar)
Market & Corporate News
QNB Group posts strong 2014 results, recommends QR7.5
dividend per share – QNB Group (QNBK) continued to report
strong financial performance with its net profit up by 10.3% YoY
to QR10.5bn in FY2014, driven by increased operating income,
which grew to QR15.8bn in FY2014 (+7.3% YoY). The growth
in total operating income was supported by higher net interest
income (+6.1% YoY to QR12.3bn), net fee & commission
income (+9.7% YoY to QR2.1bn) and net gain from foreign
exchange (+7.0% YoY to QR815mn), reflecting success in
diversifying sources of income. EPS for FY2014 stood at
QR14.9 as compared to QR13.5 in FY2013. QNBK reported an
efficiency ratio of 20.8%, one of the best among financial
institutions in the region, helped by its continued prudent cost
control policy. Total assets were up by 9.7% YoY to QR486bn
in FY2014, primarily resulting from a strong lending portfolio
expansion (+8.8% YoY to QR338bn). Customer deposits stood
at QR360bn, gaining 7.4% in FY2014. Consequently, the
bank’s loan-to-deposit ratio stood at 94% vs. 93% in FY2013.
QNBK recorded an NPL ratio of 1.6%, one of the lowest among
banks in the Middle East & Africa region, while its coverage
ratio reached 124%. The bank’s Capital Adequacy Ratio as per
Basel III norms stood at 16.2% in FY2014, higher than the
regulatory minimum requirements of the Qatar Central Bank.
Meanwhile, the Board of Directors has recommended a cash
dividend of QR7.5/share for FY2014. (QNB Group Press
Release)
IHGS’ net profit surges 78.1% in FY2014, recommends
QR3.00 cash dividend – Islamic Holding Group (IHGS)
reported a net profit of QR16.1mn in FY2014, reflecting a sharp
increase of 78.1% YoY. EPS stood at QR4.02 in FY2014 as
compared to QR2.26 in FY2013. The surge in IHGS’ net
income was mainly on account of a strong jump in its net
brokerage & commission income, up 89.2% YoY to QR25.7mn
in FY2014. Meanwhile, the board of directors has
recommended a distribution of QR3.00 cash dividend. (QSE)
GISS BoD to meet on February 2 – Gulf International
Services’ (GISS) board of directors will meet on February 2,
2015 to discuss the financial results for the year ended
December 31, 2014. (GISS Press Release)
Al Dhameen offers QR174mn aid to 69 SMEs in 2014 –
Qatar Development Bank’s (QDB) Al Dhameen Manager
Jawaher al-Noaimi said that ‘Al Dhameen’ program has
guaranteed some 69 SME with a total value of QR174mn in
2014. Al Dhameen has helped SMEs in Qatar overcome the
challenges they face when seeking commercial financing. The
program has also helped banks overcome reservations about
financing SMEs due to the high-risk ratio of some in the sector.
Doha Bank (DHBK) organized a SME customer meet related to
the projects financed under the Al Dhameen guarantee
program of QDB. Doha Bank’s Group CEO, Dr. R Seetharaman
said that SMEs are expected to play an important role in
supporting Qatar’s economic diversification. Doha Bank will
participate in Qatar’s diversification story by encouraging the
SME sector. (Gulf-Times.com, Peninsula Qatar)
3. Page 3 of 5
Qatar Stock Exchange
Top 5 Gainers Top 5 Decliners
Source: Qatar Stock Exchange (QSE) Source: Qatar Stock Exchange (QSE)
Most Active Shares by Value (QR Million) Most Active Shares by Volume (Million)
Source: Qatar Stock Exchange (QSE) Source: Qatar Stock Exchange (QSE)
Investor Trading Percentage to Total Value Traded Net Traded Value by Nationality (QR Million)
Source: Qatar Stock Exchange (QSE) Source: Qatar Stock Exchange (QSE)
3.8%
3.5%
2.7%
2.6%
1.9%
0.0%
2.0%
4.0%
6.0%
Gulf
Warehousing
Qatar
Industrial
Manufacturing
Qatar Gas
Transport
(Nakilat)
Al Ahli Bank Qatar Islamic
Bank
-17.6%
-16.9%
-7.0%
-5.2%
-4.5%
-21.0%
-14.0%
-7.0%
0.0%
Industries Qatar Islamic Holding
Group
Aamal Vodafone Qatar Mesaieed
Petrochemical
Holding Company
696.3
427.1
403.0
274.8
142.0
0.0
240.0
480.0
720.0
Industries
Qatar
Barwa Real
Estate
QNB Group Gulf
International
Services
Masraf Al
Rayan
10.3
5.2
4.6
3.8
3.2
0.0
4.0
8.0
12.0
Barwa Real
Estate
Mazaya Qatar Industries Qatar Vodafone Qatar Masraf Al Rayan
0%
20%
40%
60%
80%
100%
Buy Sell
39.92% 41.86%
23.18% 16.65%
14.74%
14.67%
22.16% 26.81%
Qatari Individuals Qatari Institutions
Non-Qatari Individuals Non-Qatari Institutions
1,809
1,058
1,677
1,189
132
(131)
(500) - 500 1,000 1,500 2,000
Qatari
Non-Qatari
Net Investment Total Sold Total Bought
4. Page 4 of 5
TECHNICAL ANALYSIS OF THE QSE INDEX
Source: Bloomberg
The QSE Index experienced less volatility, accompanied with lower volumes during the week. The Index traded inside the previous week’s Doji candlestick,
which means uncertainty prevails as traders await financial results. The main uptrend line is intact and technical indicators still exhibit neutral-to-bearish
signs. The MACD is below the zero line while the RSI is in a downtrend but still away from the oversold area. The Index is looking at an immediate
resistance at 12,800 while the support is situated at 11,600.
DEFINITIONS OF KEY TERMS USED IN TECHNICAL ANALYSIS
RSI (Relative Strength Index) indicator – RSI is a momentum oscillator that measures the speed and change of price movements. The RSI oscillates
between 0 to 100. The index is deemed to be overbought once the RSI approaches the 70 level, indicating that a correction is likely. On the other hand, if
the RSI approaches 30, it is an indication that the index may be getting oversold and therefore likely to bounce back.
MACD (Moving Average Convergence Divergence) indicator – The indicator consists of the MACD line and a signal line. The divergence or the
convergence of the MACD line with the signal line indicates the strength in the momentum during the uptrend or downtrend, as the case may be. When the
MACD crosses the signal line from below and trades above it, it gives a positive indication. The reverse is the situation for a bearish trend.
Candlestick chart – A candlestick chart is a price chart that displays the high, low, open, and close for a security. The ‘body’ of the chart is portion between
the open and close price, while the high and low intraday movements form the ‘shadow’. The candlestick may represent any time frame. We use a one-day
candlestick chart (every candlestick represents one trading day) in our analysis.
Doji candlestick pattern – A Doji candlestick is formed when a security's open and close are practically equal. The pattern indicates indecisiveness, and
based on preceding price actions and future confirmation, may indicate a bullish or bearish trend reversal.
Shooting Star/Inverted Hammer candlestick patterns – These candlestick patterns have a small real body (open price and close price are near to each
other), and a long upper shadow (large intraday movement on the upside). The Shooting Star is a bearish reversal pattern that forms after a rally. The
Inverted Hammer looks exactly like a Shooting Star, but forms after a downtrend. Inverted Hammers represent a potential bullish trend reversal.
5. Contacts
Saugata Sarkar Abdullah Amin, CFA Shahan Keushgerian
Head of Research Senior Research Analyst Senior Research Analyst
Tel: (+974) 4476 6534 Tel: (+974) 4476 6569 Tel: (+974) 4476 6509
saugata.sarkar@qnbfs.com.qa abdullah.amin@qnbfs.com.qa shahan.keushgerian@qnbfs.com.qa
Sahbi Kasraoui Ahmed Al-Khoudary QNB Financial Services SPC
Manager – HNWI Head of Sales Trading – Institutional Contact Center: (+974) 4476 6666
Tel: (+974) 4476 6544 Tel: (+974) 4476 6548 PO Box 24025
sahbi.alkasraoui@qnbfs.com.qa ahmed.alkhoudary@qnbfs.com.qa Doha, Qatar
Disclaimer and Copyright Notice: This publication has been prepared by QNB Financial Services SPC (“QNBFS”) a wholly-owned subsidiary of QNB SAQ (“QNB”). QNBFS is
regulated by the Qatar Financial Markets Authority and the Qatar Exchange QNB SAQ is regulated by the Qatar Central Bank. This publication expresses the views and opinions of
QNBFS at a given time only. It is not an offer, promotion or recommendation to buy or sell securities or other investments, nor is it intended to constitute legal, tax, accounting, or
financial advice. QNBFS accepts no liability whatsoever for any direct or indirect losses arising from use of this report. Any investment decision should depend on the individual
circumstances of the investor and be based on specifically engaged investment advice. We therefore strongly advise potential investors to seek independent professional advice
before making any investment decision. Although the information in this report has been obtained from sources that QNBFS believes to be reliable, we have not independently
verified such information and it may not be accurate or complete. QNBFS does not make any representations or warranties as to the accuracy and completeness of the information
it may contain, and declines any liability in that respect. For reports dealing with Technical Analysis, expressed opinions and/or recommendations may be different or contrary to
the opinions/recommendations of QNBFS Fundamental Research as a result of depending solely on the historical technical data (price and volume). QNBFS reserves the right to
amend the views and opinions expressed in this publication at any time. It may also express viewpoints or make investment decisions that differ significantly from, or even
contradict, the views and opinions included in this report. This report may not be reproduced in whole or in part without permission from QNBFS.
COPYRIGHT: No part of this document may be reproduced without the explicit written permission of QNBFS.
Page 5 of 5
Source: Bloomberg
Com pany Nam e
Price
(January 15)
% Change
5-Day
% Change
YTD
Market Cap.
QR Million TTM P/E P/B Div. Yield
Qatar National Bank 204.00 (4.23) (4.18) 142,745 13.6 2.5 3.4
Qatar Islamic Bank 107.00 1.90 4.70 25,283 17.1 2.1 3.7
Commercial Bank of Qatar 67.50 (0.74) (1.46) 20,043 11.1 1.2 2.5
Doha Bank 56.00 (0.53) (1.75) 14,469 10.1 1.3 8.0
Al Ahli Bank 56.00 2.56 2.56 9,251 16.2 2.3 N/A
Qatar International Islamic Bank 79.00 (1.86) (3.30) 11,958 14.8 2.2 4.7
Masraf Al Rayan 44.55 1.48 0.79 33,413 17.8 3.1 3.4
Al Khaliji Bank 21.50 (2.27) (2.49) 7,740 13.8 1.4 4.7
National Leasing 20.23 1.05 1.15 1,001 25.0 0.8 7.4
Dlala Holding 43.35 0.81 1.29 962 12.1 3.2 N/A
Qatar & Oman Investment 14.75 (3.97) (4.22) 465 18.5 1.2 4.1
Islamic Holding Group 96.40 (16.90) (22.57) 386 24.0 5.7 1.8
Banking and Financial Services 267,715
Zad Holding 83.10 (1.07) (1.07) 1,087 10.1 0.8 4.2
Qatar German Co. for Medical Devices 9.77 (0.51) (3.74) 113 N/M 0.7 N/A
Salam International Investment 15.60 (1.70) (1.58) 1,783 24.3 1.1 6.4
Medicare Group 124.20 (0.64) 6.15 3,495 23.5 4.1 1.4
Qatar Cinema & Film Distribution 40.10 0.00 (8.86) 229 19.3 1.6 N/A
Qatar Fuel 205.20 (1.30) 0.44 17,331 15.1 2.6 3.7
Qatar Meat and Livestock 59.50 (2.46) (1.49) 1,071 20.0 4.2 3.5
Al Meera Consumer Goods 200.10 0.25 0.05 4,002 14.8 2.9 4.0
Consum er Goods and Services 29,112
Qatar Industrial Manufacturing 45.50 3.53 4.96 2,162 11.0 1.4 N/A
Qatar National Cement 132.50 (0.08) 0.38 6,506 14.6 2.5 4.5
Industries Qatar 145.00 (17.61) (13.69) 87,725 13.7 2.7 7.6
Qatari Investors Group 38.80 (1.15) (6.28) 4,824 22.6 2.2 1.9
Qatar Electricity and Water 190.00 0.80 1.33 20,900 13.5 3.2 3.6
Mannai Corp. 104.10 (3.43) (4.50) 4,749 9.0 2.4 5.3
Aamal 13.55 (7.00) (10.80) 8,130 15.0 1.1 N/A
Gulf International Services 99.00 (1.00) 1.96 18,398 18.4 5.1 1.6
Mesaieed Petrochemical Holding 27.55 (4.51) -6.6 34,612 N/A 2.4 1.3
Industrials 188,006
Qatar Insurance 83.90 (2.10) (7.40) 13,469 13.4 2.4 2.4
Doha Insurance 27.40 (2.84) (5.52) 1,370 9.7 1.3 7.3
Qatar General Insurance & Reinsurance 59.40 1.37 0.68 4,109 2.7 0.7 2.2
Al Khaleej Takaful Insurance 49.60 (1.98) (2.36) 1,101 12.5 1.5 N/A
Qatar Islamic Insurance 77.00 (0.52) (2.53) 1,155 14.1 3.8 4.9
Insurance 21,204
United Development 23.68 (0.50) 0.38 8,385 22.3 0.8 4.0
Barw a Real Estate 41.70 (2.80) (0.48) 16,226 11.9 1.2 4.8
Ezdan Real Estate 14.39 (2.11) (3.55) 38,169 28.4 1.2 2.2
Mazaya Qatar Real Estate Development 18.99 (1.09) (0.84) 1,899 8.9 1.6 3.9
Real Estate 64,680
Qatar Telecom 116.50 (1.52) (5.97) 37,317 14.7 1.5 3.4
Vodafone Qatar 14.70 (5.16) (10.64) 12,427 N/M 2.2 1.2
Telecom s 49,745
Qatar Navigation (Milaha) 99.00 1.02 (0.50) 11,338 11.3 0.8 5.1
Gulf Warehousing 58.00 3.76 2.84 2,759 21.4 3.3 2.6
Qatar Gas Transport (Nakilat) 23.63 2.74 2.29 13,233 15.0 3.6 4.7
Transportation 27,329
Qatar Exchange 647,791