

Recommended
More Related Content
What's hot
What's hot (20)
Viewers also liked
Viewers also liked (10)
Similar to Weekly market report
Similar to Weekly market report (20)
More from QNB Group
More from QNB Group (20)
Recently uploaded
Recently uploaded (20)
Weekly market report
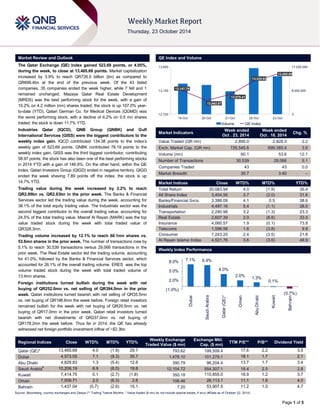
- 1. Page 1 of 5 Market Review and Outlook QE Index and Volume The Qatar Exchange (QE) Index gained 523.69 points, or 4.05%, during the week, to close at 13,465.69 points. Market capitalization increased by 3.9% to reach QR726.5 billion (bn) as compared to QR699.4bn at the end of the previous week. Of the 43 listed companies, 35 companies ended the week higher, while 7 fell and 1 remained unchanged. Mazaya Qatar Real Estate Development (MRDS) was the best performing stock for the week, with a gain of 10.2% on 4.2 million (mn) shares traded; the stock is up 107.0% year-to- date (YTD). Qatari German Co. for Medical Devices (QGMD) was the worst performing stock, with a decline of 6.2% on 0.5 mn shares traded; the stock is down 11.7% YTD. Industries Qatar (IQCD), QNB Group (QNBK) and Gulf International Services (GISS) were the biggest contributors to the weekly index gain. IQCD contributed 134.38 points to the index’s weekly gain of 523.69 points. QNBK contributed 78.19 points to the weekly index gain. GISS was the third biggest contributor, contributing 58.97 points; the stock has also been one of the best performing stocks in 2014 YTD with a gain of 146.9%. On the other hand, within the QE Index, Qatari Investors Group (QIGD) ended in negative territory. QIGD ended the week shaving 7.89 points off the index; the stock is up 14.7% YTD. Trading value during the week increased by 2.2% to reach QR2.89bn vs. QR2.83bn in the prior week. The Banks & Financial Services sector led the trading value during the week, accounting for 38.1% of the total equity trading value. The Industrials sector was the second biggest contributor to the overall trading value, accounting for 24.5% of the total trading value. Masraf Al Rayan (MARK) was the top value traded stock during the week with total traded value of QR328.3mn. Trading volume increased by 12.1% to reach 60.1mn shares vs. 53.6mn shares in the prior week. The number of transactions rose by 5.1% to reach 30,539 transactions versus 29,066 transactions in the prior week. The Real Estate sector led the trading volume, accounting for 41.0%, followed by the Banks & Financial Services sector, which accounted for 26.1% of the overall trading volume. ERES was the top volume traded stock during the week with total traded volume of 13.4mn shares. Foreign institutions turned bullish during the week with net buying of QR252.0mn vs. net selling of QR394.0mn in the prior week. Qatari institutions turned bearish with net selling of QR35.5mn vs. net buying of QR198.6mn the week before. Foreign retail investors remained bullish for the week with net buying of QR20.5mn vs. net buying of QR17.0mn in the prior week. Qatari retail investors turned bearish with net divestments of QR237.0mn vs. net buying of QR178.2mn the week before. Thus far in 2014, the QE has already witnessed net foreign portfolio investment inflow of ~$2.3bn. Market Indicators Week ended Oct . 23, 2014 Week ended Oct . 16, 2014 Chg. % Value Traded (QR mn) 2,890.0 2,828.5 2.2 Exch. Market Cap. (QR mn) 726,545.6 699,385.4 3.9 Volume (mn) 60.1 53.6 12.1 Number of Transactions 30,539 29,066 5.1 Companies Traded 43 43 0.0 Market Breadth 35:7 3:40 – Market Indices Close WTD% MTD% YTD% Total Return 20,083.94 4.0 (1.9) 35.4 All Share Index 3,404.56 3.7 (2.0) 31.6 Banks/Financial Svcs. 3,386.09 4.1 0.5 38.6 Industrials 4,497.16 5.4 (1.1) 28.5 Transportation 2,290.98 3.2 (1.3) 23.3 Real Estate 2,607.39 2.0 (8.8) 33.5 Insurance 4,060.57 1.9 (0.1) 73.8 Telecoms 1,596.56 1.6 (3.8) 9.8 Consumer 7,243.20 2.4 (3.5) 21.8 Al Rayan Islamic Index 4,521.76 3.6 (3.0) 48.9 Market Indices Weekly Index Performance Regional Indices Close WTD% MTD% YTD% Weekly Exchange Traded Value ($ mn) Exchange Mkt. Cap. ($ mn) TTM P/E** P/B** Dividend Yield Qatar (QE)* 13,465.69 4.0 (1.9) 29.7 793.62 199,509.4 17.6 2.2 3.5 Dubai 4,573.05 7.1 (9.3) 35.7 1,478.10 101,279.1 18.1 1.7 2.1 Abu Dhabi 4,829.83 1.3 (5.4) 12.6 390.79 96,204.4 13.7 1.7 3.4 Saudi Arabia# 10,206.19 6.9 (6.0) 19.6 12,104.72 554,307.1 19.4 2.5 2.8 Kuwait 7,414.75 0.1 (2.7) (1.8) 350.18 110,855.0 18.9 1.2 3.7 Oman 7,009.71 2.0 (6.3) 2.6 106.46 26,113.1 11.1 1.6 4.0 Bahrain 1,437.04 (0.7) (2.6) 15.1 7.20 53,907.5 11.2 1.0 4.7 Source: Bloomberg, country exchanges and Zawya (** Trailing Twelve Months; * Value traded ($ mn) do not include special trades, if any) (#Data as of October 22, 2014) 13,147.79 12,962.67 13,076.41 13,328.62 13,465.69 0 8,500,000 17,000,000 12,700 13,150 13,600 19-Oct 20-Oct 21-Oct 22-Oct 23-Oct Volume QE Index 7.1% 6.9% 4.0% 2.0% 1.3% 0.1% (0.7%) (1.0%) 2.0% 5.0% 8.0% Dubai Saudi Arabia Qatar (QE)* Oman Abu Dhabi Kuwait Bahrain
- 2. Page 2 of 5 News Economic News QCB: Real estate price index at all-time high – According to the Qatar Central Bank’s (QCB) quarterly update, the real estate price index in Qatar reached an all-time high, surging a record 42.1% YoY in September 2014. The index touched a record 253.8 points in September 2014. The QCB index for real estate prices has been steadily rising throughout this year except May 2014, when the index fell marginally to 213.8 points from 216.0 points in April. The prices, however, rebounded by hitting 230.6 points in June 2014. (GulfBase.com) Market & Corporate News IQCD’s reported 3Q2014 net profit beats estimates handily based on resurgence in fertilizer along with a slightly better-than-expected petrochemical performance. IQCD posted 3Q2014 net income of QR1.89bn (+50% QoQ, +6% YoY) vs. our estimate/Bloomberg consensus of QR1.65bn/QR1.63bn. (QNBFS Research, IQCD) GISS reports in-line results for 3Q2014 – Gulf International Services (GISS) reported a net income of QR317.6mn in 3Q2014 vs. our estimate of QR308.2mn. Reported net income was up 15% QoQ and 91% YoY. The growth in earnings was primarily driven by the strong growth in revenue (up 14.1% QoQ and 94% YoY). (QNBFS Research, QE) MPHC reports QR1.38bn net profit in 9M2014 – Mesaieed Petrochemical Holding Company (MPHC) reported a net profit of QR1.38bn with joint ventures chipping in QR1.29bn (more than 93%) in 9M2014. (Gulf-Times.com) MARK’s 3Q2014 net income impacted by an one-off gain – Masraf Al Rayan (MARK) posted a net profit of QR522.5mn in 3Q2014 vs. QR471.4mn in 2Q2014, up 10.8% QoQ. The results were below our estimate of QR614.8mn and Bloomberg consensus estimate of QR536.2mn. The miss is due to the fact that MARK partially booked an investment gain of QR74.5mn vs. our estimate QR186.4mn (40% of the total gain expected to be booked in the first year, more details below). Hence, we expect another ~QR112mn in gains to booked over the next three quarters (the timing of booking this gain is at management discretion). (QNBFS Research, QE) QIBK reports QR404.8mn net profit in 3Q2014, up 3.9% QoQ – Qatar Islamic Bank (QIBK) posted a net profit of QR404.8mn in 3Q2014 vs. our estimate of QR371.2mn (Bloomberg consensus was QR385.7mn). QIBK posted QR389.8mn in 2Q2014, implying a growth of 3.9% QoQ. The QoQ growth in earnings was mainly due to lower provisions of QR46.3mn in 3Q2014 vs. QR74.6mn in 2Q2014. (QNBFS Research, QE) QIIK posts net profit of QR222.8mn in 3Q2014 – Qatar International Islamic Bank (QIIK) reported a 10% YoY increase in 9M2014 net profit to QR625mn. For 3Q2014, the company reported a net income of QR222.8mn vs. our estimate of QR209.7mn. (Gulf-Times.com) DHBK’s 3Q2014 net income drops by 10.2% QoQ on the back of weak non-interest income – DHBK reported a net profit of QR348.1mn vs. our estimate of QR369.7mn, falling short of our expectations as well as Bloomberg consensus. On a QoQ basis net profit declined by 10.2% (+5.9% YoY) due to a substantial drop in non-interest income (down 14.5%), reaching QR225.1mn. Doha Bank registered a net interest income of QR488.7mn, exhibiting flat performance QoQ (+6.0 YoY) Thus, the annualized NIM was flat QoQ at ~3.01% vs. ~3.09% in 1Q2014 and ~3.29% in 3Q2013. Fees & commissions stood at QR131.2mn, sliding by 4.3% QoQ (+42.7% YoY). Moreover, FX income dropped by 17.6% QoQ (down 6.3% YoY). Investment income aided in driving bottom-line growth on a YoY basis. (QNBFS Research, QE) KCBK 3Q2014 beats estimates on higher than expected investment income & lower provisions – 3Q2014 profitability beats estimates on the back of higher-than-expected investment income and lower provisions. KCBK posted a net profit of QR145.9mn, beating our estimate of QR101.9mn. The bank reported a net interest income of QR183.0mn, in-line with our estimate of QR180.4mn. On an operating income basis (adjusted for investment income), KCBK generated QR219.5mn (in-line with our expectations of QR223.2mn). Net income declined by 2.5% QoQ (+35.5% YoY). Lower provisions and higher than expected investment income was the primary cause of the miss. Core banking income was weak on a QoQ basis but strong on a YoY basis. Net interest income receded by 7.9% QoQ (+34.8% YoY) to QR183.0mn. The bank’s NIM has been under pressure, sliding to ~1.69% in 3Q2014 vs. ~1.91% in 2Q2014 (3Q2013: ~1.77%). (QNBFS Research, QE) QATI reports QR144.3mn net profit in 3Q2014, to list subsidiary for foreign markets – Qatar Insurance Company (QATI) reported a net profit of QR144.3mn in 3Q2014 as compared to QR319.0mn in 2Q2014. The net profit was up 21.0% on a YoY basis, but was down 54.8% on a QoQ basis. QATI generated gross premium of QR1.25bn in 3Q2014 vs. QR2.10bn in 2Q2014 (QR1.35bn after adjusting for one-off impact of Antares). Investment income dropped by 42.2% QoQ and 64.0% YoY in 3Q2014. Along with the results, QATI announced that it is planning to list its subsidiary QIC International on the Qatar Exchange as part of its broader measures to make the company more visible in the corporate space. Moreover, QATI is seeking to enhance the foreign ownership limit to a maximum of 49% from the present 25%, in line with a recent Emiri Decree that allowed higher limits in listed companies. Meanwhile, the company’s board has called for an AGM and EGM on November 23, 2014 to approve pending matters. (QNBFS Research, QE) GWCS reports QR34.7mn net profit in 3Q2014 – Gulf Warehousing reported a net profit of QR34.79mn for 3Q2014, down 6.2% QoQ from QR38.8mn in 2Q2014. (QNBFS Research, QE) QIGD’s net profit declines 21.5% YoY in 3Q2014 – Qatari Investors Group (QIGD) has posted a net profit of QR54.4mn in 3Q2014 as compared to QR69.2mn in 3Q2013, reflecting a YoY decline of 21.5% (-10.7% on a QoQ basis). The decline in net profit was primarily due to increase in operating costs as well as decline in top-line. QIGD posted a 14.8% QoQ decline in top-line to QR128.3mn in 3Q2014 (-1.7% YoY). EPS for 9M2014 stood at QR1.40 vs. QR1.45 for 9M2013. (QE) QIMD’s net profit drops 4.3% YoY in 9M2014 – Qatar Industrial Manufacturing Company (QIMD) reported a 4.3% drop in its 9M2014 net profit to QR141.7mn as compared to QR148.1mn in 9M2013. Earnings per share (EPS) amounted to QR2.98 in 9M2014 as compared to QR3.12 in 9M2013. (Gulf- Times.com) AKHI reports QR55.1mn net profit in 9M2014 – Al Khaleej Takaful Group (AKHI) revealed a net profit of QR55.1mn for 9M2014 as compared to a net profit of QR32.9mn for 9M2013. EPS amounted to QR2.48 for the period ended September 30, 2014 versus QR1.93 for the corresponding period in 2013. (QE)
- 3. Page 3 of 5 Qatar Exchange Top 5 Gainers Top 5 Decliners Source: Qatar Exchange (QE) Source: Qatar Exchange (QE) Most Active Shares by Value (QR Million) Most Active Shares by Volume (Million) Source: Qatar Exchange (QE) Source: Qatar Exchange (QE) Investor Trading Percentage to Total Value Traded Net Traded Value by Nationality (QR Million) Source: Qatar Exchange (QE) Source: Qatar Exchange (QE) 10.2% 9.6% 7.6% 7.4% 6.9% 0.0% 4.0% 8.0% 12.0% Mazaya Qatar Gulf International Services Industries Qatar Al Ahli Bank Qatar Electricity and Water -6.2% -3.7% -2.9% -1.1% -0.9% -7.5% -5.0% -2.5% 0.0% Qatar German Co. for Medical Devices Qatari Investors Group Mannai Corp. Qatar General Insurance & Reinsurance Qatar Industrial Manufacturing 328.3 252.4 247.8 221.4 210.2 0.0 120.0 240.0 360.0 Masraf Al Rayan QNB Group Ezdan Real Estate Industries Qatar Gulf International Services 13.4 6.3 5.5 4.2 3.7 0.0 5.0 10.0 15.0 Ezdan Real Estate Masraf Al Rayan United Development Mazaya Qatar Vodafone Qatar 0% 20% 40% 60% 80% 100% Buy Sell 39.17% 47.37% 15.45% 16.68% 16.07% 15.36% 29.31% 20.59% Qatari Individuals Qatari Institutions Non-Qatari Individuals Non-Qatari Institutions 1,578 1,311 1,851 1,039 (273) 273 (500) - 500 1,000 1,500 2,000 Qatari Non-Qatari Net Investment Total Sold Total Bought
- 4. Page 4 of 5 TECHNICAL ANALYSIS OF THE QE INDEX Source: Bloomberg The QE Index reversed its direction and closed the week gaining 523.69 points and closing on this week’s high. The bullish move started from the strong support around the 13,000 psychological level. This bounce is confirmed with a bullish attitude registered on the RSI while the MACD is also showing signs of strength especially after the weak performance the index experienced over the past month. Breach of the down trend line created from the bearish leg is also a sign of having the bulls back into play. The strength of the bulls should be confirmed by crossing the 55-day and 21-day moving averages. Otherwise, we might experience another round of selling pressure that may send the index back the 13,000 points or possibly lower. DEFINITIONS OF KEY TERMS USED IN TECHNICAL ANALYSIS RSI (Relative Strength Index) indicator – RSI is a momentum oscillator that measures the speed and change of price movements. The RSI oscillates between 0 to 100. The index is deemed to be overbought once the RSI approaches the 70 level, indicating that a correction is likely. On the other hand, if the RSI approaches 30, it is an indication that the index may be getting oversold and therefore likely to bounce back. MACD (Moving Average Convergence Divergence) indicator – The indicator consists of the MACD line and a signal line. The divergence or the convergence of the MACD line with the signal line indicates the strength in the momentum during the uptrend or downtrend, as the case may be. When the MACD crosses the signal line from below and trades above it, it gives a positive indication. The reverse is the situation for a bearish trend. Candlestick chart – A candlestick chart is a price chart that displays the high, low, open, and close for a security. The ‘body’ of the chart is portion between the open and close price, while the high and low intraday movements form the ‘shadow’. The candlestick may represent any time frame. We use a one-day candlestick chart (every candlestick represents one trading day) in our analysis. Doji candlestick pattern – A Doji candlestick is formed when a security's open and close are practically equal. The pattern indicates indecisiveness, and based on preceding price actions and future confirmation, may indicate a bullish or bearish trend reversal. Shooting Star/Inverted Hammer candlestick patterns – These candlestick patterns have a small real body (open price and close price are near to each other), and a long upper shadow (large intraday movement on the upside). The Shooting Star is a bearish reversal pattern that forms after a rally. The Inverted Hammer looks exactly like a Shooting Star, but forms after a downtrend. Inverted Hammers represent a potential bullish trend reversal.
- 5. Contacts Saugata Sarkar Abdullah Amin, CFA Shahan Keushgerian Head of Research Senior Research Analyst Senior Research Analyst Tel: (+974) 4476 6534 Tel: (+974) 4476 6569 Tel: (+974) 4476 6509 saugata.sarkar@qnbfs.com.qa abdullah.amin@qnbfs.com.qa shahan.keushgerian@qnbfs.com.qa Sahbi Kasraoui Ahmed Al-Khoudary QNB Financial Services SPC Manager – HNWI Head of Sales Trading – Institutional Contact Center: (+974) 4476 6666 Tel: (+974) 4476 6544 Tel: (+974) 4476 6548 PO Box 24025 sahbi.alkasraoui@qnbfs.com.qa ahmed.alkhoudary@qnbfs.com.qa Doha, Qatar DISCLAIMER: This publication has been prepared by QNB Financial Services SPC (“QNBFS”) a wholly-owned subsidiary of Qatar National Bank (“QNB”). QNBFS is regulated by the Qatar Financial Markets Authority and the Qatar Exchange; QNB is regulated by the Qatar Central Bank. This publication expresses the views and opinions of QNBFS at a given time only. It is not an offer, promotion or recommendation to buy or sell securities or other investments, nor is it intended to constitute legal, tax, accounting, or financial advice. We therefore strongly advise potential investors to seek independent professional advice before making any investment decision. Although the information in this report has been obtained from sources that QNBFS believes to be reliable, we have not independently verified such information and it may not be accurate or complete. While this publication has been prepared with the utmost degree of care by our analysts, QNBFS does not make any representations warranties as to the accuracy and completeness of the information it may contain, and declines any liability in that respect. QNBFS reserves the right to amend the views and opinions expressed in this publication at any time. It may also express viewpoints or make investment decisions that differ significantly from, or even contradict, the views and opinions included in this report. COPYRIGHT: No part of this document may be reproduced without the explicit written permission of QNBFS. Page 5 of 5 Source: Bloomberg Company NamePrice(October 23) % Change 5-Day% Change YTDMarket Cap. QR MillionTTM P/EP/BDiv. YieldQatar National Bank208.903.8321.45146,173 14.12.63.4Qatar Islamic Bank114.505.0565.9427,056 18.32.23.5Commercial Bank of Qatar71.804.6621.6921,320 13.31.32.3Doha Bank58.404.100.3415,089 10.61.37.7Al Ahli Bank56.907.3634.499,400 16.52.3N/AQatar International Islamic Bank87.504.7941.8213,245 16.42.54.3Masraf Al Rayan53.003.3169.3339,750 21.23.72.8Al Khaliji Bank21.992.7610.017,916 14.11.44.5National Leasing27.004.05(10.45)1,336 32.11.15.6Dlala Holding60.003.45171.491,332 16.94.9N/AQatar & Oman Investment16.45(0.54)31.39518 21.11.53.6Islamic Holding Group129.903.34182.39520 36.78.11.3Banking and Financial Services283,655 Zad Holding88.902.7727.911,163 10.71.53.9Qatar German Co. for Medical Devices12.23(6.21)(11.70)141 N/A0.9N/ASalam International Investment17.300.0032.971,978 27.01.25.8Medicare Group127.003.00141.903,574 24.04.21.4Qatar Cinema & Film Distribution44.101.389.98252 21.21.7N/AQatar Fuel217.002.60(0.70)18,328 15.43.03.5Qatar Meat and Livestock59.602.5815.281,073 19.14.43.5Al Meera Consumer Goods187.002.2440.293,740 14.52.94.3Consumer Goods and Services30,248 Qatar Industrial Manufacturing45.60(0.87)8.142,167 11.11.5N/AQatar National Cement130.00(0.76)9.246,383 14.62.54.6Industries Qatar191.507.5813.38115,858 18.13.65.7Qatari Investors Group50.10(3.65)14.656,229 29.22.81.5Qatar Electricity and Water191.906.9116.0521,109 13.73.23.6Mannai Corp.112.60(2.85)25.255,137 9.72.54.9Aamal14.832.70(1.13)8,898 16.61.3N/AGulf International Services120.509.55146.9322,394 22.46.21.3Mesaieed Petrochemical Holding31.651.44N/A39,762 N/A2.91.1Industrials227,936 Qatar Insurance98.502.2885.1515,813 15.73.02.0Doha Insurance32.700.6230.801,635 12.91.66.1Qatar General Insurance & Reinsurance45.00(1.10)12.733,113 2.20.72.8Al Khaleej Takaful Insurance46.202.9064.551,026 11.71.5N/AQatar Islamic Insurance86.204.4848.881,293 15.74.64.4Insurance22,880 United Development28.104.0730.509,950 20.00.93.4Barwa Real Estate40.955.0037.4215,935 12.31.24.9Ezdan Real Estate18.450.058.5348,939 37.91.71.7Mazaya Qatar Real Estate Development23.1410.19106.982,314 13.01.93.2Real Estate77,137 Qatar Telecom127.001.03(7.43)40,681 16.31.63.1Vodafone Qatar20.503.0791.4117,331 N/A3.00.8Telecoms58,011 Qatar Navigation (Milaha)96.002.7815.6610,994 12.20.95.2Gulf Warehousing51.305.9923.612,440 18.92.92.9Qatar Gas Transport (Nakilat)23.652.9616.7913,244 16.13.64.7Transportation26,678 Qatar Exchange726,546