QNBFS Daily Technical Trader Qatar - September 07, 2023 التحليل الفني اليومي ...
Weekly market report
1. Page 1 of 5
Market Review and Outlook QSE Index and Volume
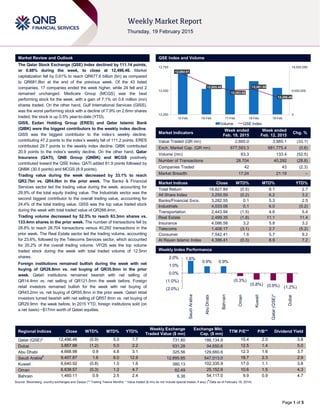
The Qatar Stock Exchange (QSE) Index declined by 111.14 points,
or 0.88% during the week, to close at 12,496.46. Market
capitalization fell by 0.61% to reach QR677.6 billion (bn) as compared
to QR681.8bn at the end of the previous week. Of the 43 listed
companies, 17 companies ended the week higher, while 24 fell and 2
remained unchanged. Medicare Group (MCGS) was the best
performing stock for the week, with a gain of 7.1% on 0.6 million (mn)
shares traded. On the other hand, Gulf International Services (GISS),
was the worst performing stock with a decline of 7.9% on 2.6mn shares
traded; the stock is up 0.5% year-to-date (YTD).
GISS, Ezdan Holding Group (ERES) and Qatar Islamic Bank
(QIBK) were the biggest contributors to the weekly index decline.
GISS was the biggest contributor to the index’s weekly decline,
contributing 47.2 points to the index’s weekly fall of 111.2 points. ERES
contributed 29.7 points to the weekly index decline. QIBK contributed
20.9 points to the index’s weekly decline. On the other hand, Qatar
Insurance (QATI), QNB Group (QNBK) and MCGS positively
contributed toward the QSE Index. QATI added 81.9 points followed by
QNBK (30.5 points) and MCGS (8.9 points).
Trading value during the week decreased by 33.1% to reach
QR2.7bn vs. QR4.0bn in the prior week. The Banks & Financial
Services sector led the trading value during the week, accounting for
29.9% of the total equity trading value. The Industrials sector was the
second biggest contributor to the overall trading value, accounting for
24.4% of the total trading value. GISS was the top value traded stock
during the week with total traded value of QR266.4mn.
Trading volume decreased by 52.5% to reach 63.3mn shares vs.
133.4mn shares in the prior week. The number of transactions fell by
28.8% to reach 28,704 transactions versus 40,292 transactions in the
prior week. The Real Estate sector led the trading volume, accounting
for 23.6%, followed by the Telecoms Services sector, which accounted
for 20.2% of the overall trading volume. VFQS was the top volume
traded stock during the week with total traded volume of 12.5mn
shares.
Foreign institutions remained bullish during the week with net
buying of QR28.8mn vs. net buying of QR35.9mn in the prior
week. Qatari institutions remained bearish with net selling of
QR14.4mn vs. net selling of QR121.5mn the week before. Foreign
retail investors remained bullish for the week with net buying of
QR43.2mn vs. net buying of QR55.8mn in the prior week. Qatari retail
investors turned bearish with net selling of QR57.6mn vs. net buying of
QR29.9mn the week before. In 2015 YTD, foreign institutions sold (on
a net basis) ~$17mn worth of Qatari equities.
Market Indicators
Week ended
Feb. 19, 2015
Week ended
Feb. 12, 2015
Chg. %
Value Traded (QR mn) 2,665.0 3,985.1 (33.1)
Exch. Market Cap. (QR mn) 677,593.3 681,775.4 (0.6)
Volume (mn) 63.3 133.4 (52.5)
Number of Transactions 28,704 40,292 (28.8)
Companies Traded 42 43 (2.3)
Market Breadth 17:24 21:19 –
Market Indices Close WTD% MTD% YTD%
Total Return 18,827.84 (0.5) 6.1 2.7
All Share Index 3,250.59 (0.2) 6.2 3.2
Banks/Financial Svcs. 3,282.55 0.1 5.3 2.5
Industrials 4,033.06 0.1 6.0 (0.2)
Transportation 2,443.94 (1.5) 4.6 5.4
Real Estate 2,499.35 (1.8) 11.1 11.4
Insurance 4,086.58 3.2 5.8 3.2
Telecoms 1,408.17 (3.1) 2.7 (5.2)
Consumer 7,542.41 1.6 5.7 9.2
Al Rayan Islamic Index 4,396.41 (0.3) 8.9 7.2
Market Indices
Weekly Index Performance
Regional Indices Close WTD% MTD% YTD%
Weekly Exchange
Traded Value ($ mn)
Exchange Mkt.
Cap. ($ mn)
TTM P/E** P/B** Dividend Yield
Qatar (QSE)* 12,496.46 (0.9) 5.0 1.7 731.80 186,134.9 15.4 2.0 3.8
Dubai 3,857.66 (1.2) 5.0 2.2 931.28 94,650.6 12.5 1.4 5.0
Abu Dhabi 4,668.98 0.9 4.8 3.1 325.56 129,660.6 12.3 1.6 3.7
Saudi Arabia#
9,407.87 1.6 6.0 12.9 12,895.85 547,013.0 18.7 2.3 2.9
Kuwait 6,640.92 (0.8) 1.0 1.6 380.13 102,335.9 17.0 1.1 3.8
Oman 6,638.57 (0.3) 1.2 4.7 82.49 25,152.6 10.6 1.5 4.3
Bahrain 1,460.11 0.9 2.5 2.4 6.38 54,117.0 9.9 0.9 4.7
Source: Bloomberg, country exchanges and Zawya (** Trailing Twelve Months; * Value traded ($ mn) do not include special trades, if any) (
#
Data as of February 18, 2014)
12,692.91
12,605.46
12,553.69
12,561.86
12,496.46
0
9,000,000
18,000,000
12,350
12,550
12,750
15-Feb 16-Feb 17-Feb 18-Feb 19-Feb
Volume QSE Index
1.6%
0.9% 0.9%
(0.3%)
(0.8%) (0.9%) (1.2%)(2.0%)
(1.0%)
0.0%
1.0%
2.0%
SaudiArabia
AbuDhabi
Bahrain
Oman
Kuwait
Qatar(QSE)*
Dubai
2. Page 2 of 5
News
Market & Corporate News
Qatari firms hold steady in MSCI’s equity review – Qatar-
based companies remained unchanged in the periodical review
of MSCI’s Emerging Markets Index in February 2015
(announced after-close on February 11). However, as reported
by Arabic business portal Mubasher, the review results were in
contrast to a section of analysts’ expectations of increasing the
percentage of Qatar’s general index and introducing new firms
on the emerging market’s list. The global index compiler’s top
10 constituents of Qatar Index include QNB Group (QNBK),
Industries Qatar (IQCD), Masraf Al Rayan (MARK), Ooredoo
(ORDS), Qatar Islamic Bank (QIBK), Qatar Electricity & Water
Company (QEWS), Vodafone Qatar (VFQS), Commercial Bank
of Qatar (CBQK), Gulf International Services (GISS) and Barwa
Real Estate Company (BRES). Doha Bank (DHBK) makes up
the final constituent of the index. MSCI upgraded Qatar and the
UAE markets from frontier to emerging status during 1H2014
and later it lifted the weights of QNBK, IQCD and QIBK on
foreign ownership reforms. (QNBFS Research, Peninsula
Qatar)
QGTS 2014 profit in-line with our estimate; maintain Market
Perform rating with QR24.70 price target. Nakilat or QGTS
reported 2014 net profit of QR893.6mn, in-line with our estimate
of QR913.3mn (deviation of 2.2%). Net income grew by 22.6%
YoY mainly due to the performance of its LPG vessels along
with the addition of a number of LNG vessels to the company’s
fleet during 2014. Delving into details, we note: (1) Revenue
from wholly-owned vessels came in bang inline with our
estimate of QR2,364.7mn. (2) Share of operating profits from
JVs surged by 44.7% YoY to QR435.2mn (slightly lower than
our estimate by 1.3%). This was driven by significant gains in
LPG shipping rates and expansion of the jointly-held LNG fleet
(through the Maran Nakilat JV). The shipyard business, while
small, also continues to show traction on a YoY basis. (3)
Adjusted EBITDA of QR2,310.9mn (flat YoY) was in-line with
our estimate of QR2,311.1mn. Nakilat announced a cash DPS
of QR1.20/share (as expected) which translates into a yield of
4.9%. A state-of-the-art fleet: Since 2004, QGTS has invested
~$11bn to own 58 state-of-the-art LNG ships, 25 of which are
wholly owned. Around 78% of these vessels are Q-Max/Q-Flex
type, which have the largest capacity in the world. QGTS also
jointly owns four LPG ships (along with Milaha). An April 2014
deal adds a further 3 JV-held LNG vessels bringing the count to
61 (we expect the last two LNG ships to be added in 2015 and
2016).Refinancing, fleet expansion and upside from the
shipyard are catalysts. During 2013, QGTS refinanced
$917mn in bank debt at attractive rates. We note Nakilat retains
the ability to expand its fleet targeting international clients
without expending much capex (e.g. the Maran Nakilat deal,
which allows QGTS to double JV fleet size to 8 LNG tankers,
while upping stake to 40% through a $1.33bn refinancing). The
April 2014 $807mn refinancing is also of a similar nature. We
remain positive longer-term on the shipbuilding business; in
April 2014, QGTS signed a major MOU with Qatar Armed
Forces to build 7 vessels (QR3.1bn).
UDCD reports QR626mn net profit in FY2014 – United
Development Company (UDCD) reported a net profit
attributable to equity holders of QR626mn in FY2014 as
compared to QR323mn in FY2013. Revenue for FY2014 stood
at QR1.9bn. The company reported a gross profit of QR1.1bn,
while total assets stood at QR19bn. The company proposed a
cash dividend of QR1.25/share. (Peninsula Qatar)
Qatar’s banking sector loan book drops 1.4% in January –
Qatar’s banking sector’s loan book declined by 1.4% MoM in
January 2015, pulled down by the public sector, while it was up
13.1% YoY for full year 2014 (FY2014). Deposits also
decreased by 2.2% MoM, (+9.6% YoY in FY2014) in January
2015. Public sector deposits had dropped by 5.9% MoM in
January 2015 (down 0.9% YoY in FY2014). Thus, the loan-to-
deposit ratio (LDR) grew to 110% as compared to 109% at the
end of 2014. (Gulf-Times.com)
QATI shareholders approve capital increase – Qatar
Insurance Company’s (QATI) shareholders have approved an
increase in the company’s capital to QR1.85bn from QR1.6bn
at their annual general meeting (AGM). The AGM also
approved the board’s recommendation to distribute cash
dividends of 25% of the share par value (QR2.5 per share) and
bonus shares of 15% of the share capital (three shares for
every 20 shares). Further, the AGM also approved an
amendment to the company’s Articles of Association to reflect
an increase in the level of permitted non-Qatari investment in
QATI, among others. (Gulf-Times.com)
Al-Sada: QEWS plays vital role – The Minister of Energy &
Industry and Board Chairman of Qatar Electricity & Water
Company (QEWS) HE Dr. Mohammed Saleh Al-Sada said
QEWS had played a vital and important role in supporting the
national economy. It has successfully met the steady increase
in demand for electricity and water. Furthermore, the ongoing
expansion works of the Ras Abu Fontas (A2) water plant, fully
owned by QEWS, will be completed shortly. He said QEWS
had signed contracts for the construction of the plant to
generate 36mn gallons daily (MIGD) of water in January 2013.
Almost 98% of the work had already been completed. The
project, being built at a cost of $504mn, is expected to be
completed in June 2015. The minister also informed that the
Integrated Electricity and Water Plant in the Economic Zone,
Water Desalination and Treatment Plant at the Ras Laffan
Industrial City (RLC) and the expansion of the Ras Abu Fontas
Water Desalination Plant (A3) are currently underway. The
company has also begun to study the possibility of entering into
domestic, regional and international projects to generate
electricity from renewable alternative energy sources like solar
and wind power, in addition to coal. In principle, QEWS also
endorsed a partnership project with Qatar Petroleum to
establish a local company specialized in building solar power
plants with a capital of QR500mn. (Peninsula Qatar)
GWCS begins tendering LVQ 5th phase expansion,
approves dividend distribution – Gulf Warehousing
Company’s (GWCS) Chairman Sheikh Abdulla bin Fahad bin
Jassem bin Jabor al-Thani said that the company has begun
the process of tendering the fifth phase of expansion of its
Logistics Village Qatar (LVQ) project. In 2014, GWCS
completed LVQ Phase 4 and expanded warehousing facilities
at Ras Laffan Industrial City site. Meanwhile, the General
Assembly approved the cash DPS of QR1.50. (QNBFS
Research, Gulf-Times.com)
Ahlibank sees top line growth in Qatar’s banking industry –
Ahlibank said it is modest but optimistic about the top line
growth of the country’s banking industry despite weaker crude.
The bank does not think that there will be slowdown of growth
(in the banking industry) because Qatar is managing its fiscal
position in a very intelligent way and therefore the bank is
optimistic that it will be recording positive growth. (Gulf-
Times.com)
3. Page 3 of 5
Qatar Stock Exchange
Top 5 Gainers Top 5 Decliners
Source: Qatar Stock Exchange (QSE) Source: Qatar Stock Exchange (QSE)
Most Active Shares by Value (QR Million) Most Active Shares by Volume (Million)
Source: Qatar Stock Exchange (QSE) Source: Qatar Stock Exchange (QSE)
Investor Trading Percentage to Total Value Traded Net Traded Value by Nationality (QR Million)
Source: Qatar Stock Exchange (QSE) Source: Qatar Stock Exchange (QSE)
7.1%
4.1% 4.0%
3.1% 3.0%
0.0%
3.0%
6.0%
9.0%
Medicare
Group
Qatari
Investors
Group
Qatar
Insurance
Al Ahli Bank Al Khaliji
-7.9%
-5.7%
-5.4%
-5.1%
-3.9%
-9.0%
-6.0%
-3.0%
0.0%
Gulf International
Services
Vodafone Qatar Qatar & Oman
Investment
Mazaya Qatar Mesaieed
Petrochemical
Holding Company
266.4
222.7
193.2
135.2
124.7
0.0
90.0
180.0
270.0
Gulf
International
Services
Vodafone
Qatar
Barwa Real
Estate
Dlala Holding QNB Group
12.5
5.5
4.3 4.0 3.6
0.0
5.0
10.0
15.0
Vodafone Qatar Ezdan Real
Estate
Qatar Gas
Transport
(Nakilat)
Barwa Real
Estate
Mazaya Qatar
0%
20%
40%
60%
80%
100%
Buy Sell
43.50% 45.66%
24.76% 25.30%
15.39% 13.77%
16.35% 15.27%
Qatari Individuals Qatari Institutions
Non-Qatari Individuals Non-Qatari Institutions
1,819
846
1,891
774
(72)
72
(500) - 500 1,000 1,500 2,000
Qatari
Non-Qatari
Net Investment Total Sold Total Bought
4. Page 4 of 5
TECHNICAL ANALYSIS OF THE QSE INDEX
Source: Bloomberg
The QSE Index ended the week at 12,496.46 and lost 0.88% from last week’s close. The Index created a Bearish Engulfing candlestick for the week, which
signifies buyers’ weakness specifically after the indecision that the Doji candlestick created the week before. The good news is that the drop was coupled
with low volumes compared to the week before. However, that does not indicate an upwards reversal in the coming week. Technical indicators are flat but
giving more bearish signs as the Index could not break above the 55SMA or the 21SMA. The index faces tough resistance at the 12,800 level while the
expected support lies at the 12,000 level.
DEFINITIONS OF KEY TERMS USED IN TECHNICAL ANALYSIS
RSI (Relative Strength Index) indicator – RSI is a momentum oscillator that measures the speed and change of price movements. The RSI oscillates
between 0 to 100. The index is deemed to be overbought once the RSI approaches the 70 level, indicating that a correction is likely. On the other hand, if
the RSI approaches 30, it is an indication that the index may be getting oversold and therefore likely to bounce back.
MACD (Moving Average Convergence Divergence) indicator – The indicator consists of the MACD line and a signal line. The divergence or the
convergence of the MACD line with the signal line indicates the strength in the momentum during the uptrend or downtrend, as the case may be. When the
MACD crosses the signal line from below and trades above it, it gives a positive indication. The reverse is the situation for a bearish trend.
Candlestick chart – A candlestick chart is a price chart that displays the high, low, open, and close for a security. The ‘body’ of the chart is portion between
the open and close price, while the high and low intraday movements form the ‘shadow’. The candlestick may represent any time frame. We use a one-day
candlestick chart (every candlestick represents one trading day) in our analysis.
Doji candlestick pattern – A Doji candlestick is formed when a security's open and close are practically equal. The pattern indicates indecisiveness, and
based on preceding price actions and future confirmation, may indicate a bullish or bearish trend reversal.
Shooting Star/Inverted Hammer candlestick patterns – These candlestick patterns have a small real body (open price and close price are near to each
other), and a long upper shadow (large intraday movement on the upside). The Shooting Star is a bearish reversal pattern that forms after a rally. The
Inverted Hammer looks exactly like a Shooting Star, but forms after a downtrend. Inverted Hammers represent a potential bullish trend reversal.
5. Contacts
Saugata Sarkar Abdullah Amin, CFA Shahan Keushgerian
Head of Research Senior Research Analyst Senior Research Analyst
Tel: (+974) 4476 6534 Tel: (+974) 4476 6569 Tel: (+974) 4476 6509
saugata.sarkar@qnbfs.com.qa abdullah.amin@qnbfs.com.qa shahan.keushgerian@qnbfs.com.qa
Sahbi Kasraoui Ahmed Al-Khoudary QNB Financial Services SPC
Manager – HNWI Head of Sales Trading – Institutional Contact Center: (+974) 4476 6666
Tel: (+974) 4476 6544 Tel: (+974) 4476 6548 PO Box 24025
sahbi.alkasraoui@qnbfs.com.qa ahmed.alkhoudary@qnbfs.com.qa Doha, Qatar
Disclaimer and Copyright Notice: This publication has been prepared by QNB Financial Services SPC (“QNBFS”) a wholly-owned subsidiary of QNB SAQ (“QNB”). QNBFS is
regulated by the Qatar Financial Markets Authority and the Qatar Exchange QNB SAQ is regulated by the Qatar Central Bank. This publication expresses the views and opinions of
QNBFS at a given time only. It is not an offer, promotion or recommendation to buy or sell securities or other investments, nor is it intended to constitute legal, tax, accounting, or
financial advice. QNBFS accepts no liability whatsoever for any direct or indirect losses arising from use of this report. Any investment decision should depend on the individual
circumstances of the investor and be based on specifically engaged investment advice. We therefore strongly advise potential investors to seek independent professional advice
before making any investment decision. Although the information in this report has been obtained from sources that QNBFS believes to be reliable, we have not independently
verified such information and it may not be accurate or complete. QNBFS does not make any representations or warranties as to the accuracy and completeness of the information
it may contain, and declines any liability in that respect. For reports dealing with Technical Analysis, expressed opinions and/or recommendations may be different or contrary to
the opinions/recommendations of QNBFS Fundamental Research as a result of depending solely on the historical technical data (price and volume). QNBFS reserves the right to
amend the views and opinions expressed in this publication at any time. It may also express viewpoints or make investment decisions that differ significantly from, or even
contradict, the views and opinions included in this report. This report may not be reproduced in whole or in part without permission from QNBFS.
COPYRIGHT: No part of this document may be reproduced without the explicit written permission of QNBFS.
Page 5 of 5
Source: Bloomberg
Com pany Nam e
Price
(February 19)
% Change
5-Day
% Change
YTD
Market Cap.
QR Million TTM P/E P/B Div. Yield
Qatar National Bank 202.10 1.51 (5.07) 141,415 13.5 2.5 3.7
Qatar Islamic Bank 106.40 (2.92) 4.11 25,142 15.8 2.0 3.8
Commercial Bank of Qatar 68.20 (2.99) (0.44) 20,251 10.8 1.2 2.4
Doha Bank 58.30 0.17 2.28 15,063 11.1 1.3 7.7
Al Ahli Bank 56.20 3.12 2.93 9,284 15.4 2.2 N/A
Qatar International Islamic Bank 87.60 0.69 7.22 13,260 16.1 2.5 4.3
Masraf Al Rayan 48.70 (0.61) 10.18 36,525 18.2 3.2 3.1
Al Khaliji Bank 22.42 3.03 1.68 8,071 14.2 1.4 4.5
National Leasing 21.71 (1.94) 8.55 1,074 24.9 0.9 6.9
Dlala Holding 45.05 1.01 5.26 1,000 15.0 3.3 N/A
Qatar & Oman Investment 15.15 (5.43) (1.62) 477 18.4 1.3 4.0
Islamic Holding Group 117.80 (1.75) (5.38) 471 29.3 7.0 2.5
Banking and Financial Services 272,034
Zad Holding 88.50 1.14 5.36 1,158 10.7 0.9 4.0
Qatar German Co. for Medical Devices 10.90 (2.68) 7.39 126 N/A 0.8 N/A
Salam International Investment 14.99 (1.38) (5.43) 1,714 22.3 1.0 6.7
Medicare Group 146.10 7.11 24.87 4,112 22.7 4.4 1.2
Qatar Cinema & Film Distribution 46.80 0.00 6.36 267 21.7 1.9 N/A
Qatar Fuel 222.00 1.42 8.66 18,750 16.3 2.8 3.5
Qatar Meat and Livestock 61.80 (1.90) 2.32 1,112 20.7 4.3 3.4
Al Meera Consumer Goods 215.00 (0.65) 7.50 4,300 15.9 3.2 3.7
Consum er Goods and Services 31,539
Qatar Industrial Manufacturing 49.40 0.20 13.96 2,347 14.6 1.6 N/A
Qatar National Cement 138.70 1.99 5.08 6,810 16.2 2.6 4.3
Industries Qatar 153.30 0.52 (8.75) 92,747 14.6 2.8 7.2
Qatari Investors Group 42.10 4.08 1.69 5,234 23.1 2.3 1.8
Qatar Electricity and Water 193.00 (3.02) 2.93 21,230 13.5 3.1 3.9
Mannai Corp. 106.80 (0.09) (2.02) 4,872 9.2 2.4 5.1
Aamal 18.33 (0.11) 20.67 10,998 19.1 1.5 N/A
Gulf International Services 97.60 (7.92) 0.51 18,138 13.0 5.0 5.6
Mesaieed Petrochemical Holding 28.15 (3.92) -4.6 35,365 19.7 2.4 5.2
Industrials 197,742
Qatar Insurance 93.70 19.59 18.93 15,043 17.3 3.0 2.3
Doha Insurance 27.00 0.00 (6.90) 1,350 10.5 1.3 7.4
Qatar General Insurance & Reinsurance 61.00 1.67 3.39 4,220 4.8 0.7 2.0
Al Khaleej Takaful Insurance 54.10 2.46 6.50 1,201 16.2 1.8 N/A
Qatar Islamic Insurance 87.00 2.35 10.13 1,305 17.8 4.2 4.3
Insurance 23,118
United Development 24.10 (2.94) 2.16 8,533 13.6 0.8 4.0
Barw a Real Estate 48.20 (0.31) 15.04 18,756 13.7 1.4 4.1
Ezdan Real Estate 16.75 (2.16) 12.27 44,429 33.0 1.4 1.9
Mazaya Qatar Real Estate Development 19.74 (5.05) 3.08 1,974 9.2 1.6 3.8
Real Estate 73,693
Qatar Telecom 113.50 (2.16) (8.39) 36,356 14.3 1.5 3.5
Vodafone Qatar 17.40 (5.69) 5.78 14,710 N/A 2.6 1.0
Telecom s 51,066
Qatar Navigation (Milaha) 104.50 (0.38) 5.03 11,968 12.0 0.9 4.8
Gulf Warehousing 58.00 (3.33) 2.84 2,759 19.7 3.2 2.6
Qatar Gas Transport (Nakilat) 24.42 (2.51) 5.71 13,675 15.2 3.6 4.5
Transportation 28,402
Qatar Exchange 677,593