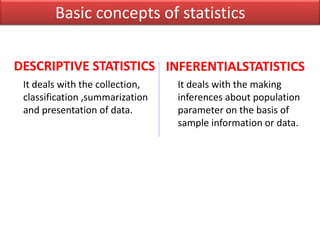
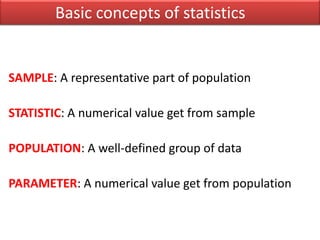
INTRODUCTION
TO
S P S S
STATISTICAL PAKAGE FOR SOCIAL SCIENCE
STATISTICAL PRODUCT AND SERVICE SOLUTION
NOW
Why we use SPSS???
• SPSS makes our work easy and save our
precious time
• SPSS presents best tabulated and graphical
output
• SPSS helps the users to analyze and
manipulate the data within seconds.
• Basic concepts of statistics
• Sources of data for research
• How to Use data in SPSS???
• Description and practical of entering and editing
statistical data in SPSS.
• Basic concept of measuring scales
• Analysis and manipulation of data in SPSS
• Questionnaire Design and SPSS
• Descriptive statistics and frequency distribution in SPSS
• Correlation and Regression techniques in SPSS
• Testing of hypothesis t-test and z-test in SPSS
What is statistics???
The branch of science which
deals with the collection ,
organization ,summarization,
analysis and interpretation of
data.
Basic concepts of statistics
DESCRIPTIVE STATISTICS
It deals with the collection,
classification ,summarization
and presentation of data.
INFERENTIALSTATISTICS
It deals with the making
inferences about population
parameter on the basis of
sample information or data.
Basic concepts of statistics
SAMPLE: A representative part of population
STATISTIC: A numerical value get from sample
POPULATION: A well-defined group of data
PARAMETER: A numerical value get from population
Basic concepts of statistics
Statistical data or simply
data are the observations
or recorded values of our
interest.
Basic concepts of statistics
QUANTITATIVE DATA
Variable which we can
measure is Quantitative data.
Example:
Height ,weight ,
velocity, speed
e.t.c
QUALITATIVE DATA
Variable which we cannot
measure is Qualitative data.
Example:
Beauty, intelligence ,
happiness , satisfaction
e.t.c
DATA
Basic concepts of statistics
A characteristics of the individual of
the population which can varies
from person to person , objects to
objects and place to place is termed
as variable.
Basic concepts of statistics
Variable
DISCRETE VARIABLE
A variable which can count but
not measure is termed as
discrete variable.
Examples:
 No. of students in a school
 No. of products sold
 Name of days in a year
CONTINUOUS VARIABLE
A variable which cannot count
but measure is termed as
continuous variable.
Examples:
 Height of student in a school
 Weight of products
 Length of plot
Basic concepts of statistics
There are two main sources
Primary source of data Secondary source of data
RESEARCHER
DECISION MAKING
PRIMARY DATA SECONDARY DATA
• It is published or
unpublished data compiled
by some other agencies or
organization for some other
purposes
• It involves direct
investigation or first hand
data or afresh data obtained
by researcher.
PRIMARY SOURCE OF DATA COLLECTION
1) METHOD OF SAMPLE SURVEY
2) METHOD OF EXPERIMENTATION
• SAMPLING DESIGN
• MEASUREMENT SCALES
• QUESTIONNAIRE DESIGN
• QUESTIONNAIRE ADMINISTRATION
1) METHOD OF SAMPLE SURVEY
• LABORATORY EXPERIMENT
• FIELD EXPERIMENT
2) METHOD OF EXPERIMENTATION
Data editor
Output viewer
Syntax editor
Script window
• Data Editor
Spreadsheet-like system for defining, entering, editing,
and displaying data. Extension of the saved file will be
“sav.”
• Output Viewer
Displays output and errors. Extension of the saved file will
be “spv.”
• Syntax Editor
Text editor for syntax composition. Extension of the
saved file will be “sps.”
• Script Window
Provides the opportunity to write full-blown programs,
in a BASIC-like language. Text editor for syntax
composition. Extension of the saved file will be “sbs.”
• Rows are cases: Each row represents a case or an
observation. For example, each individual respondent
to a questionnaire is a case.
• Columns are variables: Each column represents a
variable or characteristic that is being measured. For
example, each item on a questionnaire is a variable.
• Cells contain values: Each cell contains a single value of
a variable for a case. The cell is where the case and the
variable intersect. Cells contain only data values. Unlike
spreadsheet programs, cells in the Data Editor cannot
contain formulas.
(cases)
C
O
L
U
M
N
S
Working is going
on…………………
thanks
There are three level of measurements

Spss workshop by riaz

  • 4.
  • 5.
    STATISTICAL PAKAGE FORSOCIAL SCIENCE STATISTICAL PRODUCT AND SERVICE SOLUTION NOW
  • 6.
    Why we useSPSS??? • SPSS makes our work easy and save our precious time • SPSS presents best tabulated and graphical output • SPSS helps the users to analyze and manipulate the data within seconds.
  • 7.
    • Basic conceptsof statistics • Sources of data for research • How to Use data in SPSS??? • Description and practical of entering and editing statistical data in SPSS. • Basic concept of measuring scales • Analysis and manipulation of data in SPSS • Questionnaire Design and SPSS • Descriptive statistics and frequency distribution in SPSS • Correlation and Regression techniques in SPSS • Testing of hypothesis t-test and z-test in SPSS
  • 8.
    What is statistics??? Thebranch of science which deals with the collection , organization ,summarization, analysis and interpretation of data. Basic concepts of statistics
  • 9.
    DESCRIPTIVE STATISTICS It dealswith the collection, classification ,summarization and presentation of data. INFERENTIALSTATISTICS It deals with the making inferences about population parameter on the basis of sample information or data. Basic concepts of statistics
  • 10.
    SAMPLE: A representativepart of population STATISTIC: A numerical value get from sample POPULATION: A well-defined group of data PARAMETER: A numerical value get from population Basic concepts of statistics
  • 11.
    Statistical data orsimply data are the observations or recorded values of our interest. Basic concepts of statistics
  • 12.
    QUANTITATIVE DATA Variable whichwe can measure is Quantitative data. Example: Height ,weight , velocity, speed e.t.c QUALITATIVE DATA Variable which we cannot measure is Qualitative data. Example: Beauty, intelligence , happiness , satisfaction e.t.c DATA Basic concepts of statistics
  • 13.
    A characteristics ofthe individual of the population which can varies from person to person , objects to objects and place to place is termed as variable. Basic concepts of statistics
  • 14.
    Variable DISCRETE VARIABLE A variablewhich can count but not measure is termed as discrete variable. Examples:  No. of students in a school  No. of products sold  Name of days in a year CONTINUOUS VARIABLE A variable which cannot count but measure is termed as continuous variable. Examples:  Height of student in a school  Weight of products  Length of plot Basic concepts of statistics
  • 15.
    There are twomain sources Primary source of data Secondary source of data RESEARCHER DECISION MAKING
  • 16.
    PRIMARY DATA SECONDARYDATA • It is published or unpublished data compiled by some other agencies or organization for some other purposes • It involves direct investigation or first hand data or afresh data obtained by researcher.
  • 17.
    PRIMARY SOURCE OFDATA COLLECTION 1) METHOD OF SAMPLE SURVEY 2) METHOD OF EXPERIMENTATION
  • 18.
    • SAMPLING DESIGN •MEASUREMENT SCALES • QUESTIONNAIRE DESIGN • QUESTIONNAIRE ADMINISTRATION 1) METHOD OF SAMPLE SURVEY
  • 19.
    • LABORATORY EXPERIMENT •FIELD EXPERIMENT 2) METHOD OF EXPERIMENTATION
  • 20.
  • 21.
    • Data Editor Spreadsheet-likesystem for defining, entering, editing, and displaying data. Extension of the saved file will be “sav.”
  • 22.
    • Output Viewer Displaysoutput and errors. Extension of the saved file will be “spv.”
  • 23.
    • Syntax Editor Texteditor for syntax composition. Extension of the saved file will be “sps.”
  • 24.
    • Script Window Providesthe opportunity to write full-blown programs, in a BASIC-like language. Text editor for syntax composition. Extension of the saved file will be “sbs.”
  • 25.
    • Rows arecases: Each row represents a case or an observation. For example, each individual respondent to a questionnaire is a case. • Columns are variables: Each column represents a variable or characteristic that is being measured. For example, each item on a questionnaire is a variable. • Cells contain values: Each cell contains a single value of a variable for a case. The cell is where the case and the variable intersect. Cells contain only data values. Unlike spreadsheet programs, cells in the Data Editor cannot contain formulas.
  • 26.
  • 30.