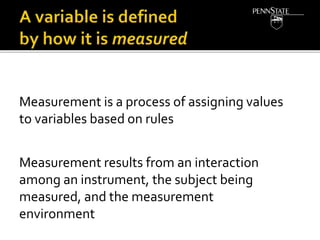
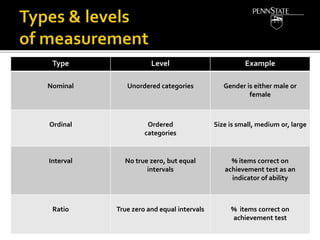
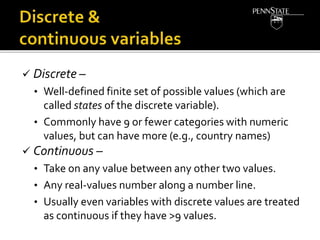
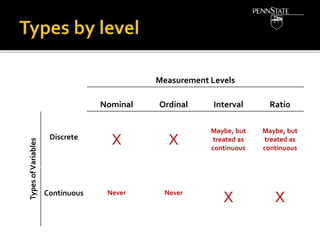
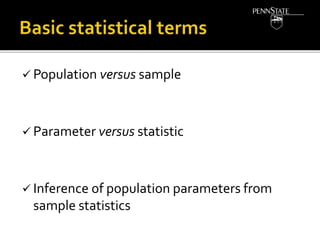
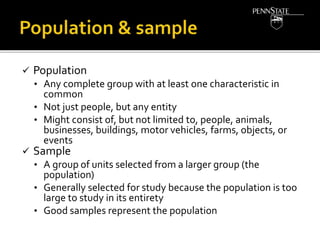
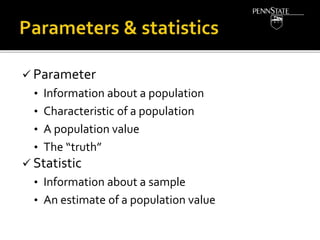
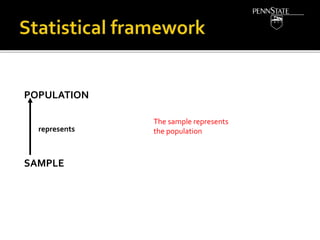
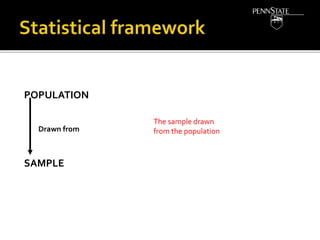
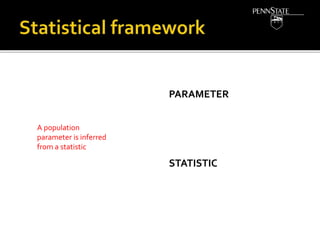
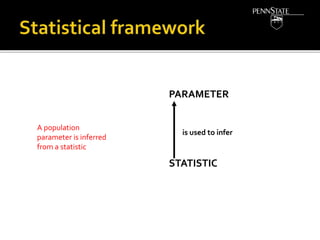
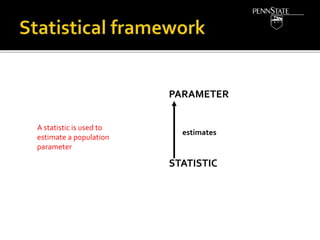
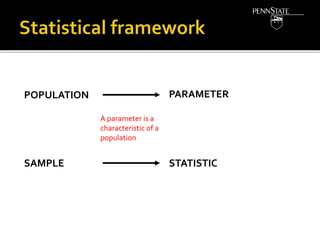
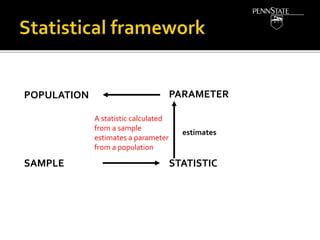
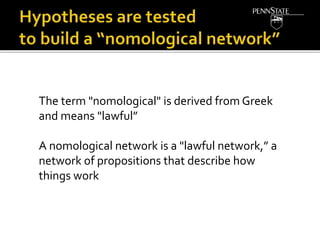
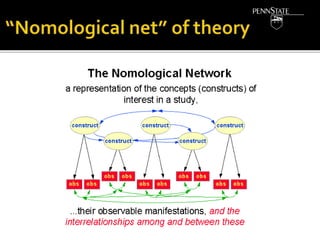
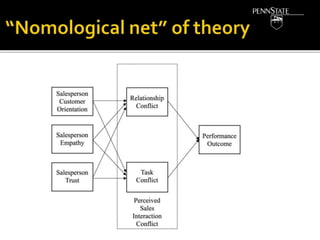
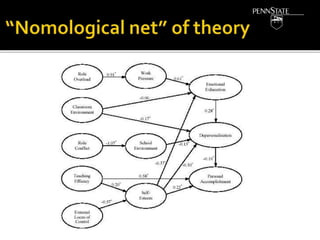
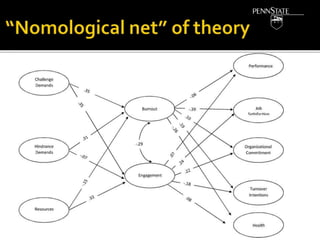
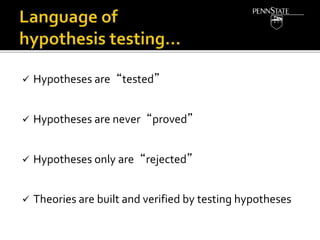
DATA ANALYSIS
12 November 2018
How is a variable measured?
Some statistical concepts
What is a theory?
Some important sources for PhD students
An entity that has two or more mutually
exclusive values
Measurement is a process of assigning values
to variables based on rules
Measurement results from an interaction
among an instrument, the subject being
measured, and the measurement
environment
Type Level Example
Nominal Unordered categories Gender is either male or
female
Ordinal Ordered
categories
Size is small, medium or, large
Interval No true zero, but equal
intervals
% items correct on
achievement test as an
indicator of ability
Ratio True zero and equal intervals % items correct on
achievement test
 Discrete –
• Well-defined finite set of possible values (which are
called states of the discrete variable).
• Commonly have 9 or fewer categories with numeric
values, but can have more (e.g., country names)
 Continuous –
• Take on any value between any other two values.
• Any real-values number along a number line.
• Usually even variables with discrete values are treated
as continuous if they have >9 values.
Measurement Levels
Nominal Ordinal Interval Ratio
TypesofVariables
Discrete
X X
Maybe, but
treated as
continuous
Maybe, but
treated as
continuous
Continuous Never Never
X X
TERMS, DEFINITIONS,AND APPROACH
 Population versus sample
 Parameter versus statistic
 Inference of population parameters from
sample statistics
 Population
• Any complete group with at least one characteristic in
common
• Not just people, but any entity
• Might consist of, but not limited to, people, animals,
businesses, buildings, motor vehicles, farms, objects, or
events
 Sample
• A group of units selected from a larger group (the
population)
• Generally selected for study because the population is too
large to study in its entirety
• Good samples represent the population
 Parameter
• Information about a population
• Characteristic of a population
• A population value
• The “truth”
 Statistic
• Information about a sample
• An estimate of a population value
POPULATION
SAMPLE
represents
The sample represents
the population
POPULATION
SAMPLE
Drawn from
The sample drawn
from the population
PARAMETER
STATISTIC
A population
parameter is inferred
from a statistic
PARAMETER
STATISTIC
is used to infer
A population
parameter is inferred
from a statistic
PARAMETER
STATISTIC
estimates
A statistic is used to
estimate a population
parameter
POPULATION
SAMPLE
PARAMETER
STATISTIC
A parameter is a
characteristic of a
population
POPULATION
SAMPLE
PARAMETER
STATISTIC
A statistic calculated
from a sample
estimates a parameter
from a population
estimates
 Data usually are available from a sample, not a
population
 That is, sample statistics are available, not population
parameters
 We wish to infer (or estimate) parameters from
statistics
 Because data are available from a sample, not the
population, error occurs when inferring (or estimating)
population parameters from sample statistics
 Statistical techniques help us make decisions under
error and uncertainty
THEORY, PROPOSITIONS, LOGIC
 Are composed of propositions that explain the
empirical, observable world. A proposition is an
“if–then” statement
 Are networks showing relationship and causality
among propositions
 Must have“empirical import”
 The foundation of theory-building
 Statements of testable scientific propositions
 The focus for empirical work
 Examine propositions in theory that require
verification.
 Are specific.
 Are testable.
The term "nomological" is derived from Greek
and means "lawful”
A nomological network is a "lawful network,” a
network of propositions that describe how
things work
 Hypotheses are“tested”
 Hypotheses are never“proved”
 Hypotheses only are“rejected”
 Theories are built and verified by testing hypotheses
— FAMILIARITY ESSENTIAL FOR PhD STUDENTS
— LINKSTO DOCUMENTSON PIAZZA
 Good (not easy)
explanation in Ch 1 +
Ch 2
DATA ANALYSIS
12 November 2018

Some Research Concepts

  • 1.
  • 2.
    How is avariable measured? Some statistical concepts What is a theory? Some important sources for PhD students
  • 4.
    An entity thathas two or more mutually exclusive values
  • 5.
    Measurement is aprocess of assigning values to variables based on rules Measurement results from an interaction among an instrument, the subject being measured, and the measurement environment
  • 6.
    Type Level Example NominalUnordered categories Gender is either male or female Ordinal Ordered categories Size is small, medium or, large Interval No true zero, but equal intervals % items correct on achievement test as an indicator of ability Ratio True zero and equal intervals % items correct on achievement test
  • 7.
     Discrete – •Well-defined finite set of possible values (which are called states of the discrete variable). • Commonly have 9 or fewer categories with numeric values, but can have more (e.g., country names)  Continuous – • Take on any value between any other two values. • Any real-values number along a number line. • Usually even variables with discrete values are treated as continuous if they have >9 values.
  • 8.
    Measurement Levels Nominal OrdinalInterval Ratio TypesofVariables Discrete X X Maybe, but treated as continuous Maybe, but treated as continuous Continuous Never Never X X
  • 9.
  • 10.
     Population versussample  Parameter versus statistic  Inference of population parameters from sample statistics
  • 11.
     Population • Anycomplete group with at least one characteristic in common • Not just people, but any entity • Might consist of, but not limited to, people, animals, businesses, buildings, motor vehicles, farms, objects, or events  Sample • A group of units selected from a larger group (the population) • Generally selected for study because the population is too large to study in its entirety • Good samples represent the population
  • 12.
     Parameter • Informationabout a population • Characteristic of a population • A population value • The “truth”  Statistic • Information about a sample • An estimate of a population value
  • 13.
  • 14.
    POPULATION SAMPLE Drawn from The sampledrawn from the population
  • 15.
  • 16.
    PARAMETER STATISTIC is used toinfer A population parameter is inferred from a statistic
  • 17.
    PARAMETER STATISTIC estimates A statistic isused to estimate a population parameter
  • 18.
  • 19.
    POPULATION SAMPLE PARAMETER STATISTIC A statistic calculated froma sample estimates a parameter from a population estimates
  • 20.
     Data usuallyare available from a sample, not a population  That is, sample statistics are available, not population parameters  We wish to infer (or estimate) parameters from statistics  Because data are available from a sample, not the population, error occurs when inferring (or estimating) population parameters from sample statistics  Statistical techniques help us make decisions under error and uncertainty
  • 21.
  • 22.
     Are composedof propositions that explain the empirical, observable world. A proposition is an “if–then” statement  Are networks showing relationship and causality among propositions  Must have“empirical import”
  • 23.
     The foundationof theory-building  Statements of testable scientific propositions  The focus for empirical work
  • 24.
     Examine propositionsin theory that require verification.  Are specific.  Are testable.
  • 25.
    The term "nomological"is derived from Greek and means "lawful” A nomological network is a "lawful network,” a network of propositions that describe how things work
  • 30.
     Hypotheses are“tested” Hypotheses are never“proved”  Hypotheses only are“rejected”  Theories are built and verified by testing hypotheses
  • 31.
    — FAMILIARITY ESSENTIALFOR PhD STUDENTS — LINKSTO DOCUMENTSON PIAZZA
  • 32.
     Good (noteasy) explanation in Ch 1 + Ch 2
  • 34.