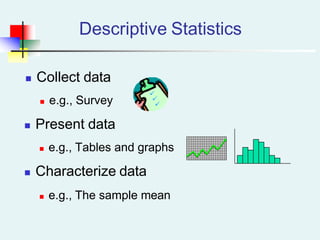
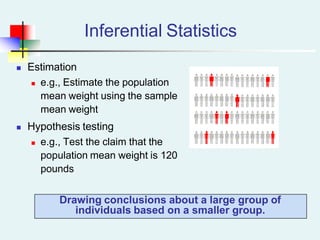
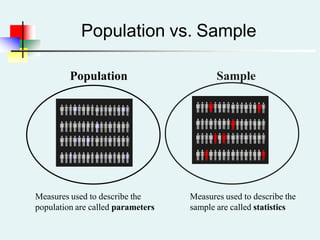
Introduction
Learning Objectives
In this chapter you learn:
 How business uses statistics
 The basic vocabulary of statistics
Why Learn Statistics
Make better sense of the world
 Internet articles / reports
 Magazine articles
 Newspaper articles
 Television & radio reports
Make better business decisions
 Business memos
 Business research
 Technical journals
 Technical reports
In Business, Statistics Has
Many Important Uses
 To summarize business data
 To draw conclusions from business data
 To make reliable forecasts about business
activities
 To improve business processes
Two Different Branches Of
Statistics Are Used In Business
Statistics
The branch of mathematics that transforms data into
useful information for decision makers.
Descriptive Statistics
Collecting, summarizing,
presenting and analyzing data
Inferential Statistics
Using data collected from a
small group to draw conclusions
about a larger group
These Two Branches Are Used
In The Important Activities
 To summarize business data
 Descriptive methods used to create charts & tables
 To draw conclusions from business data
 Inferential methods used to reach conclusions about
a large group based on data from a smaller group
 To make reliable forecasts about business
activities
 Inferential methods used to develop, quantify, and
improve the accuracy of predictive models
 To improve business processes
Descriptive Statistics
 Collect data
 e.g., Survey
 Present data
 e.g., Tables and graphs
 Characterize data
 e.g., The sample mean
Inferential Statistics
 Estimation
 e.g., Estimate the population
mean weight using the sample
mean weight
 Hypothesis testing
 e.g., Test the claim that the
population mean weight is 120
pounds
Drawing conclusions about a large group of
individuals based on a smaller group.
Basic Vocabulary of Statistics
VARIABLES
Variables are a characteristics of an item or individual and are what you
analyze when you use a statistical method.
DATA
Data are the different values associated with a variable.
Basic Vocabulary of Statistics
POPULATION
A population consists of all the items or individuals about which
you want to draw a conclusion. The population is the “large
group”
SAMPLE
A sample is the portion of a population selected for analysis. The
sample is the “small group”
PARAMETER
A parameter is a numerical measure that describes a characteristic
of a population.
STATISTIC
A statistic is a numerical measure that describes a characteristic of
a sample.
Population vs. Sample
Population Sample
Measures used to describe the
population are called parameters
Measures used to describe the
sample are called statistics
What is Statistics?
Statistics :
Definition: A collection of tools and techniques that are
used to convert data into meaningful information.
Statistics is the study of collecting, organizing and
summarizing data, used to convert data into a
meaningful information.
What does a statistician do?
• Collects numbers or data
• Systematically organizes or arranges the data
• Analyzes the data…extracts relevant information to
provide a complete numerical description
• Infers general conclusions about the problem using this
numerical description
Different types of data
1. Primary Data
2. Secondary Data
3. Qualitative Data
4. Quantitative Data
Primary and Secondary Data
Data can be classified as either Primary or Secondary.
Primary Data:
Primary data means original data that has been collected
specially for the purpose in mind. It means when an authorized
organization, investigator or an enumerator collects the data for
the first time from the original source. Data collected this way is
called primary data.
For example: Your own questionnaire, survey, information.
Primary and Secondary Data
Secondary Data:
Secondary data is data that has been collected for another purpose.
When we use Statistical Method with Primary Data from another
purpose for our purpose we refer to it as Secondary Data. It means
that one purpose's Primary Data is another purpose's Secondary Data.
Secondary data is data that is being reused. Usually in a different
context.
For example: Data from a Book, Newspaper, Magazine, or Internet.
Qualitative & Quantitative data
Qualitative
Quantitative
Discrete Continous
• Qualitative Data measures a quality or characteristic on each experimental
unit. It is a categorical data.
• Examples:
• Hair color (black, brown, blonde, white, grey, mahogany)
• Make of car (Dodge, Honda, Ford, Toyota)
• Gender (male, female)
• Place of birth (Riyadh, Jeddah, Yanbu)
Qualitative & Quantitative data
Quantitative data is a numerical measurement
expressed in terms of numbers.
For example: Temperature= “26 degrees" Height = "1.8
meters"
Length = “2.5 feet”
Age = “9 years”
Note: Quantitative data always are associated
with a scale measure (degree/feet/years).
Qualitative & Quantitative data
• Quantitative Data measure a numerical quantity on each
experimental unit.
Examples:
For each orange tree, the number of oranges is measured.
– Quantitative
• For a particular day, the number of cars entering a college campus is
measured.
– Quantitative
• Time until a light bulb burns out (4 months)
Qualitative & Quantitative data

introductiontobusinessstatistics-anithanew.pptx

  • 1.
  • 2.
    Learning Objectives In thischapter you learn:  How business uses statistics  The basic vocabulary of statistics
  • 3.
    Why Learn Statistics Makebetter sense of the world  Internet articles / reports  Magazine articles  Newspaper articles  Television & radio reports Make better business decisions  Business memos  Business research  Technical journals  Technical reports
  • 4.
    In Business, StatisticsHas Many Important Uses  To summarize business data  To draw conclusions from business data  To make reliable forecasts about business activities  To improve business processes
  • 5.
    Two Different BranchesOf Statistics Are Used In Business Statistics The branch of mathematics that transforms data into useful information for decision makers. Descriptive Statistics Collecting, summarizing, presenting and analyzing data Inferential Statistics Using data collected from a small group to draw conclusions about a larger group
  • 6.
    These Two BranchesAre Used In The Important Activities  To summarize business data  Descriptive methods used to create charts & tables  To draw conclusions from business data  Inferential methods used to reach conclusions about a large group based on data from a smaller group  To make reliable forecasts about business activities  Inferential methods used to develop, quantify, and improve the accuracy of predictive models  To improve business processes
  • 7.
    Descriptive Statistics  Collectdata  e.g., Survey  Present data  e.g., Tables and graphs  Characterize data  e.g., The sample mean
  • 8.
    Inferential Statistics  Estimation e.g., Estimate the population mean weight using the sample mean weight  Hypothesis testing  e.g., Test the claim that the population mean weight is 120 pounds Drawing conclusions about a large group of individuals based on a smaller group.
  • 9.
    Basic Vocabulary ofStatistics VARIABLES Variables are a characteristics of an item or individual and are what you analyze when you use a statistical method. DATA Data are the different values associated with a variable.
  • 10.
    Basic Vocabulary ofStatistics POPULATION A population consists of all the items or individuals about which you want to draw a conclusion. The population is the “large group” SAMPLE A sample is the portion of a population selected for analysis. The sample is the “small group” PARAMETER A parameter is a numerical measure that describes a characteristic of a population. STATISTIC A statistic is a numerical measure that describes a characteristic of a sample.
  • 11.
    Population vs. Sample PopulationSample Measures used to describe the population are called parameters Measures used to describe the sample are called statistics
  • 12.
    What is Statistics? Statistics: Definition: A collection of tools and techniques that are used to convert data into meaningful information. Statistics is the study of collecting, organizing and summarizing data, used to convert data into a meaningful information.
  • 13.
    What does astatistician do? • Collects numbers or data • Systematically organizes or arranges the data • Analyzes the data…extracts relevant information to provide a complete numerical description • Infers general conclusions about the problem using this numerical description
  • 14.
    Different types ofdata 1. Primary Data 2. Secondary Data 3. Qualitative Data 4. Quantitative Data
  • 15.
    Primary and SecondaryData Data can be classified as either Primary or Secondary. Primary Data: Primary data means original data that has been collected specially for the purpose in mind. It means when an authorized organization, investigator or an enumerator collects the data for the first time from the original source. Data collected this way is called primary data. For example: Your own questionnaire, survey, information.
  • 16.
  • 17.
    Primary and SecondaryData Secondary Data: Secondary data is data that has been collected for another purpose. When we use Statistical Method with Primary Data from another purpose for our purpose we refer to it as Secondary Data. It means that one purpose's Primary Data is another purpose's Secondary Data. Secondary data is data that is being reused. Usually in a different context. For example: Data from a Book, Newspaper, Magazine, or Internet.
  • 18.
    Qualitative & Quantitativedata Qualitative Quantitative Discrete Continous
  • 19.
    • Qualitative Datameasures a quality or characteristic on each experimental unit. It is a categorical data. • Examples: • Hair color (black, brown, blonde, white, grey, mahogany) • Make of car (Dodge, Honda, Ford, Toyota) • Gender (male, female) • Place of birth (Riyadh, Jeddah, Yanbu) Qualitative & Quantitative data
  • 20.
    Quantitative data isa numerical measurement expressed in terms of numbers. For example: Temperature= “26 degrees" Height = "1.8 meters" Length = “2.5 feet” Age = “9 years” Note: Quantitative data always are associated with a scale measure (degree/feet/years). Qualitative & Quantitative data
  • 21.
    • Quantitative Datameasure a numerical quantity on each experimental unit. Examples: For each orange tree, the number of oranges is measured. – Quantitative • For a particular day, the number of cars entering a college campus is measured. – Quantitative • Time until a light bulb burns out (4 months) Qualitative & Quantitative data