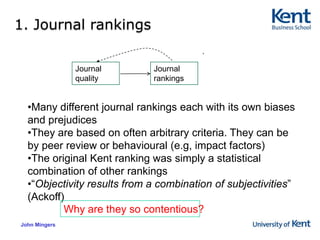
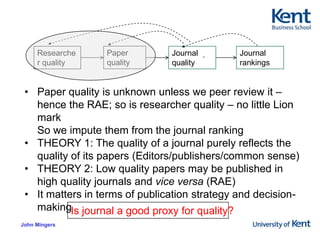
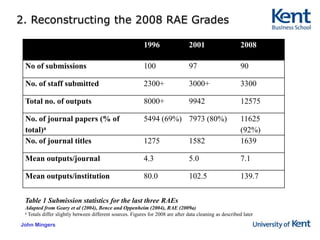
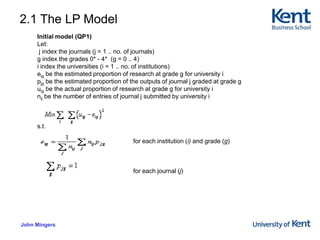
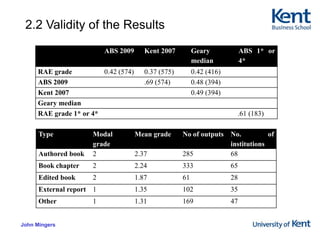
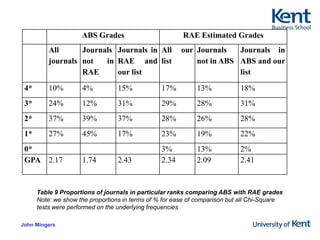
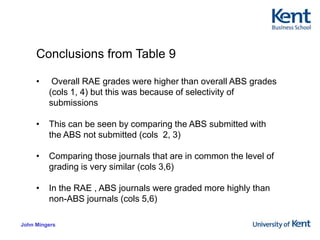
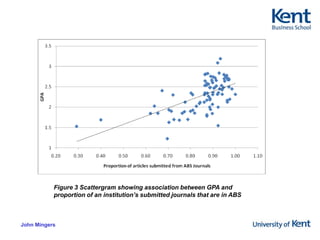
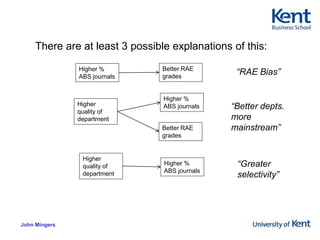
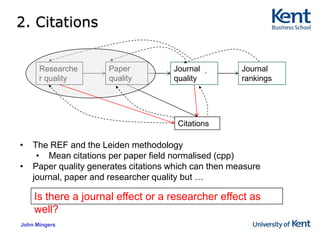
Estimating Business and Management Journal Quality from the 2008 Research Assessment Exercise in the UKProfessor John MingersDirector of ResearchKent Business SchoolCentre for Evaluating Research Performance (CERP)July 2010
1. Journal rankings Journal qualityJournal rankingsMany different journal rankings each with its own biases and prejudices
They are based on often arbitrary criteria. They can be by peer review or behavioural (e.g, impact factors)
The original Kent ranking was simply a statistical combination of other rankings
“Objectivity results from a combination of subjectivities” (Ackoff)Why are they so contentious?
Paper qualityJournal qualityJournal rankingsResearcher qualityPaper quality is unknown unless we peer review it – hence the RAE; so is researcher quality – no little Lion markSo we impute them from the journal ranking
THEORY 1: The quality of a journal purely reflects the quality of its papers (Editors/publishers/common sense)
THEORY 2: Low quality papers may be published in high quality journals and vice versa (RAE)
It matters in terms of publication strategy and decision-making Is journal a good proxy for quality?
2. Reconstructing the 2008 RAE Grades Table 1 Submission statistics for the last three RAEsAdapted from Geary et al (2004), Bence and Oppenheim (2004), RAE (2009a)a Totals differ slightly between different sources. Figures for 2008 are after data cleaning as described later
Table 2 Number of publications by output typeAdapted from Geary et al (2004), Bence and Oppenheim (2004), RAE (2009a). Categories with zero entries have been suppressed
Figure 1 Pareto curve for the number of entries per journal in the 2008 RAE
Figure 2Numbers of journals in the RAE and the ABS list
2.1 The LP Model Initial model (QP1)Let: j index the journals (j = 1 .. no. of journals)g index the grades 0* - 4*  (g = 0 .. 4) i index the universities (i = 1 .. no. of institutions)eig be the estimated proportion of research at grade g for university ipjg be the estimated proportion of the outputs of journal j graded at grade guig be the actual proportion of research at grade g for university inij be the number of entries of journal j submitted by university i  s.t.			for each institution (i) and grade (g)					for each journal (j)
2.2 Validity of the Results
Table 9 Proportions of journals in particular ranks comparing ABS with RAE gradesNote: we show the proportions in terms of % for ease of comparison but all Chi-Square tests were performed on the underlying frequencies
Conclusions from Table 9 Overall RAE grades were higher than overall ABS grades (cols 1, 4) but this was because of selectivity of submissions
This can be seen by comparing the ABS submitted with the ABS not submitted (cols  2, 3)
Comparing those journals that are in common the level of grading is very similar (cols 3,6)
In the RAE , ABS journals were graded more highly than non-ABS journals (cols 5,6)Figure 3 Scattergram showing association between GPA and proportion of an institution’s submitted journals that are in ABS
There are at least 3 possible explanations of this:Better RAE gradesHigher % ABS journals“RAE Bias”Higher % ABS journalsHigher  quality of department“Better depts. more mainstream”Better RAE gradesHigher  quality of department“Greater selectivity”Higher % ABS journals
2. Citations Paper qualityJournal qualityJournal rankingsResearcher qualityCitationsThe REF and the Leiden methodology
Mean citations per paper field normalised (cpp)
Paper quality generates citations which can then measure journal, paper and researcher quality but …Is there a journal effect or a researcher effect as well?

Paper 8: Business and Management Journal Quality (Mingers)

  • 1.
    Estimating Business andManagement Journal Quality from the 2008 Research Assessment Exercise in the UKProfessor John MingersDirector of ResearchKent Business SchoolCentre for Evaluating Research Performance (CERP)July 2010
  • 2.
    1. Journal rankingsJournal qualityJournal rankingsMany different journal rankings each with its own biases and prejudices
  • 3.
    They are basedon often arbitrary criteria. They can be by peer review or behavioural (e.g, impact factors)
  • 4.
    The original Kentranking was simply a statistical combination of other rankings
  • 5.
    “Objectivity results froma combination of subjectivities” (Ackoff)Why are they so contentious?
  • 6.
    Paper qualityJournal qualityJournalrankingsResearcher qualityPaper quality is unknown unless we peer review it – hence the RAE; so is researcher quality – no little Lion markSo we impute them from the journal ranking
  • 7.
    THEORY 1: Thequality of a journal purely reflects the quality of its papers (Editors/publishers/common sense)
  • 8.
    THEORY 2: Lowquality papers may be published in high quality journals and vice versa (RAE)
  • 9.
    It matters interms of publication strategy and decision-making Is journal a good proxy for quality?
  • 10.
    2. Reconstructing the2008 RAE Grades Table 1 Submission statistics for the last three RAEsAdapted from Geary et al (2004), Bence and Oppenheim (2004), RAE (2009a)a Totals differ slightly between different sources. Figures for 2008 are after data cleaning as described later
  • 11.
    Table 2 Numberof publications by output typeAdapted from Geary et al (2004), Bence and Oppenheim (2004), RAE (2009a). Categories with zero entries have been suppressed
  • 12.
    Figure 1 Paretocurve for the number of entries per journal in the 2008 RAE
  • 13.
    Figure 2Numbers ofjournals in the RAE and the ABS list
  • 15.
    2.1 The LPModel Initial model (QP1)Let: j index the journals (j = 1 .. no. of journals)g index the grades 0* - 4* (g = 0 .. 4) i index the universities (i = 1 .. no. of institutions)eig be the estimated proportion of research at grade g for university ipjg be the estimated proportion of the outputs of journal j graded at grade guig be the actual proportion of research at grade g for university inij be the number of entries of journal j submitted by university i  s.t. for each institution (i) and grade (g) for each journal (j)
  • 16.
    2.2 Validity ofthe Results
  • 18.
    Table 9 Proportionsof journals in particular ranks comparing ABS with RAE gradesNote: we show the proportions in terms of % for ease of comparison but all Chi-Square tests were performed on the underlying frequencies
  • 19.
    Conclusions from Table9 Overall RAE grades were higher than overall ABS grades (cols 1, 4) but this was because of selectivity of submissions
  • 20.
    This can beseen by comparing the ABS submitted with the ABS not submitted (cols 2, 3)
  • 21.
    Comparing those journalsthat are in common the level of grading is very similar (cols 3,6)
  • 22.
    In the RAE, ABS journals were graded more highly than non-ABS journals (cols 5,6)Figure 3 Scattergram showing association between GPA and proportion of an institution’s submitted journals that are in ABS
  • 23.
    There are atleast 3 possible explanations of this:Better RAE gradesHigher % ABS journals“RAE Bias”Higher % ABS journalsHigher quality of department“Better depts. more mainstream”Better RAE gradesHigher quality of department“Greater selectivity”Higher % ABS journals
  • 24.
    2. Citations PaperqualityJournal qualityJournal rankingsResearcher qualityCitationsThe REF and the Leiden methodology
  • 25.
    Mean citations perpaper field normalised (cpp)
  • 26.
    Paper quality generatescitations which can then measure journal, paper and researcher quality but …Is there a journal effect or a researcher effect as well?

Editor's Notes

  • #3 Until about 5 years ago I had no interest in rankings at all. I knew the journals in my own disciplines and roughly where they stood. However, I then became Director of Research in the run-up to the RAE and developed a rather unhealthy , indeed salacious interest in anything to do with rankings, citations and so on. Suddenly colleagues keep wanting to know should they send their paper to journal X rather than Y, or having had it rejected by Z where should they send it next. Never having heard of most of the journals it was difficult to advise and so I turned to journal rankings. At that time, before the ABS one, the problem was that there were many different rankings covering different sets of journals using different scoring systems and each with its own particular biases or prejudices. So, being a bit of a statistician I decided to combine these together into one amalgamated list based on the RAE 1* - 4*. I did this and eventually came up with a list of about 650 journals based on 14 other rankings. The main claim I would make for this list if that it has no element of my individual subjectivity in it at all – it is simply a statistical combination of other peoples subjectivities, and as ackoff saidI had thought that it might take an afternoon but in fact it took several weeks because of the nature of the data and when I finished I thought that I would write it up as a paper – it would be of interest to other DoRs and it was quite a rigorous piece of work. There my troubles began – I have never had a paper rejected so many time before! Five rejections before it was eventually published. And the problem was not so much with the paper itself, but the referees, and editors, hated the whole idea of journal rankings. A few quotesIt was eventually published (in a 3* journal) because the editor said that he hated journal rankings and it would give him a chance to do a reply criticising them!
  • #4 Some people are interested in journal quality per se (editors/publishers/authors) but often the journal quality is just an indicator of the paper quality. Intrinsic paper quality is not obvious – it needs a a judgement – hence the RAE which judged the quality of over 12,000 papers. But we cannot generally do that Sometimes we are interested in the researcher quality for promotions or jobs and paper quality may be an indicator of this.But basically we cannot easily measure the intrinsic quality of either researchers or papers – we don’t go round with a british lion mark on our heads - so we need other ways of doing it and hence we use the quality of journal as measured by the rankings.There are 2 theories about this
  • #17 Lets now move on to citations.Clearly the REF has stimulated a great deal of interest and concern about the use of bibliometric data, especially citations, in evaluating research quality. Although problems with this approach, at least in SS, suggests that they are moving back to peer review but with some bibliometric data.Why are we interested in citations?Whilst citations are not a direct measure of quality they are generally thought to be a measure of impact which is one dimension of quality
  • #21 GS averages 71% but is very high for the journals – 92%WoS is only 50% - which is actually quite high in comparison with some studies eg Leiden analysis of RAE2001 had 46% of journal papers in WoS, Norris & Oppenheim had 41% of journalsCPP is 5 for WoS again about averageTwice as big for GSRAE submissions 118Papers in GS 114Papers in WoS 76Citations in GS 1278Citations in WoS 310GS CPP 11.2WoS CPP 4.1        
  • #27 Could include books, conference papers, reports, websites, artefacts, practice (cf English and drama)Invisible research – new specialised innovativeNot just number or citations but more innovative measures of quality dependent on the areaAlso new measures, eg downloads, growth and decay rates, Google PageRank, co-citation analysis etcImpacts especially external impacts on society policy economy and community