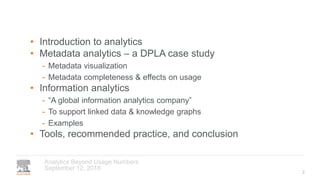
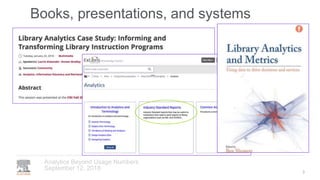
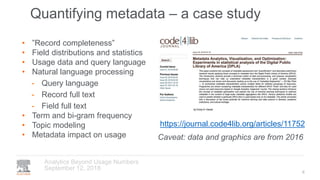
Analytics Beyond
Usage Numbers
Presented for NISO, September 12, 2018
Corey A Harper (@chrpr)
Applying analytics to metadata,
content, and research
Many thanks for contributions from Brad Allen, Jessica Cox,
Ron Daniel, Helena Deus, Paul Groth, Darin McBeath, and
Tony Scerri
September 12, 2018
Analytics Beyond Usage Numbers
• Introduction to analytics
• Metadata analytics – a DPLA case study
- Metadata visualization
- Metadata completeness & effects on usage
• Information analytics
- “A global information analytics company”
- To support linked data & knowledge graphs
- Examples
• Tools, recommended practice, and conclusion
2
Books, presentations, and systems
September 12, 2018
Analytics Beyond Usage Numbers
3
Invokes library assessment
September 12, 2018
Analytics Beyond Usage Numbers
4
Metadata Analytics
September 12, 2018
Analytics Beyond Usage Numbers
5
Quantifying metadata – a case study
September 12, 2018
Analytics Beyond Usage Numbers
6
• ”Record completeness”
• Field distributions and statistics
• Usage data and query language
• Natural language processing
- Query language
- Record full text
- Field full text
• Term and bi-gram frequency
• Topic modeling
• Metadata impact on usage
https://journal.code4lib.org/articles/11752
Caveat: data and graphics are from 2016
Average # of subjects by provider
September 12, 2018
Analytics Beyond Usage Numbers
7
Percentage of records with subject
September 12, 2018
Analytics Beyond Usage Numbers
8
September 12, 2018
Analytics Beyond Usage Numbers
9
Star plots in D3
September 12, 2018
Analytics Beyond Usage Numbers
10
Average Field
Count
Percentage with
at least 1
Univ. of N. Texas Metadata Quality Interface
September 12, 2018
Analytics Beyond Usage Numbers
11
http://dublincore.org/conference/2018/abstracts/#564
Term frequency distributions
September 12, 2018
Analytics Beyond Usage Numbers
12
More than ¼ of words are rights statements!
September 12, 2018
Analytics Beyond Usage Numbers
13
September 12, 2018
Analytics Beyond Usage Numbers
14
DPLA Google searches
September 12, 2018
Analytics Beyond Usage Numbers
15
Percent of items with at least 1 view
September 12, 2018
Analytics Beyond Usage Numbers
16
Caveat: skewed usage data
September 12, 2018
Analytics Beyond Usage Numbers
17
Predicting usage
September 12, 2018
Analytics Beyond Usage Numbers
18
Decision tree results
September 12, 2018
Analytics Beyond Usage Numbers
19
Information Analytics
September 12, 2018
Analytics Beyond Usage Numbers
20
“A global information analytics business”
September 12, 2018
Analytics Beyond Usage Numbers
21
To help customers answer questions at point of need:
Elsevier combines content with technology
to provide actionable knowledge
Operational Excellence
Content Technology
Chemistry database
500m published experimental facts
User queries
13m monthly users on ScienceDirect
Books
35,000 published books
Drug Database
100% of drug information from
pharmaceutical companies updated daily
Research
16% of the world’s research data and
articles published by Elsevier
1,000
technologists employed by Elsevier
Machine learning
Over 1,000 predictive models trained on 1.5
billion electronic health care events
Machine reading
475m facts extracted from
ScienceDirect
Collaborative filtering:
1bn scientific articles added by 2.5m
researchers analyzed daily to generate over
250m article recommendations
Semantic Enhancement
Knowledge on 50m chemicals captured as 11B
facts
22
Elsevier Labs
September 12, 2018
Analytics Beyond Usage Numbers
• Reports into Architecture / Technology
• Mix of Researchers and very experienced software
developers
• Two main modes of work
- Targeted Research, primarily stuff that’s still 2-3 years out
- Accelerated Development, in partnership with and
support of product groups
• Applying state of the art research to medical and
scientific domain
23
Differences in citation language
September 12, 2018
Analytics Beyond Usage Numbers
24
Researchers have successfully
reprogrammed somatic cells into stem-
like cells – known as induced pluripotent
stem cells (iPSCs) – which share many
of the characteristics of ESCs (Takahashi
and Yamanaka, 2006).
Human nephron progenitors were
induced from iPSCs (201B7) (Takahashi
and Yamanaka, 2006), based on the
protocol that we previously established
(Taguchi et al., 2014).
Materials and Methods Introduction
Citation language pre- & post- Nobel Prize
September 12, 2018
Analytics Beyond Usage Numbers
25
https://openaccess.leidenuniv.nl/handle/1887/65351
AnnotationQuery
September 12, 2018
Analytics Beyond Usage Numbers
26
This allows us to search for:
• a <sentence>
• in the <methods_section>
• that contains
• a citation to to
• A Nobel Prize Paper
(“Nobel_papers.txt”)
https://github.com/elsevierlabs-os/AnnotationQuery
Building blocks for text analytics
September 12, 2018
Analytics Beyond Usage Numbers
• Original Markup
Annotations
• Part of Speech Annotations
• Sentences, Paragraphs,
Noun Phrases, Verb
Phrases
• Dependency and
Constituency Parse Trees
• Query Across Annotation
Sets!
27
Additional use cases
September 12, 2018
Analytics Beyond Usage Numbers
Units and Measurements
• Find a <numeric pattern>
12 ± 3, 53–55, 0.245
• Followed by a <unit of
measurement>
°C, μM, hours, h, MPa,
28
Temperatures
• Find a <U&M>
• Of type <temperature>
• With the word
<housing>
• in the same <sentence>
• in the <methods_section>
Units and measurements
September 12, 2018
Analytics Beyond Usage Numbers
• Nanoamperes (nA) for neural cell Rheobase values
• Megapascals (mPa) for compressive strength of concrete
• Milligrams per Kilogram (mg/kg) for administered drug
dosages
29
Cold Mice Problem
September 12, 2018
Analytics Beyond Usage Numbers
30
September 12, 2018
Analytics Beyond Usage Numbers
31
https://ieeexplore.ieee.org/abstract/document/8258456/
Additional parameters
September 12, 2018
Analytics Beyond Usage Numbers
32
Visualizing data from tables
33
September 12, 2018
Analytics Beyond Usage Numbers
Information analytics enables:
September 12, 2018
Analytics Beyond Usage Numbers
• Datasets aggregated across the literature
• Knowledge Graphs for specific domains
• Databases of experimental results
• Decision support and question answering systems
This kind of information extraction can be a key
component of realizing the library community’s vision for
linked data in cultural heritage & scholarly research.
34
A tour of analytics
September 12, 2018
Analytics Beyond Usage Numbers
• From library analytics and metrics,
• To metadata analytics,
• To information analytics and knowledge graph
extraction
• Heterogenous data streams:
- Combined in interesting ways,
- Made queryable and recombinant,
- For use in question answering, visualization, and more.
35
36
September 12, 2018
Analytics Beyond Usage Numbers
36
• Heterogeneous storage
• Databases
• Graphs
• Columnar data formats
• Cloud object storage
• Heterogeneous tools and systems
• Spark and Kafka
• Tableau, D3, Seaborn
• Notebooks (Jupyter, Databricks)
Design guidance
https://dataintensive.net/
Thank you
Corey A Harper
Sr. Technology Researcher
Elsevier Labs
c.harper@elsevier.com
@chrpr
Backup
Implicit metadata
September 12, 2018
Analytics Beyond Usage Numbers
• Term & N-gram Frequencies
• Topic Maps
• Query Language
• Click & Usage Data
• Referral Patterns
39
Citation Analysis
September 12, 2018
Analytics Beyond Usage Numbers
40
Library analytics
September 12, 2018
Analytics Beyond Usage Numbers
• Data informed decision making
• Use cases around:
- Library instruction
- Personalized recommendations
- E-resource cost per use
- Physical collections & space
- Digital collections
• Tying library programs to student
GPA
• Building personas from data
• Service point staffing and use
41
All of this requires
• Data collection and integration:
- University data warehouses
- Library systems
- Subscription vendors
• Data management policies
• Data analysis tools and expertise
September 12, 2018
Analytics Beyond Usage Numbers
42
Frequency Distributions
September 12, 2018
Analytics Beyond Usage Numbers
43
Answers are about things, not just Works
September 12, 2018
Analytics Beyond Usage Numbers
44
Why shouldn’t a search on an author
return information about the author,
including the author’s works? Where
was the author born, when did she
live, what is she known for? … All of
this is possible, but only if we can
make some fundamental changes in
our approach to bibliographic
description. ... The challenge for us
lies in transforming what we can of our
data into interrelated “things” without
overindulging that metaphor.
Coyle, K. (2016). FRBR, before and after: a look at our
bibliographical models. Chicago: ALA Editions.
Building Knowledge Graphs
September 12, 2018
Analytics Beyond Usage Numbers
45
Plus LAWDI, LOD-LAM, LD4L-Labs, & Many More
https://zepheira.com/ – https://linkedjazz.org/network/ – http://vivo.cornell.edu/
Algorithmic Bias
September 12, 2018
Analytics Beyond Usage Numbers
46

Harper Analytics Beyond Usage Numbers

  • 1.
    Analytics Beyond Usage Numbers Presentedfor NISO, September 12, 2018 Corey A Harper (@chrpr) Applying analytics to metadata, content, and research Many thanks for contributions from Brad Allen, Jessica Cox, Ron Daniel, Helena Deus, Paul Groth, Darin McBeath, and Tony Scerri
  • 2.
    September 12, 2018 AnalyticsBeyond Usage Numbers • Introduction to analytics • Metadata analytics – a DPLA case study - Metadata visualization - Metadata completeness & effects on usage • Information analytics - “A global information analytics company” - To support linked data & knowledge graphs - Examples • Tools, recommended practice, and conclusion 2
  • 3.
    Books, presentations, andsystems September 12, 2018 Analytics Beyond Usage Numbers 3
  • 4.
    Invokes library assessment September12, 2018 Analytics Beyond Usage Numbers 4
  • 5.
    Metadata Analytics September 12,2018 Analytics Beyond Usage Numbers 5
  • 6.
    Quantifying metadata –a case study September 12, 2018 Analytics Beyond Usage Numbers 6 • ”Record completeness” • Field distributions and statistics • Usage data and query language • Natural language processing - Query language - Record full text - Field full text • Term and bi-gram frequency • Topic modeling • Metadata impact on usage https://journal.code4lib.org/articles/11752 Caveat: data and graphics are from 2016
  • 7.
    Average # ofsubjects by provider September 12, 2018 Analytics Beyond Usage Numbers 7
  • 8.
    Percentage of recordswith subject September 12, 2018 Analytics Beyond Usage Numbers 8
  • 9.
    September 12, 2018 AnalyticsBeyond Usage Numbers 9
  • 10.
    Star plots inD3 September 12, 2018 Analytics Beyond Usage Numbers 10 Average Field Count Percentage with at least 1
  • 11.
    Univ. of N.Texas Metadata Quality Interface September 12, 2018 Analytics Beyond Usage Numbers 11 http://dublincore.org/conference/2018/abstracts/#564
  • 12.
    Term frequency distributions September12, 2018 Analytics Beyond Usage Numbers 12
  • 13.
    More than ¼of words are rights statements! September 12, 2018 Analytics Beyond Usage Numbers 13
  • 14.
    September 12, 2018 AnalyticsBeyond Usage Numbers 14
  • 15.
    DPLA Google searches September12, 2018 Analytics Beyond Usage Numbers 15
  • 16.
    Percent of itemswith at least 1 view September 12, 2018 Analytics Beyond Usage Numbers 16
  • 17.
    Caveat: skewed usagedata September 12, 2018 Analytics Beyond Usage Numbers 17
  • 18.
    Predicting usage September 12,2018 Analytics Beyond Usage Numbers 18
  • 19.
    Decision tree results September12, 2018 Analytics Beyond Usage Numbers 19
  • 20.
    Information Analytics September 12,2018 Analytics Beyond Usage Numbers 20
  • 21.
    “A global informationanalytics business” September 12, 2018 Analytics Beyond Usage Numbers 21
  • 22.
    To help customersanswer questions at point of need: Elsevier combines content with technology to provide actionable knowledge Operational Excellence Content Technology Chemistry database 500m published experimental facts User queries 13m monthly users on ScienceDirect Books 35,000 published books Drug Database 100% of drug information from pharmaceutical companies updated daily Research 16% of the world’s research data and articles published by Elsevier 1,000 technologists employed by Elsevier Machine learning Over 1,000 predictive models trained on 1.5 billion electronic health care events Machine reading 475m facts extracted from ScienceDirect Collaborative filtering: 1bn scientific articles added by 2.5m researchers analyzed daily to generate over 250m article recommendations Semantic Enhancement Knowledge on 50m chemicals captured as 11B facts 22
  • 23.
    Elsevier Labs September 12,2018 Analytics Beyond Usage Numbers • Reports into Architecture / Technology • Mix of Researchers and very experienced software developers • Two main modes of work - Targeted Research, primarily stuff that’s still 2-3 years out - Accelerated Development, in partnership with and support of product groups • Applying state of the art research to medical and scientific domain 23
  • 24.
    Differences in citationlanguage September 12, 2018 Analytics Beyond Usage Numbers 24 Researchers have successfully reprogrammed somatic cells into stem- like cells – known as induced pluripotent stem cells (iPSCs) – which share many of the characteristics of ESCs (Takahashi and Yamanaka, 2006). Human nephron progenitors were induced from iPSCs (201B7) (Takahashi and Yamanaka, 2006), based on the protocol that we previously established (Taguchi et al., 2014). Materials and Methods Introduction
  • 25.
    Citation language pre-& post- Nobel Prize September 12, 2018 Analytics Beyond Usage Numbers 25 https://openaccess.leidenuniv.nl/handle/1887/65351
  • 26.
    AnnotationQuery September 12, 2018 AnalyticsBeyond Usage Numbers 26 This allows us to search for: • a <sentence> • in the <methods_section> • that contains • a citation to to • A Nobel Prize Paper (“Nobel_papers.txt”) https://github.com/elsevierlabs-os/AnnotationQuery
  • 27.
    Building blocks fortext analytics September 12, 2018 Analytics Beyond Usage Numbers • Original Markup Annotations • Part of Speech Annotations • Sentences, Paragraphs, Noun Phrases, Verb Phrases • Dependency and Constituency Parse Trees • Query Across Annotation Sets! 27
  • 28.
    Additional use cases September12, 2018 Analytics Beyond Usage Numbers Units and Measurements • Find a <numeric pattern> 12 ± 3, 53–55, 0.245 • Followed by a <unit of measurement> °C, μM, hours, h, MPa, 28 Temperatures • Find a <U&M> • Of type <temperature> • With the word <housing> • in the same <sentence> • in the <methods_section>
  • 29.
    Units and measurements September12, 2018 Analytics Beyond Usage Numbers • Nanoamperes (nA) for neural cell Rheobase values • Megapascals (mPa) for compressive strength of concrete • Milligrams per Kilogram (mg/kg) for administered drug dosages 29
  • 30.
    Cold Mice Problem September12, 2018 Analytics Beyond Usage Numbers 30
  • 31.
    September 12, 2018 AnalyticsBeyond Usage Numbers 31 https://ieeexplore.ieee.org/abstract/document/8258456/
  • 32.
    Additional parameters September 12,2018 Analytics Beyond Usage Numbers 32
  • 33.
    Visualizing data fromtables 33 September 12, 2018 Analytics Beyond Usage Numbers
  • 34.
    Information analytics enables: September12, 2018 Analytics Beyond Usage Numbers • Datasets aggregated across the literature • Knowledge Graphs for specific domains • Databases of experimental results • Decision support and question answering systems This kind of information extraction can be a key component of realizing the library community’s vision for linked data in cultural heritage & scholarly research. 34
  • 35.
    A tour ofanalytics September 12, 2018 Analytics Beyond Usage Numbers • From library analytics and metrics, • To metadata analytics, • To information analytics and knowledge graph extraction • Heterogenous data streams: - Combined in interesting ways, - Made queryable and recombinant, - For use in question answering, visualization, and more. 35
  • 36.
    36 September 12, 2018 AnalyticsBeyond Usage Numbers 36 • Heterogeneous storage • Databases • Graphs • Columnar data formats • Cloud object storage • Heterogeneous tools and systems • Spark and Kafka • Tableau, D3, Seaborn • Notebooks (Jupyter, Databricks) Design guidance https://dataintensive.net/
  • 37.
    Thank you Corey AHarper Sr. Technology Researcher Elsevier Labs c.harper@elsevier.com @chrpr
  • 38.
  • 39.
    Implicit metadata September 12,2018 Analytics Beyond Usage Numbers • Term & N-gram Frequencies • Topic Maps • Query Language • Click & Usage Data • Referral Patterns 39
  • 40.
    Citation Analysis September 12,2018 Analytics Beyond Usage Numbers 40
  • 41.
    Library analytics September 12,2018 Analytics Beyond Usage Numbers • Data informed decision making • Use cases around: - Library instruction - Personalized recommendations - E-resource cost per use - Physical collections & space - Digital collections • Tying library programs to student GPA • Building personas from data • Service point staffing and use 41 All of this requires • Data collection and integration: - University data warehouses - Library systems - Subscription vendors • Data management policies • Data analysis tools and expertise
  • 42.
    September 12, 2018 AnalyticsBeyond Usage Numbers 42
  • 43.
    Frequency Distributions September 12,2018 Analytics Beyond Usage Numbers 43
  • 44.
    Answers are aboutthings, not just Works September 12, 2018 Analytics Beyond Usage Numbers 44 Why shouldn’t a search on an author return information about the author, including the author’s works? Where was the author born, when did she live, what is she known for? … All of this is possible, but only if we can make some fundamental changes in our approach to bibliographic description. ... The challenge for us lies in transforming what we can of our data into interrelated “things” without overindulging that metaphor. Coyle, K. (2016). FRBR, before and after: a look at our bibliographical models. Chicago: ALA Editions.
  • 45.
    Building Knowledge Graphs September12, 2018 Analytics Beyond Usage Numbers 45 Plus LAWDI, LOD-LAM, LD4L-Labs, & Many More https://zepheira.com/ – https://linkedjazz.org/network/ – http://vivo.cornell.edu/
  • 46.
    Algorithmic Bias September 12,2018 Analytics Beyond Usage Numbers 46

Editor's Notes

  • #23 Script: We’ve been working on combining our vast quantities of structured data with technology, supported by our operational expertise. You may know us for content from articles and books, but for example, we hold 500m experimental facts in our chemistry databases. We collect 13M user queries on ScienceDirect every month. Elsevier is sitting a top a trove of “big-data”. And we’ve built the technology muscle to process that data. We employ over 1000 technologists. We’re using artificial intelligence such as machine reading and machine learning. As an example of scale on ScienceDirect, we employ collaborative filtering, analyzing 1bn articles from 2.5m researchers daily, to generate 250m article recommendations.