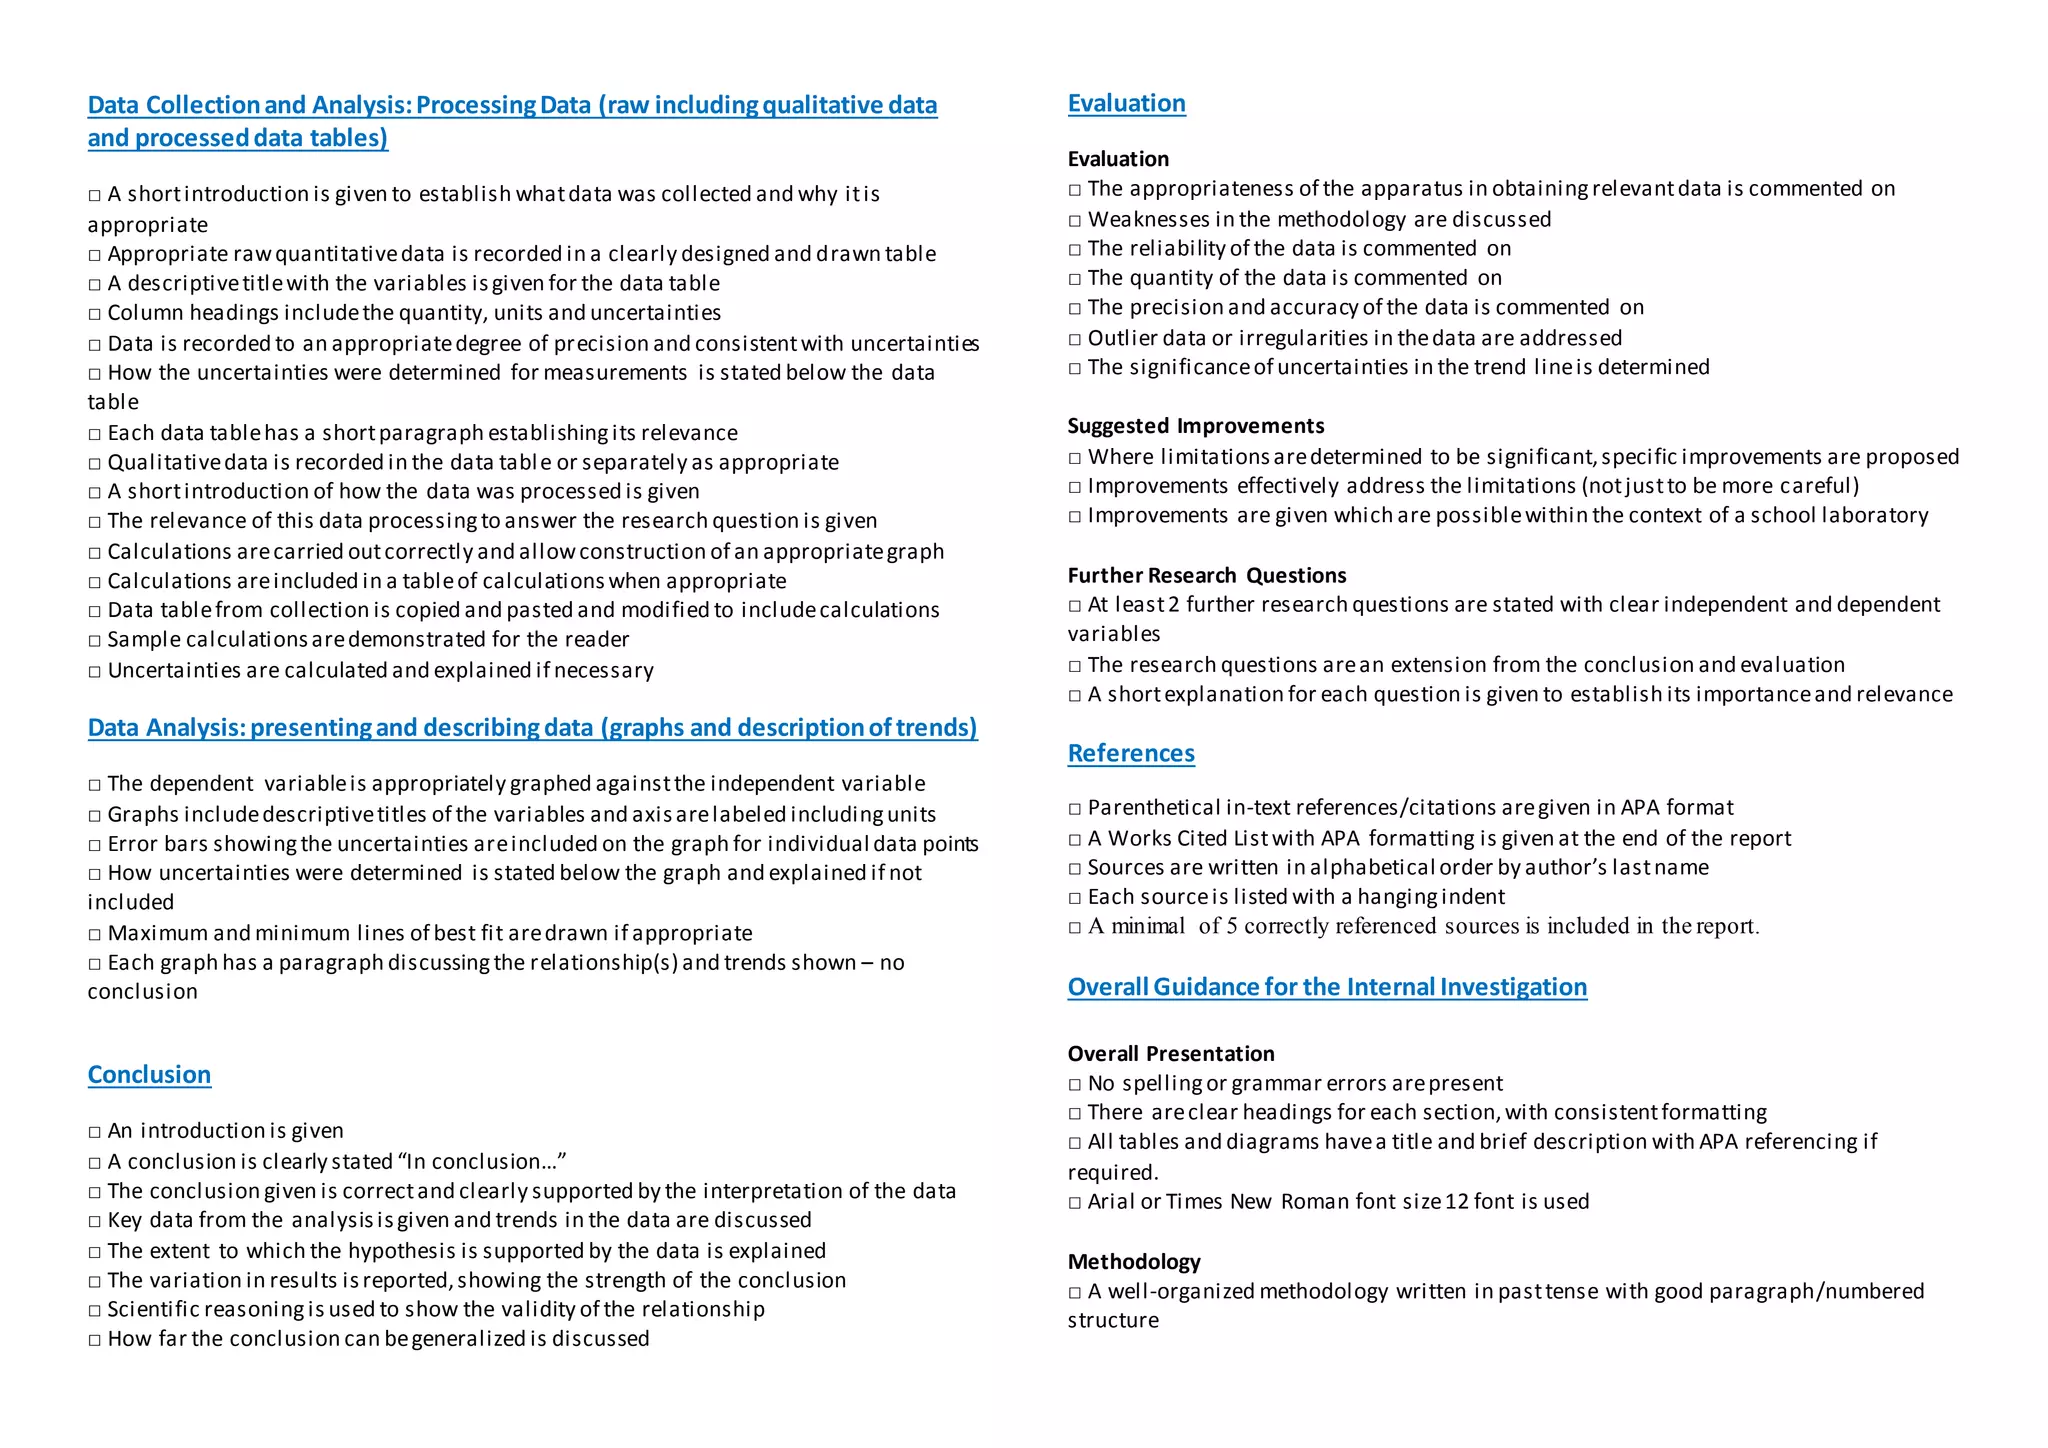
IBDP Sciences Internal Investigation Headings and Guidance Checklist
Research Question
□ A descriptiveyet concisetitleis given
□ A grammatically correctquestion abouta preciserelationship isasked
□ A sufficiently detailed question to stand aloneand be self-explanatory is asked
□ A specific measurabledependent variableis included
□ A specific independent variableto be manipulated is included
□ Preciselocations,measurements and Genus species names are given
Background Information
□ The introduction includes an observation thatleads to the research question
□ Thinking,initiativeor insightfor investigatingchosen topic is given
□ Justification indicates personal interest,significanceor curiosity for chosen design &
presentation is given
□ All information is clearly supported with references
□ At least3 appropriatesources with authors have been used
□ Both Internet and printsources areincluded
□ There is no plagiarism(this will givea zero)
Hypothesisand ScientificReasoning
□ A grammatically correctanswer to the research question is given
□ The hypothesis can be supported through scientific research and reasoning
□ A preciserelationship between the independent and dependent variables is predicted
□ The independent and dependent variables arewritten exactly the same as in the
question
□ The hypothesis is given as a scientifically reasonableanswer to the research question
□ The hypothesis is clearly justified and supported through a review of scientificliterature
Variables
□ All key variables relevantto the experiment are investigated
□ Subheadings of Independent Variable,Dependent Variableand Controlled Variables are
given
□ Independent and dependent variables arewritten exactly the same as in the question
□ A very brief description of how the independent variableis modified is given
□ A very brief description of how the dependent variableis measured is given
□ Controlled variables includeall significantvariables thatcould affect the dependent
variable
□ A very brief description of why each controlled variablemustbe kept constantis given
Apparatus
□ [List all equipment used] [Includeall items,quantities,concentrations,volumes,masses
etc., for measuringequipment uncertainties]
Method- manipulationand control of variables
□ An introduction establishes themethodology as a fair test of the hypothesis
□ The modification of procedures from other sources areclearly referenced in APA format
□ All materials areclearly listed with details (type, amount, size,volume, concentration…)
□ Diagrams and/or photographs clearly showingthesetup of apparatus isincluded
□ Diagrams and photographs arereferenced usingAPA or (Drawing/Photograph by
Author)
□ What was done and an explanation of why is given for each step
□ How the independent variablewas manipulated is clearly described
□ How the listed controlled variables werekept controlled in the experiment is described
□ The use and method of random samplingis described where relevant
□ Comment on possiblehazards,environmental,ethical and social impacts of the work,
and say how they will dealtwith to minimisethe impact]
Method- choice of data processingand presentation
□ The introduction establishes thedata collected is valid for answeringthe research
question
□ The reliability of the methodology is established through sufficientrepetition
□ How the dependent variablemeasurements were taken is precisely explained
□ The number of dependent variablemeasurements and why this amount is described
□ The sizeof the increments between each data pointand why this was acceptableis
described
□ The use of at least5 repeats to calculatestandard deviation for error analysisis
explained
□ The inclusion of a samplesizeof at least10 is described when the T-test was used
□ The collection of data from any other students or sources is clearly explained and
referenced
Data Collectionand Analysis:ProcessingData (raw includingqualitative data
and processeddata tables)
□ A shortintroduction is given to establish whatdata was collected and why itis
appropriate
□ Appropriate rawquantitativedata is recorded in a clearly designed and drawn table
□ A descriptivetitlewith the variables isgiven for the data table
□ Column headings includethe quantity, units and uncertainties
□ Data is recorded to an appropriatedegree of precision and consistentwith uncertainties
□ How the uncertainties were determined for measurements is stated below the data
table
□ Each data tablehas a shortparagraph establishingits relevance
□ Qualitativedata is recorded in the data table or separately as appropriate
□ A shortintroduction of how the data was processed is given
□ The relevance of this data processingto answer the research question is given
□ Calculations arecarried outcorrectly and allowconstruction of an appropriategraph
□ Calculations areincluded in a tableof calculationswhen appropriate
□ Data tablefrom collection is copied and pasted and modified to includecalculations
□ Sample calculationsaredemonstrated for the reader
□ Uncertainties are calculated and explained if necessary
Data Analysis:presentingand describingdata (graphs and descriptionoftrends)
□ The dependent variableis appropriately graphed againstthe independent variable
□ Graphs includedescriptivetitles of the variables and axisarelabeled includingunits
□ Error bars showingthe uncertainties areincluded on the graph for individual data points
□ How uncertainties were determined is stated below the graph and explained if not
included
□ Maximum and minimum lines of best fit aredrawn if appropriate
□ Each graph has a paragraph discussingthe relationship(s) and trends shown – no
conclusion
Conclusion
□ An introduction is given
□ A conclusion is clearly stated “In conclusion…”
□ The conclusion given is correctand clearly supported by the interpretation of the data
□ Key data from the analysisisgiven and trends in the data are discussed
□ The extent to which the hypothesis is supported by the data is explained
□ The variation in results isreported,showing the strength of the conclusion
□ Scientific reasoningis used to show the validity of the relationship
□ How far the conclusion can begeneralized is discussed
Evaluation
Evaluation
□ The appropriateness of the apparatus in obtainingrelevantdata is commented on
□ Weaknesses in the methodology are discussed
□ The reliability of the data is commented on
□ The quantity of the data is commented on
□ The precision and accuracy of the data is commented on
□ Outlier data or irregularities in thedata are addressed
□ The significanceof uncertainties in the trend lineis determined
Suggested Improvements
□ Where limitationsaredetermined to be significant,specific improvements are proposed
□ Improvements effectively address the limitations (notjustto be more careful)
□ Improvements are given which are possiblewithin the context of a school laboratory
Further Research Questions
□ At least2 further research questions are stated with clear independent and dependent
variables
□ The research questions arean extension from the conclusion and evaluation
□ A shortexplanation for each question is given to establish its importanceand relevance
References
□ Parenthetical in-text references/citations aregiven in APA format
□ A Works Cited Listwith APA formatting is given at the end of the report
□ Sources are written in alphabetical order by author’s lastname
□ Each sourceis listed with a hangingindent
□ A minimal of 5 correctly referenced sources is included in the report.
Overall Guidance for the Internal Investigation
Overall Presentation
□ No spellingor grammar errors arepresent
□ There areclear headings for each section,with consistentformatting
□ All tables and diagrams havea title and brief description with APA referencing if
required.
□ Arial or Times New Roman font size12 font is used
Methodology
□ A well-organized methodology written in pasttense with good paragraph/numbered
structure

IBDP Science Internal Investigation Recommended headings with detailed guidance/checklist

  • 1.
    IBDP Sciences InternalInvestigation Headings and Guidance Checklist Research Question □ A descriptiveyet concisetitleis given □ A grammatically correctquestion abouta preciserelationship isasked □ A sufficiently detailed question to stand aloneand be self-explanatory is asked □ A specific measurabledependent variableis included □ A specific independent variableto be manipulated is included □ Preciselocations,measurements and Genus species names are given Background Information □ The introduction includes an observation thatleads to the research question □ Thinking,initiativeor insightfor investigatingchosen topic is given □ Justification indicates personal interest,significanceor curiosity for chosen design & presentation is given □ All information is clearly supported with references □ At least3 appropriatesources with authors have been used □ Both Internet and printsources areincluded □ There is no plagiarism(this will givea zero) Hypothesisand ScientificReasoning □ A grammatically correctanswer to the research question is given □ The hypothesis can be supported through scientific research and reasoning □ A preciserelationship between the independent and dependent variables is predicted □ The independent and dependent variables arewritten exactly the same as in the question □ The hypothesis is given as a scientifically reasonableanswer to the research question □ The hypothesis is clearly justified and supported through a review of scientificliterature Variables □ All key variables relevantto the experiment are investigated □ Subheadings of Independent Variable,Dependent Variableand Controlled Variables are given □ Independent and dependent variables arewritten exactly the same as in the question □ A very brief description of how the independent variableis modified is given □ A very brief description of how the dependent variableis measured is given □ Controlled variables includeall significantvariables thatcould affect the dependent variable □ A very brief description of why each controlled variablemustbe kept constantis given Apparatus □ [List all equipment used] [Includeall items,quantities,concentrations,volumes,masses etc., for measuringequipment uncertainties] Method- manipulationand control of variables □ An introduction establishes themethodology as a fair test of the hypothesis □ The modification of procedures from other sources areclearly referenced in APA format □ All materials areclearly listed with details (type, amount, size,volume, concentration…) □ Diagrams and/or photographs clearly showingthesetup of apparatus isincluded □ Diagrams and photographs arereferenced usingAPA or (Drawing/Photograph by Author) □ What was done and an explanation of why is given for each step □ How the independent variablewas manipulated is clearly described □ How the listed controlled variables werekept controlled in the experiment is described □ The use and method of random samplingis described where relevant □ Comment on possiblehazards,environmental,ethical and social impacts of the work, and say how they will dealtwith to minimisethe impact] Method- choice of data processingand presentation □ The introduction establishes thedata collected is valid for answeringthe research question □ The reliability of the methodology is established through sufficientrepetition □ How the dependent variablemeasurements were taken is precisely explained □ The number of dependent variablemeasurements and why this amount is described □ The sizeof the increments between each data pointand why this was acceptableis described □ The use of at least5 repeats to calculatestandard deviation for error analysisis explained □ The inclusion of a samplesizeof at least10 is described when the T-test was used □ The collection of data from any other students or sources is clearly explained and referenced
  • 2.
    Data Collectionand Analysis:ProcessingData(raw includingqualitative data and processeddata tables) □ A shortintroduction is given to establish whatdata was collected and why itis appropriate □ Appropriate rawquantitativedata is recorded in a clearly designed and drawn table □ A descriptivetitlewith the variables isgiven for the data table □ Column headings includethe quantity, units and uncertainties □ Data is recorded to an appropriatedegree of precision and consistentwith uncertainties □ How the uncertainties were determined for measurements is stated below the data table □ Each data tablehas a shortparagraph establishingits relevance □ Qualitativedata is recorded in the data table or separately as appropriate □ A shortintroduction of how the data was processed is given □ The relevance of this data processingto answer the research question is given □ Calculations arecarried outcorrectly and allowconstruction of an appropriategraph □ Calculations areincluded in a tableof calculationswhen appropriate □ Data tablefrom collection is copied and pasted and modified to includecalculations □ Sample calculationsaredemonstrated for the reader □ Uncertainties are calculated and explained if necessary Data Analysis:presentingand describingdata (graphs and descriptionoftrends) □ The dependent variableis appropriately graphed againstthe independent variable □ Graphs includedescriptivetitles of the variables and axisarelabeled includingunits □ Error bars showingthe uncertainties areincluded on the graph for individual data points □ How uncertainties were determined is stated below the graph and explained if not included □ Maximum and minimum lines of best fit aredrawn if appropriate □ Each graph has a paragraph discussingthe relationship(s) and trends shown – no conclusion Conclusion □ An introduction is given □ A conclusion is clearly stated “In conclusion…” □ The conclusion given is correctand clearly supported by the interpretation of the data □ Key data from the analysisisgiven and trends in the data are discussed □ The extent to which the hypothesis is supported by the data is explained □ The variation in results isreported,showing the strength of the conclusion □ Scientific reasoningis used to show the validity of the relationship □ How far the conclusion can begeneralized is discussed Evaluation Evaluation □ The appropriateness of the apparatus in obtainingrelevantdata is commented on □ Weaknesses in the methodology are discussed □ The reliability of the data is commented on □ The quantity of the data is commented on □ The precision and accuracy of the data is commented on □ Outlier data or irregularities in thedata are addressed □ The significanceof uncertainties in the trend lineis determined Suggested Improvements □ Where limitationsaredetermined to be significant,specific improvements are proposed □ Improvements effectively address the limitations (notjustto be more careful) □ Improvements are given which are possiblewithin the context of a school laboratory Further Research Questions □ At least2 further research questions are stated with clear independent and dependent variables □ The research questions arean extension from the conclusion and evaluation □ A shortexplanation for each question is given to establish its importanceand relevance References □ Parenthetical in-text references/citations aregiven in APA format □ A Works Cited Listwith APA formatting is given at the end of the report □ Sources are written in alphabetical order by author’s lastname □ Each sourceis listed with a hangingindent □ A minimal of 5 correctly referenced sources is included in the report. Overall Guidance for the Internal Investigation Overall Presentation □ No spellingor grammar errors arepresent □ There areclear headings for each section,with consistentformatting □ All tables and diagrams havea title and brief description with APA referencing if required. □ Arial or Times New Roman font size12 font is used Methodology □ A well-organized methodology written in pasttense with good paragraph/numbered structure