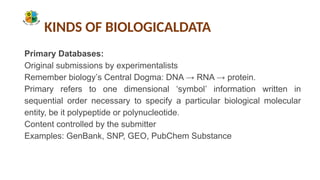
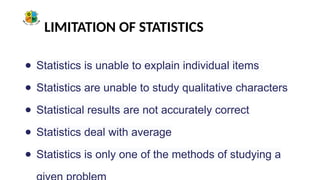
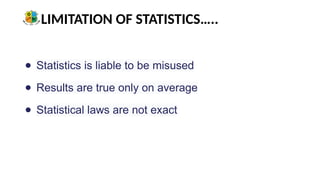
INTRODUCTION TO
BIOSTATISTICS
M. Gayathri M.Sc., M.Phil.
Assistant Professor
Department of Mathematics
Sri Sarada Niketan college of Science for women , Karur-5
DEFINITION
STATISTICS
A branch of mathematics that deals with the collection, organization, analysis, and
interpretation of data.
BIOSTATISTICS
Bio-statistics means when we use the statistical tools on the Biological Problems and
derived some results about that.
Example: Medical Science
It is also called Bio-metry. It means measurement of life.
Bio-metry:
Biometry means biological measurement. Measures that are drawn from bodily
activities of humans or from biological system in nature.
STATISTICAL METHOD
Croxton and Gowden said Statistical Method means “ the collection,
presentation, analysis and interpretation of numerical data”.
1.Collection of Data:
It is the first step in collection of data. Careful planning is essential
before collecting the data.
2.Presentation of Data:
• The mass data collected should be presented in a suitable form for
further analysis.
• The collected data may be presented in the form of tabular or
diagrammatic or graphical form.
Analysis of Data:
The data presented should be carefully analyzed from the presented
data such as measures of central tendencies, dispersion, correlation,
regression, etc.
Interpretation of Data:
• The final step is drawing conclusion from the data collected.
• A valid conclusion must be drawn on the basis of analysis.
• A high degree of skill and experience is necessary for the
interpretation.
BIOLOGICAL MEASURMENT
OBSERVATIONS AND VARIABLE:
• –is a characteristic under study that assume different value for
different element like blood pressure, age, sex, …
• –In statistics, we observe or measure characteristics, called variables,
of study subjects, called observational units.
• •The main divisions are qualitative (categorical) and quantitative
(numerical variables).
Qualitative variable:
A variable which can’t be measured in quantitative form. But can only
be identified by name or categories
E.g. place of birth, types of drug, stages of breast cancer (I, II, III, or IV),
degree of pain (minimal, moderate, severe). …
Quantitative variable:
A variable that can be measured and expressed numerically and they
can be of two types (discrete or continuous).
• –The values of a discrete variable are usually whole numbers, e.g. the
number of episodes of diarrhea in the first five years of life.
• –A continuous variable is a measurement on a continuous scale, e.g.
weight, height, blood pressure, age, etc.
Types of measurement scales
NOMINAL
• Data that represent categories or names
• There is no implied order to the categories of nominal data.
• No arithmetic and relational operation can be applied.
–E.g.
• Blood type (A, B, O and AB)
• Eye color (brown, black, blue, etc.)
• Sex (Male, Female)
ORDINAL
–Categories that can be ranked, but differences between ranks do not
exist
–Arithmetic operations are not applicable but relational operations.
–Ordering is the sole property of ordinal scale.
– E.g.
•Degree of pain (minimal, moderate, severe)
•Rating scales (Excellent, Very good, Good, Fair, poor)
•Letter grade (A, B, C, D and F)
INTERVAL
–Data that can be ranked and differences are meaningful. However,
there is no meaningful zero, so ratios are meaningless.
–All arithmetic operations except division and relational operations are
also possible.
• E.g.
–IQ
–Temperature in degree Fahrenheit (30F is not as much as two times of
15F)
Ratio
–Data can be ranked, differences are meaningful, and there is a true
zero.
–All arithmetic and relational operations are applicable.
–E.g.
Age (30 year individual is two times of 15 years)
•Weight (0kg is to mean, no weight)
•Number of drugs (0 means no drug)
KINDS OF BIOLOGICALDATA
Primary Databases:
Original submissions by experimentalists
Remember biology s Central Dogma: DNA → RNA → protein.
ʼ
Primary refers to one dimensional symbol information written in
ʻ ʼ
sequential order necessary to specify a particular biological molecular
entity, be it polypeptide or polynucleotide.
Content controlled by the submitter
Examples: GenBank, SNP, GEO, PubChem Substance
Derivative Databases:
Built from primary data
Content controlled by third party (NCBI)
Examples: Refseq, TPA, RefSNP, UniGene, Protein, Structure,
Conserved Domain, PubChem Compound
Primary databases serve as a repository of experimentalist
sequences (GenBank).
Derivative databases are sources of edited/curated sequences
(RefSeq…reference sequences, UniGene...genes compared to
genetic loci on genomes)
FUNCTIONS OF STATISTICS
● It presents facts in a definite form
● It simplifies mass of figures
● It facilitate comparison
● It helps in formulating and testing hypothesis
● It helps in prediction
● It helps in formulation of suitable policies.
● It studies relationship
FUNCTIONS OF STATISTICS...
● It helps in forecasting
● It is helpful for common man.
● Statistical methods merges with speed of computer
can make wonders; SPSS, STATA ,MATLAB, MINITAB
etc.
LIMITATION OF STATISTICS
● Statistics is unable to explain individual items
● Statistics are unable to study qualitative characters
● Statistical results are not accurately correct
● Statistics deal with average
● Statistics is only one of the methods of studying a
LIMITATION OF STATISTICS…..
● Statistics is liable to be misused
● Results are true only on average
● Statistical laws are not exact

BIOSTATISTICS- Basic definition and Statistical Method

  • 1.
    INTRODUCTION TO BIOSTATISTICS M. GayathriM.Sc., M.Phil. Assistant Professor Department of Mathematics Sri Sarada Niketan college of Science for women , Karur-5
  • 2.
    DEFINITION STATISTICS A branch ofmathematics that deals with the collection, organization, analysis, and interpretation of data. BIOSTATISTICS Bio-statistics means when we use the statistical tools on the Biological Problems and derived some results about that. Example: Medical Science It is also called Bio-metry. It means measurement of life.
  • 3.
    Bio-metry: Biometry means biologicalmeasurement. Measures that are drawn from bodily activities of humans or from biological system in nature.
  • 4.
    STATISTICAL METHOD Croxton andGowden said Statistical Method means “ the collection, presentation, analysis and interpretation of numerical data”. 1.Collection of Data: It is the first step in collection of data. Careful planning is essential before collecting the data. 2.Presentation of Data: • The mass data collected should be presented in a suitable form for further analysis. • The collected data may be presented in the form of tabular or diagrammatic or graphical form.
  • 5.
    Analysis of Data: Thedata presented should be carefully analyzed from the presented data such as measures of central tendencies, dispersion, correlation, regression, etc. Interpretation of Data: • The final step is drawing conclusion from the data collected. • A valid conclusion must be drawn on the basis of analysis. • A high degree of skill and experience is necessary for the interpretation.
  • 6.
    BIOLOGICAL MEASURMENT OBSERVATIONS ANDVARIABLE: • –is a characteristic under study that assume different value for different element like blood pressure, age, sex, … • –In statistics, we observe or measure characteristics, called variables, of study subjects, called observational units. • •The main divisions are qualitative (categorical) and quantitative (numerical variables).
  • 7.
    Qualitative variable: A variablewhich can’t be measured in quantitative form. But can only be identified by name or categories E.g. place of birth, types of drug, stages of breast cancer (I, II, III, or IV), degree of pain (minimal, moderate, severe). … Quantitative variable: A variable that can be measured and expressed numerically and they can be of two types (discrete or continuous). • –The values of a discrete variable are usually whole numbers, e.g. the number of episodes of diarrhea in the first five years of life. • –A continuous variable is a measurement on a continuous scale, e.g. weight, height, blood pressure, age, etc.
  • 8.
    Types of measurementscales NOMINAL • Data that represent categories or names • There is no implied order to the categories of nominal data. • No arithmetic and relational operation can be applied. –E.g. • Blood type (A, B, O and AB) • Eye color (brown, black, blue, etc.) • Sex (Male, Female)
  • 9.
    ORDINAL –Categories that canbe ranked, but differences between ranks do not exist –Arithmetic operations are not applicable but relational operations. –Ordering is the sole property of ordinal scale. – E.g. •Degree of pain (minimal, moderate, severe) •Rating scales (Excellent, Very good, Good, Fair, poor) •Letter grade (A, B, C, D and F)
  • 10.
    INTERVAL –Data that canbe ranked and differences are meaningful. However, there is no meaningful zero, so ratios are meaningless. –All arithmetic operations except division and relational operations are also possible. • E.g. –IQ –Temperature in degree Fahrenheit (30F is not as much as two times of 15F)
  • 11.
    Ratio –Data can beranked, differences are meaningful, and there is a true zero. –All arithmetic and relational operations are applicable. –E.g. Age (30 year individual is two times of 15 years) •Weight (0kg is to mean, no weight) •Number of drugs (0 means no drug)
  • 12.
    KINDS OF BIOLOGICALDATA PrimaryDatabases: Original submissions by experimentalists Remember biology s Central Dogma: DNA → RNA → protein. ʼ Primary refers to one dimensional symbol information written in ʻ ʼ sequential order necessary to specify a particular biological molecular entity, be it polypeptide or polynucleotide. Content controlled by the submitter Examples: GenBank, SNP, GEO, PubChem Substance
  • 13.
    Derivative Databases: Built fromprimary data Content controlled by third party (NCBI) Examples: Refseq, TPA, RefSNP, UniGene, Protein, Structure, Conserved Domain, PubChem Compound Primary databases serve as a repository of experimentalist sequences (GenBank). Derivative databases are sources of edited/curated sequences (RefSeq…reference sequences, UniGene...genes compared to genetic loci on genomes)
  • 14.
    FUNCTIONS OF STATISTICS ●It presents facts in a definite form ● It simplifies mass of figures ● It facilitate comparison ● It helps in formulating and testing hypothesis ● It helps in prediction ● It helps in formulation of suitable policies. ● It studies relationship
  • 15.
    FUNCTIONS OF STATISTICS... ●It helps in forecasting ● It is helpful for common man. ● Statistical methods merges with speed of computer can make wonders; SPSS, STATA ,MATLAB, MINITAB etc.
  • 16.
    LIMITATION OF STATISTICS ●Statistics is unable to explain individual items ● Statistics are unable to study qualitative characters ● Statistical results are not accurately correct ● Statistics deal with average ● Statistics is only one of the methods of studying a
  • 17.
    LIMITATION OF STATISTICS….. ●Statistics is liable to be misused ● Results are true only on average ● Statistical laws are not exact