Download as PDF, PPTX
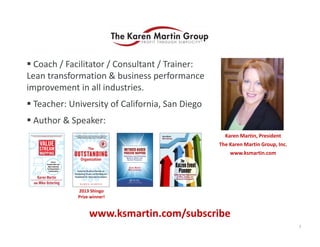
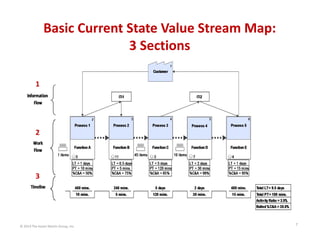
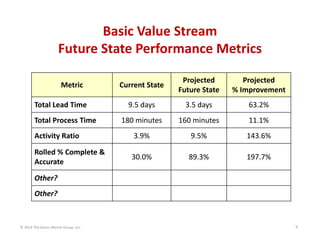
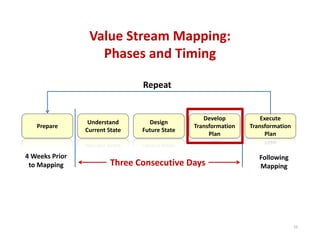
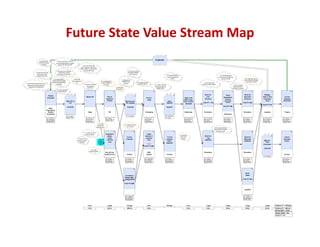
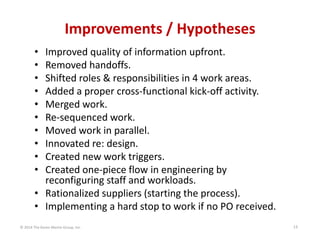
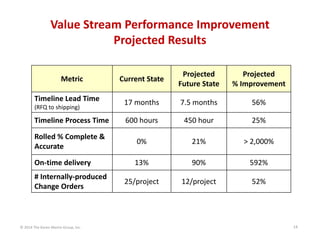
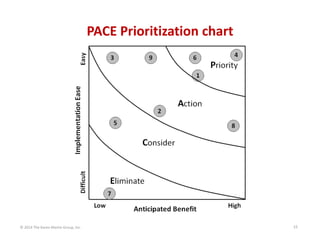
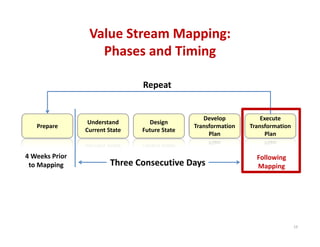
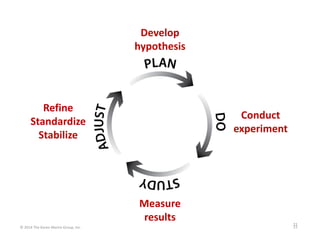
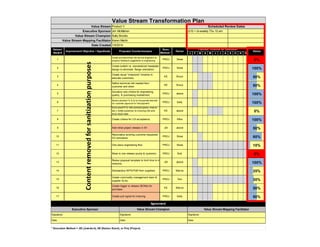


The document outlines a webinar on value stream analysis and mapping, led by Karen Martin, focusing on business performance improvement and lean transformation. It details the learning objectives, phases of value stream mapping, and projected improvements in metrics like lead time and on-time delivery. Resources for further learning, including recordings and upcoming webinars, are also provided.