Download as PDF, PPTX


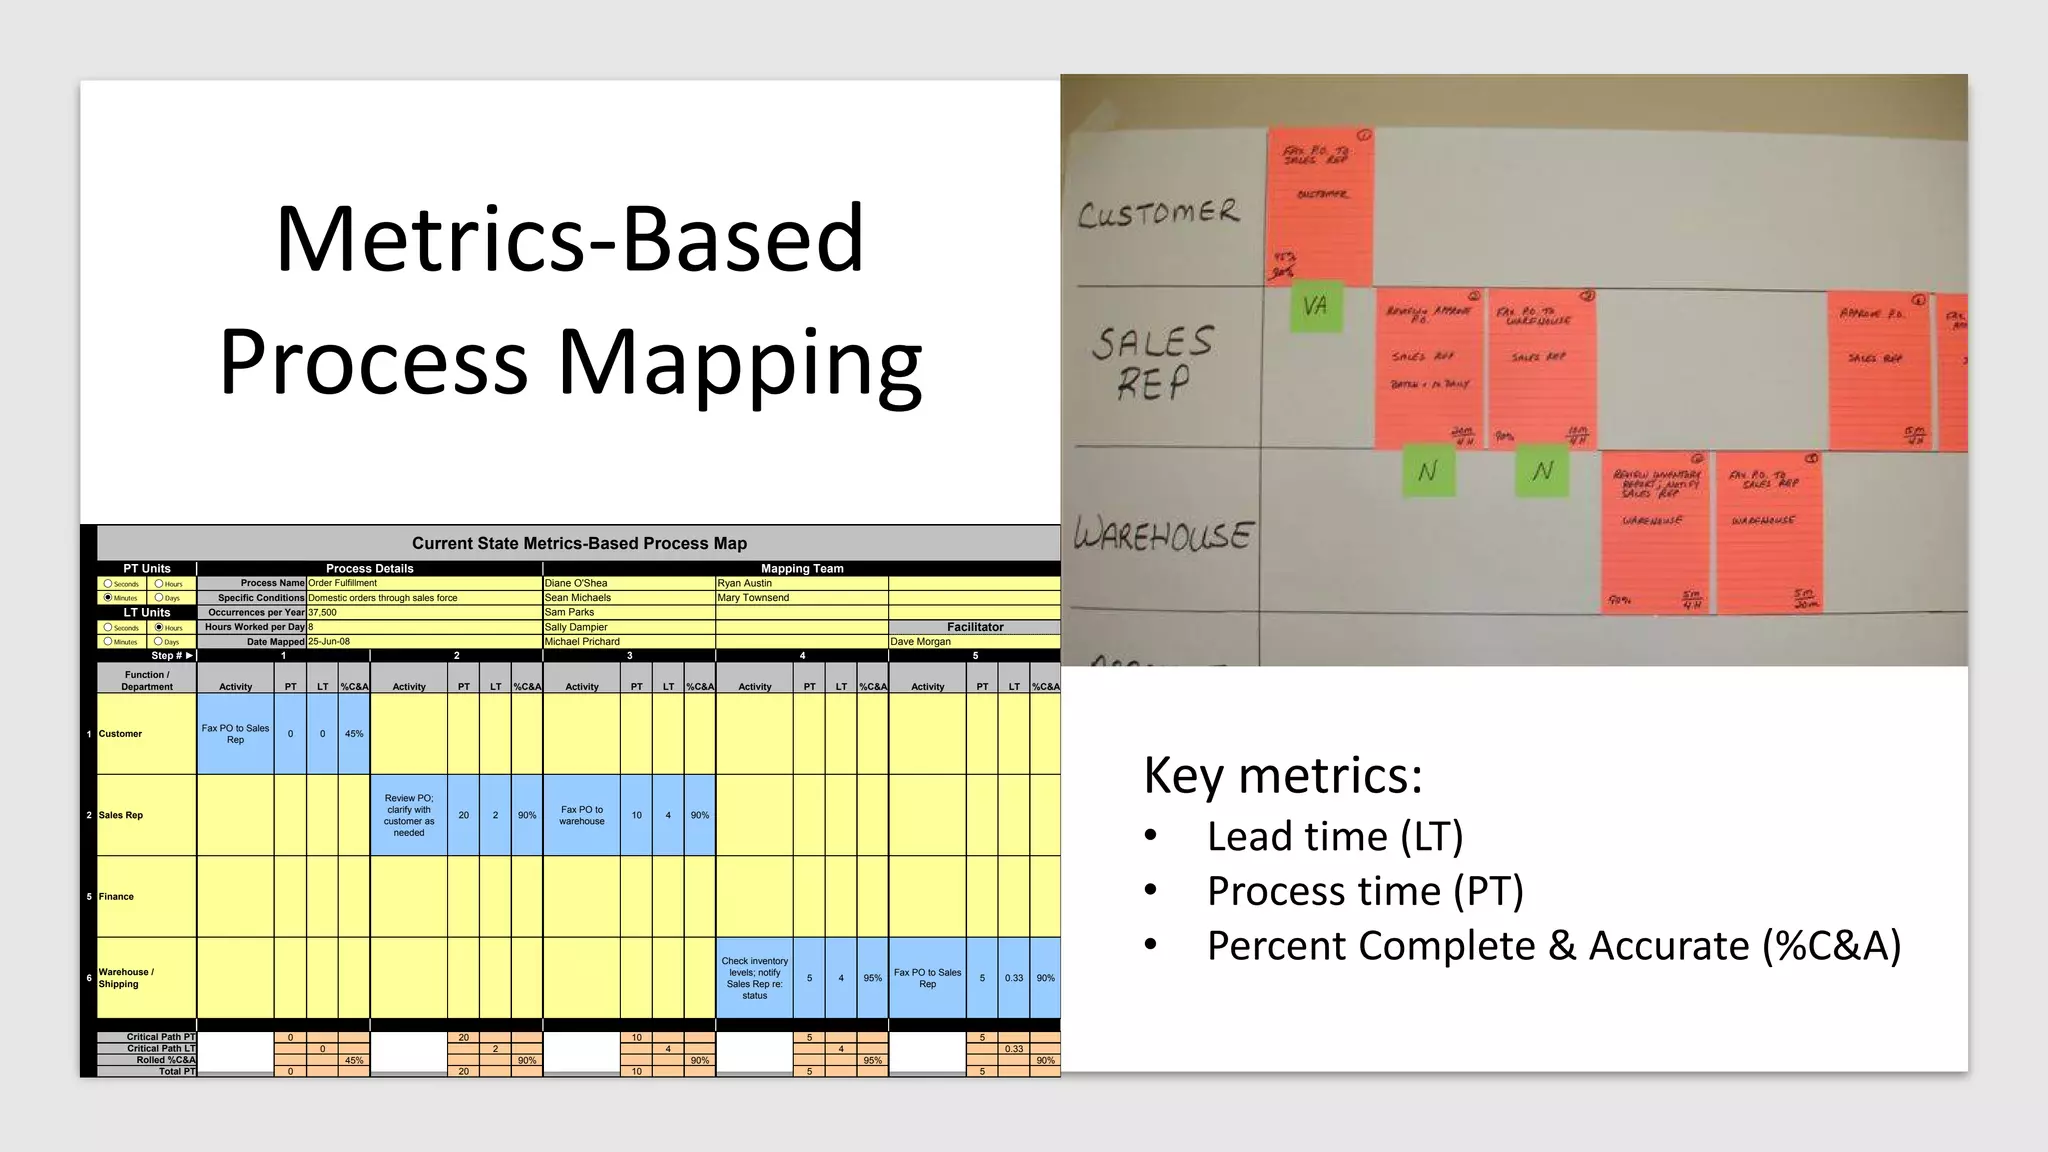
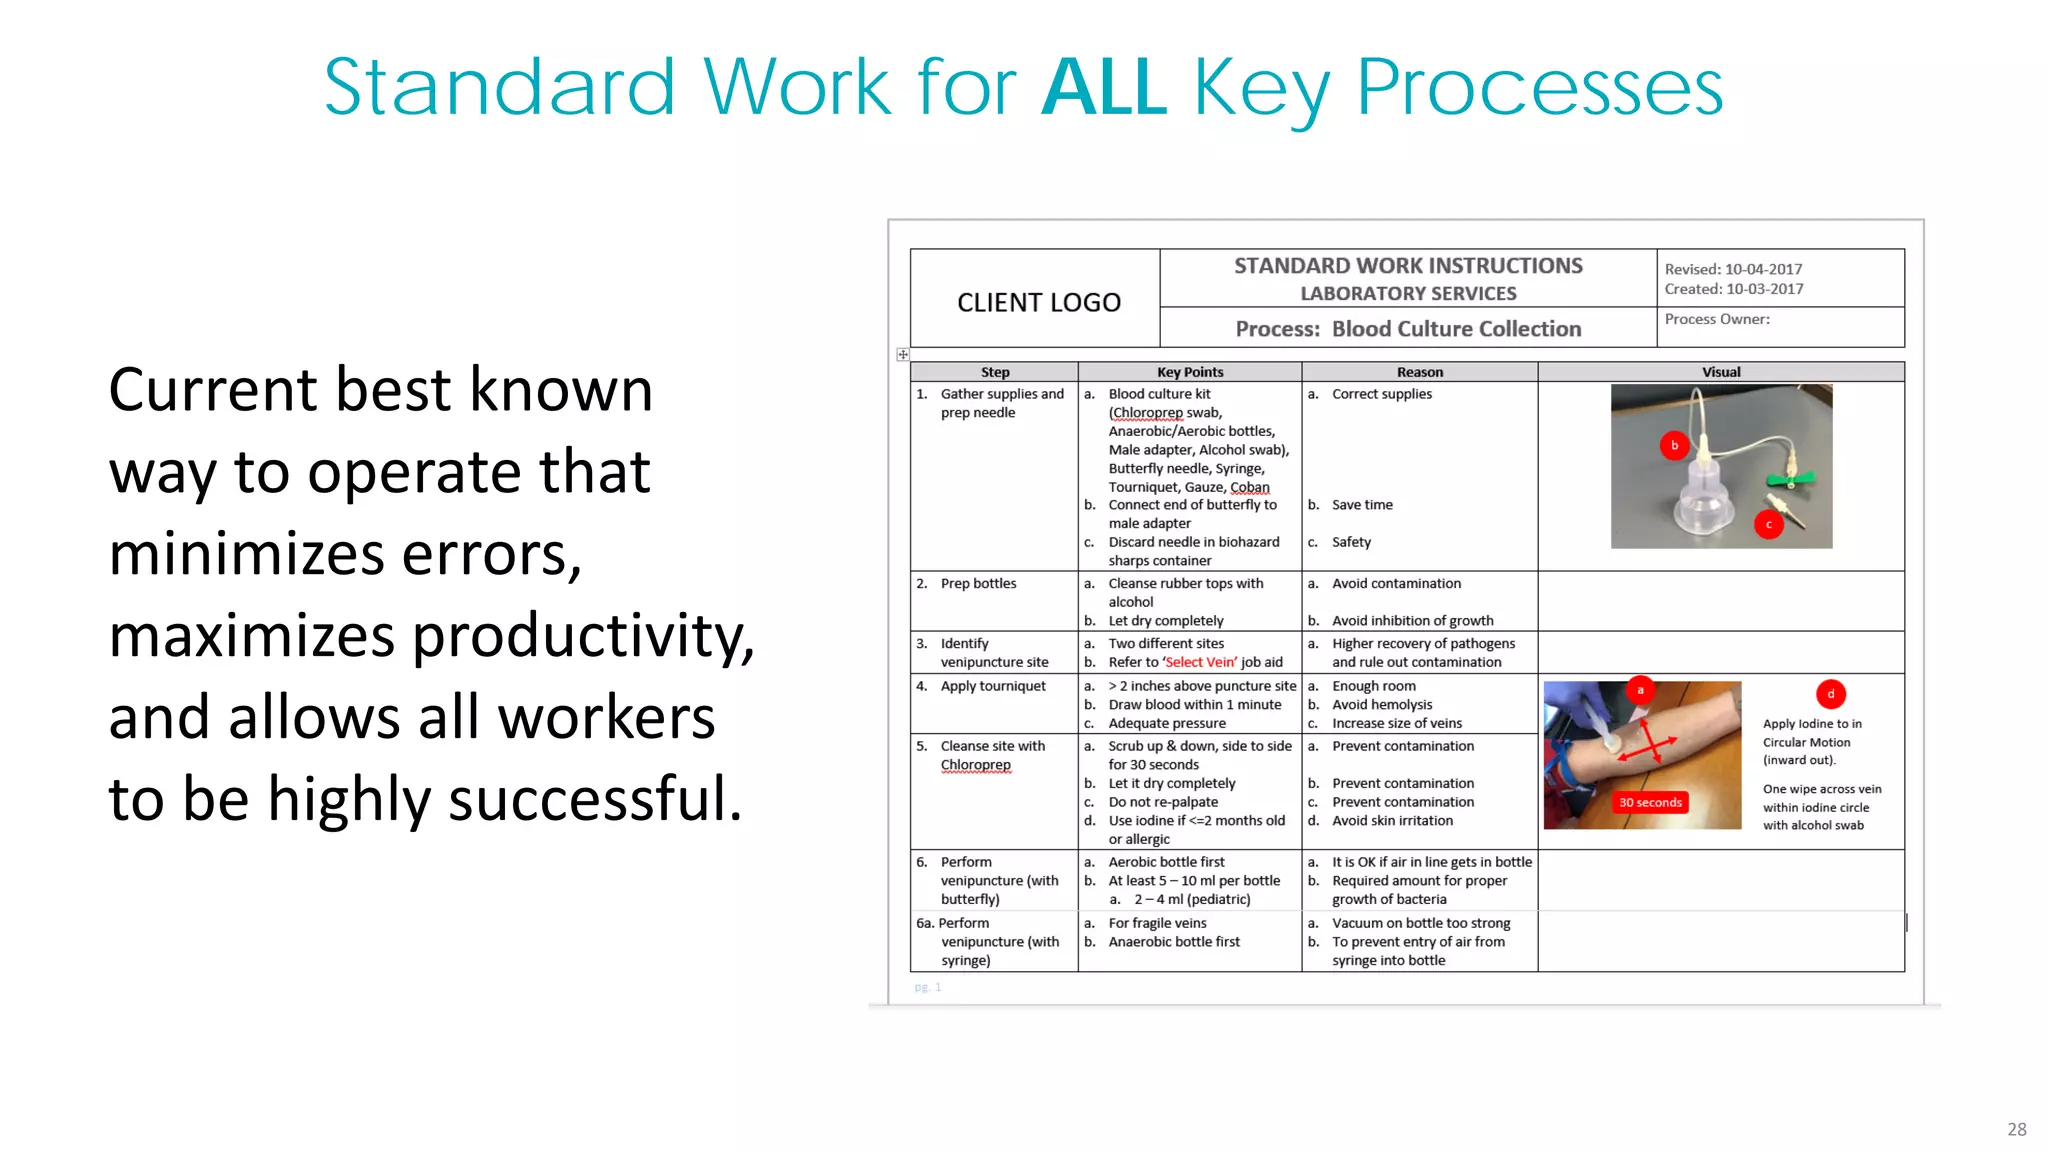


The document outlines methods for achieving organizational clarity through strategies involving purpose, priorities, process, performance, and problem solving, termed the five P's. It emphasizes the importance of value stream mapping to enhance understanding of workflows and identify inefficiencies, while promoting standard work practices for consistency and continuous improvement. Key metrics are discussed to gauge process efficacy and organizational effectiveness.