Downloaded 109 times

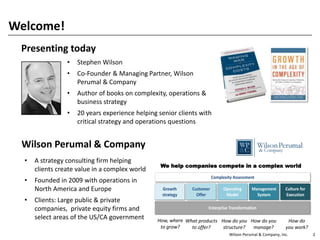

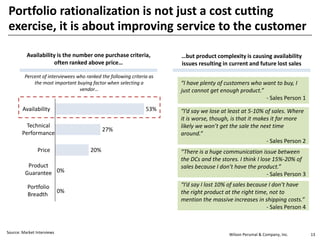
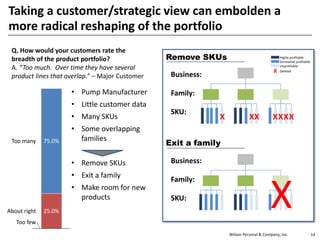
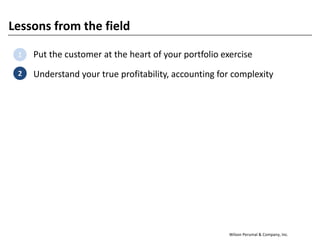
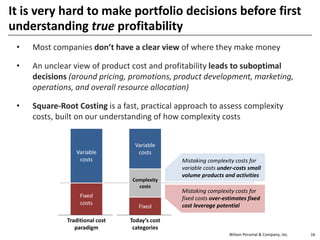
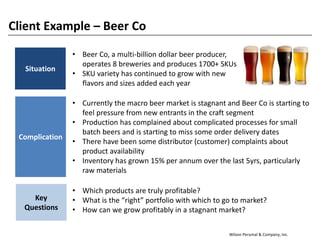
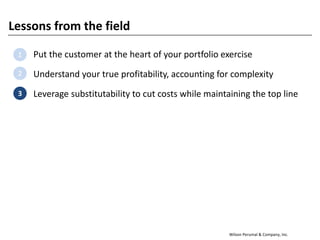
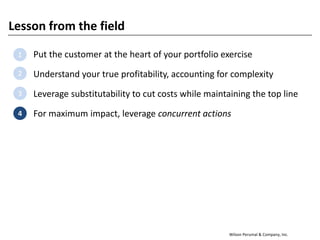

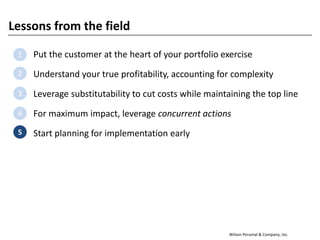


The document summarizes a webinar on lessons for successful portfolio optimization. Stephen Wilson of Wilson Perumal & Company discusses five key lessons from consulting with clients on portfolio optimization. The first lesson is to put the customer at the heart of any portfolio exercise to understand how the current portfolio impacts the customer experience. The second lesson is to understand the true profitability of products by accounting for the costs of complexity from offering a broad portfolio. Traditional accounting often fails to capture these complexitiy costs.