Downloaded 443 times


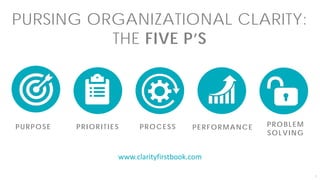
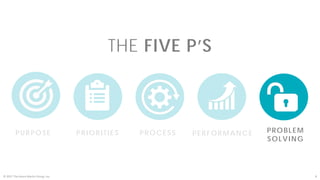


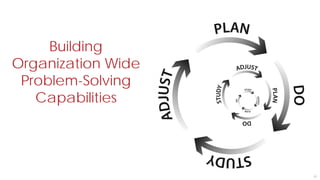
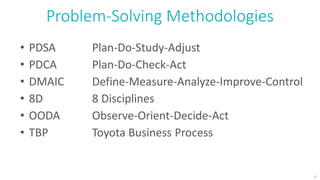
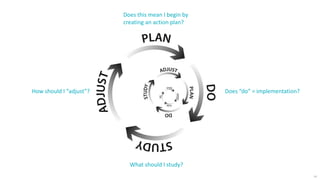
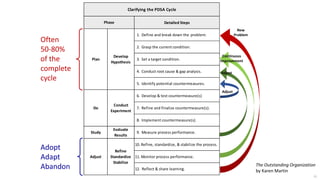
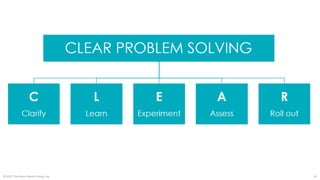
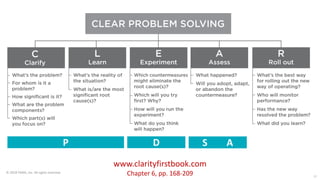
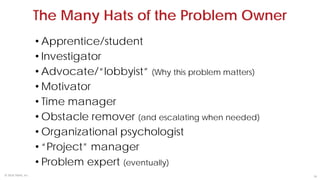


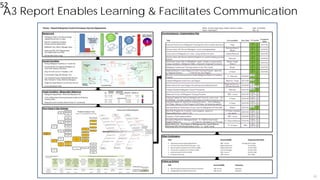


The document discusses organizational clarity and its importance in problem-solving, detailing methodologies such as PDCA and DMAIC. It outlines a structured approach for addressing problems, emphasizing understanding the current state, root cause analysis, and continuous improvement. Additionally, it highlights the roles of problem owners and coaches in fostering an effective problem-solving culture within organizations.