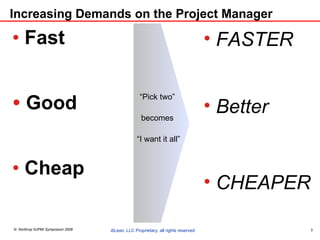
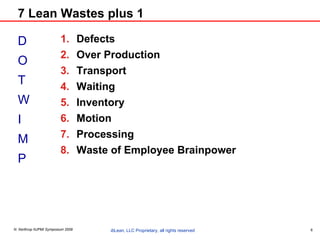
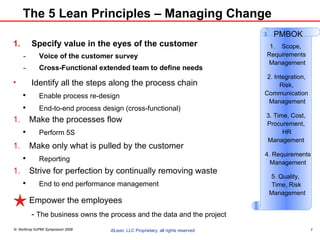
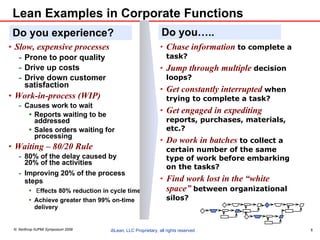
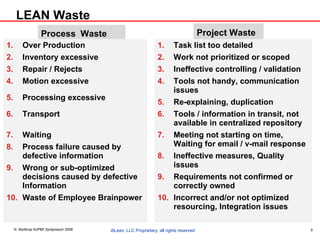
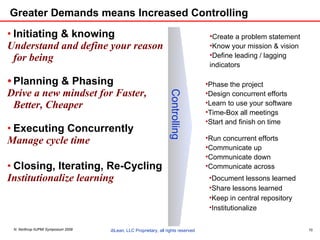
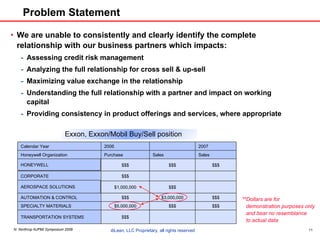
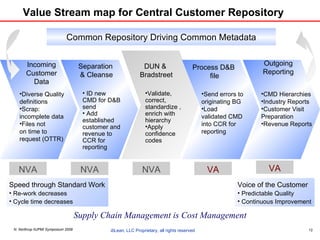
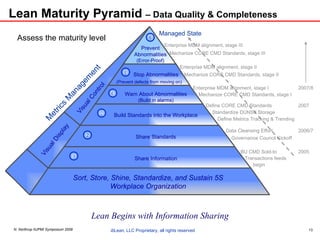
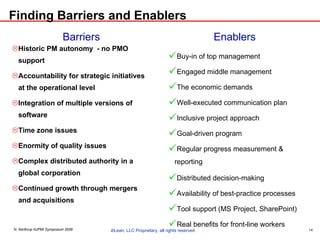
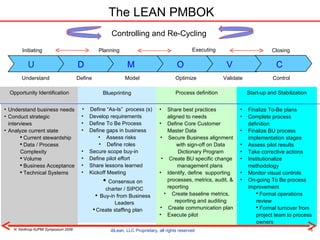
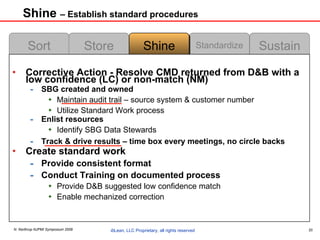
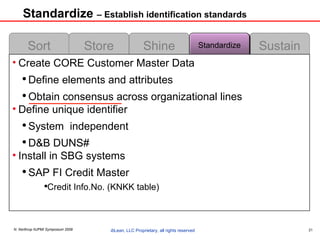
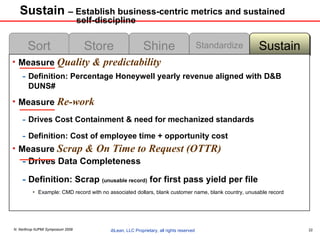
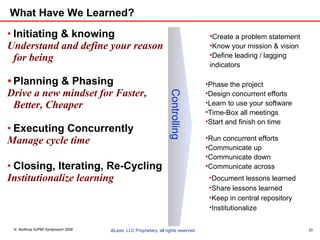
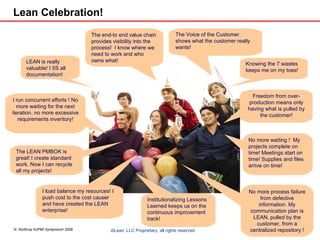
Nancy W. Northrup ib LEAN, LLC Owner and Principal (862) 812-2014 http://www.linkedin.com/in/nancynorthrup NJ PMI Chapter International Project Management Day November 5, 2009 Faster!  Better!  Cheaper! Presentation at PMI NJ  IPM Day 11/05/09
Table of Contents Introduction Defining Six Sigma LEAN Alignment to the PMBOK Project Example 5 S Process Wrap Up
Increasing Demands on the Project Manager Fast Good Cheap FASTER CHEAPER Better  “ Pick two”  becomes  “ I want it all”
Relationship to Management Disciplines Project Management General Management Area  Knowledge The Lean Enterprise Customer Service Finance Information  Systems Legal Communications Human  Resources EH&S Real Estate Auditing Credit and  Controls Security Purchasing Marketing Sales Business  Development Research Quality Control
The History of Lean Thinking  Waste triggers root cause analysis Determines opportunities for improvement Process redesign for improved flow Load balanced work groups End to end performance management Standard Work VOC/VOP Quality  Cost  Alignment  Taguchi & Deming Lean Manufacturing   Global Supply chain Control/Ownership Henry Ford - River Rouge Plant 1915 Cars for income levels - Paying by installments Collect Requirements Collect historical defect data Alfred Sloan - GM Variation 1926 Resource constraints WWII Focus on productivity Noise isolation Process Robustness 1950 Toyota Operating System USA buy-in to teachings of Deming Customer Metrics Process Control Metrics Functional Metrics Predictive ability (SPC) Scorecards 1915 1980+ Lean transformation requires changes to tools, standards, and procedures
7 Lean Wastes plus 1 Defects Over Production Transport Waiting Inventory Motion Processing Waste of Employee Brainpower D O T W I M P
The 5 Lean Principles – Managing Change Specify value in the eyes of the customer Voice of the customer survey Cross-Functional extended team to define needs Make the processes flow  Perform 5S Identify all the steps along the process chain Enable process re-design End-to-end process design (cross-functional) Make only what is pulled by the customer Reporting Strive for perfection by continually removing waste End to end performance management Empower the employees -  The business owns the process and the data and the project PMBOK Scope,  Requirements Management 2. Integration, Risk, Communication Management 3. Time, Cost,  Procurement,  HR Management  4. Requirements Management 5. Quality,  Time, Risk Management
Lean Examples in Corporate Functions Slow, expensive processes Prone to poor quality Drive up costs Drive down customer satisfaction  Work-in-process (WIP)  Causes work to wait Reports waiting to be addressed Sales orders waiting for processing  Waiting – 80/20 Rule 80% of the delay caused by  20% of the activities Improving 20% of the process steps E ffects 80% reduction in cycle time Achieve greater than 99% on-time delivery Do you….. Chase information  to complete a task?  Jump through multiple  decision loops? Get constantly interrupted  when trying to complete a task? Get engaged in expediting  reports, purchases, materials, etc.? Do work in batches  to collect a certain number of the same type of work before embarking on the tasks? Find work lost in the “white space”  between organizational silos? Do you experience?
LEAN Waste Process  Waste Over Production Inventory excessive Repair / Rejects Motion excessive Processing excessive Transport Waiting Process failure caused by defective information Wrong or sub-optimized decisions caused by defective Information Waste of Employee Brainpower Project Waste Task list too detailed  Work not prioritized or scoped  Ineffective controlling / validation Tools not handy, communication issues Re-explaining, duplication Tools / information in transit, not available in centralized repository Meeting not starting on time, Waiting for email / v-mail response Ineffective measures, Quality issues Requirements not confirmed or correctly owned Incorrect and/or not optimized resourcing, Integration issues
Greater Demands means Increased Controlling Initiating & knowing Understand and define your reason for being Planning & Phasing Drive a new mindset for Faster, Better, Cheaper Executing Concurrently Manage cycle time Closing, Iterating, Re-Cycling Institutionalize learning Create a problem statement Know your mission & vision Define leading / lagging  indicators Phase the project  Design concurrent efforts Learn to use your software Time-Box all meetings Start and finish on time Run concurrent efforts Communicate up Communicate down Communicate across Document lessons learned Share lessons learned Keep in central repository Institutionalize Controlling
Problem Statement We are unable to consistently and clearly identify the complete relationship with our business partners which impacts: Assessing credit risk management Analyzing the full relationship for cross sell & up-sell Maximizing value exchange in the relationship Understanding the full relationship with a partner and impact on working capital Providing consistency in product offerings and services, where appropriate Exxon, Exxon/Mobil Buy/Sell position **Dollars are for demonstration purposes only and bear no resemblance  to actual data Calendar Year 2006   2007 Honeywell Organization Purchase Sales Sales $$$ $$$ $$$ CORPORATE $$$     $1,000,000 $$$   AUTOMATION & CONTROL $$$ $3,000,000 $$$ SPECIALTY MATERIALS $5,000,000 $$$ $$$ TRANSPORTATION SYSTEMS $$$     HONEYWELL AEROSPACE SOLUTIONS
Value Stream map for Central Customer Repository Common Repository Driving Common Metadata Incoming Customer Data Diverse Quality definitions Scrap: incomplete data Files not  on time to  request (OTTR) Outgoing Reporting Process D&B  file CMD Hierarchies Industry Reports Customer Visit Preparation Revenue Reports Send errors to originating BG Load validated CMD into CCR for reporting DUN &  Bradstreet Separation & Cleanse Validate, correct, standardize , enrich with hierarchy Apply confidence codes ID new CMD for D&B send Add established customer and revenue to CCR for reporting NVA NVA VA VA NVA Speed through Standard Work Re-work decreases Cycle time decreases Voice of the Customer Predictable Quality Continuous Improvement Supply Chain Management is Cost Management
Lean Maturity Pyramid  – Data Quality & Completeness  Sort, Store, Shine, Standardize, and Sustain 5S Workplace Organization Share Information Share Standards Build Standards into the Workplace Prevent Abnormalities  (Error-Proof) Stop Abnormalities (Prevent defects from moving on) Warn About Abnormalities  (Build in alarms) Visual Display Visual Control BU CMD Sold-to  Transactions feeds begin  Governance Council Kickoff Metrics Management Managed State Data Cleansing Effort Define CORE CMD Standards Standardize DUNS# Storage Define Metrics Tracking & Trending 2007 2006/7 2005 2007/8 Mechanize CORE CMD Standards, stage II Mechanize CORE CMD Standards, stage III Enterprise MDM alignment, stage I Enterprise MDM alignment, stage II Enterprise MDM alignment, stage III Mechanize CORE CMD Standards, stage I Assess the maturity level Lean Begins with Information Sharing 6 5 4 3 2 1
Finding Barriers and Enablers Historic PM autonomy  - no PMO support  Accountability for strategic initiatives at the operational level  Integration of multiple versions of software Time zone issues Enormity of quality issues Complex distributed authority in a global corporation Continued growth through mergers and acquisitions Barriers Buy-in of top management  Engaged middle management  The economic demands Well-executed communication plan Inclusive project approach Goal-driven program Regular progress measurement & reporting Distributed decision-making Availability of best-practice processes Tool support (MS Project, SharePoint) Real benefits for front-line workers Enablers
The LEAN PMBOK Opportunity Identification Understand business needs Conduct strategic interviews  Analyze current state Current stewardship  Data / Process Complexity Volume Business Acceptance Technical Systems Process definition Share best practices aligned to needs Define Core Customer Master Data Secure Business alignment with sign-off on Data Dictionary Program Create BU specific change management plans  Identify, define  supporting processes, metrics, audit, & reporting Create baseline metrics, reporting and auditing Create communication plan Execute pilot Start-up and Stabilization Finalize To-Be plans Complete process definition Finalize BU process implementation stages  Assess pilot results Take corrective actions Institutionalize methodology Monitor visual controls On-going To Be process improvement Formal operations review Formal turnover from project team to process owners Executing Blueprinting Define “As-Is”  process (s) Develop requirements Define To Be Process Define gaps in business Assess risks Define roles Secure scope buy-in Define pilot effort Share lessons learned Kickoff Meeting Consensus on charter / SIPOC Buy-in from Business Leaders Create staffing plan U D M O V C Understand Define Model Optimize Validate Control Controlling and Re-Cycling Initiating Planning Closing
Load Balancing: Leverage Business Knowledge Delegate! Drive cost to the cost owner  PM tracks, reviews progress, drives issue resolution Misuse of the PM Project Manager / Data Steward Driving Business Data Ownership Institutionalizes Stewardship SBG N/A N/A SBG N/A N/A I’m tired
5 S  Process SUSTAIN Monitor / Measure Utilize documented standards STANDARDIZE SHINE Take corrective action STORE Create a place for everything SORT Keep only the necessary to perform the task
Sort  -  Establish goal and standard definitions Goal:  Deliver continued improvement in CD2 quality  Establish Scope and Criteria High confidence D&B DUNS# match to Sold-to customer records aligned with sales dollars  Define ownership -  BU owned and managed, CD2 team assisting  Store Shine Standardize Sustain Sort
STORE  – Establish standard structures Determine required quantities Label needed items Maintain transaction traceability  Define D&B DUNS# as key code – system independent & family linkage Create a place for everything Define scrap and remove from the process  Enrich CMD records through the D&B process Develop shadow boards aligning CMD by family Sort Shine Standardize Sustain Store
Shine  – Establish standard procedures Corrective Action - Resolve CMD returned from D&B with a low confidence (LC) or non-match (NM) SBG created and owned Maintain audit trail – source system & customer number Utilize Standard Work process Enlist resources Identify SBG Data Stewards Track & drive results – time box every meetings, no circle backs Create standard work Provide consistent format Conduct Training on documented process Provide D&B suggested low confidence match Enable mechanized correction Sort Store Standardize Sustain Shine
Standardize  – Establish identification standards Sort Store Shine Sustain Standardize Create CORE Customer Master Data  Define elements and attributes Obtain consensus across organizational lines Define unique identifier  System  independent D&B DUNS# Install in SBG systems SAP FI Credit Master  Credit Info.No. (KNKK table)
Sustain  – Establish business-centric metrics and sustained   self-discipline  Measure  Quality & predictability Definition: Percentage Honeywell yearly revenue aligned with D&B DUNS# Measure  Re-work Drives Cost Containment & need for mechanized standards Definition: Cost of employee time + opportunity cost  Measure  Scrap & On Time to Request (OTTR) Drives Data Completeness  Definition: Scrap  (unusable record)  for first pass yield per file Example: CMD record with no associated dollars, blank customer name, blank country, unusable record Sort Store Shine Standardize Sustain
What Have We Learned? Initiating & knowing Understand and define your reason for being Planning & Phasing Drive a new mindset for Faster, Better, Cheaper Executing Concurrently Manage cycle time Closing, Iterating, Re-Cycling Institutionalize learning Create a problem statement Know your mission & vision Define leading / lagging  indicators Phase the project  Design concurrent efforts Learn to use your software Time-Box all meetings Start and finish on time Run concurrent efforts Communicate up Communicate down Communicate across Document lessons learned Share lessons learned Keep in central repository Institutionalize Controlling
Lean Celebration! The Voice of the Customer shows what the customer really wants! LEAN is really valuable! I 5S all documentation!  The LEAN PMBOK is great! I create standard work. Now I can recycle all my projects! I run concurrent efforts ! No more waiting for the next iteration, no more excessive requirements inventory! Knowing the 7 wastes keeps me on my toes! The end-to end value chain provides visibility into the process!  I know where we need to work and who owns what! I load balance my resources! I push cost to the cost causer and have created the LEAN enterprise! No more waiting !  My projects complete on time! Meetings start on time! Supplies and files arrive on time! Freedom from over-production means only having what is pulled by the customer! No more process failure from defective information. My communication plan is LEAN, pulled by the customer, from a centralized repository ! Institutionalizing Lessons Learned keeps us on the continuous improvement track!
Questions?
ib Lean, LLC, Nancy W. Northrup ib LEAN, LLC, a Continuous Process Improvement  company, specializes in the areas of:  Master Data Governance Building the Project Office Project Turnarounds Six Sigma Leadership ib LEAN, LLC is currently partnering with  Vector International  to provide Six Sigma Training and Certification. Training, coaching, mentoring Nancy W. Northrup is an experienced Project Management Professional certified in Six Sigma Black Belt, Six Sigma Lean Black Belt, and trained and certified in DFSS and DMAIC.
Nancy W. Northrup ib LEAN, LLC Owner and Principal (862) 812-2014 http://www.linkedin.com/in/nancynorthrup Faster!  Better!  Cheaper! Presentation at PMI NJ  IPM Day 11/05/09

Better Faster Cheaper

  • 1.
    Nancy W. Northrupib LEAN, LLC Owner and Principal (862) 812-2014 http://www.linkedin.com/in/nancynorthrup NJ PMI Chapter International Project Management Day November 5, 2009 Faster! Better! Cheaper! Presentation at PMI NJ IPM Day 11/05/09
  • 2.
    Table of ContentsIntroduction Defining Six Sigma LEAN Alignment to the PMBOK Project Example 5 S Process Wrap Up
  • 3.
    Increasing Demands onthe Project Manager Fast Good Cheap FASTER CHEAPER Better “ Pick two” becomes “ I want it all”
  • 4.
    Relationship to ManagementDisciplines Project Management General Management Area Knowledge The Lean Enterprise Customer Service Finance Information Systems Legal Communications Human Resources EH&S Real Estate Auditing Credit and Controls Security Purchasing Marketing Sales Business Development Research Quality Control
  • 5.
    The History ofLean Thinking Waste triggers root cause analysis Determines opportunities for improvement Process redesign for improved flow Load balanced work groups End to end performance management Standard Work VOC/VOP Quality Cost Alignment Taguchi & Deming Lean Manufacturing Global Supply chain Control/Ownership Henry Ford - River Rouge Plant 1915 Cars for income levels - Paying by installments Collect Requirements Collect historical defect data Alfred Sloan - GM Variation 1926 Resource constraints WWII Focus on productivity Noise isolation Process Robustness 1950 Toyota Operating System USA buy-in to teachings of Deming Customer Metrics Process Control Metrics Functional Metrics Predictive ability (SPC) Scorecards 1915 1980+ Lean transformation requires changes to tools, standards, and procedures
  • 6.
    7 Lean Wastesplus 1 Defects Over Production Transport Waiting Inventory Motion Processing Waste of Employee Brainpower D O T W I M P
  • 7.
    The 5 LeanPrinciples – Managing Change Specify value in the eyes of the customer Voice of the customer survey Cross-Functional extended team to define needs Make the processes flow Perform 5S Identify all the steps along the process chain Enable process re-design End-to-end process design (cross-functional) Make only what is pulled by the customer Reporting Strive for perfection by continually removing waste End to end performance management Empower the employees - The business owns the process and the data and the project PMBOK Scope, Requirements Management 2. Integration, Risk, Communication Management 3. Time, Cost, Procurement, HR Management 4. Requirements Management 5. Quality, Time, Risk Management
  • 8.
    Lean Examples inCorporate Functions Slow, expensive processes Prone to poor quality Drive up costs Drive down customer satisfaction Work-in-process (WIP) Causes work to wait Reports waiting to be addressed Sales orders waiting for processing Waiting – 80/20 Rule 80% of the delay caused by 20% of the activities Improving 20% of the process steps E ffects 80% reduction in cycle time Achieve greater than 99% on-time delivery Do you….. Chase information to complete a task? Jump through multiple decision loops? Get constantly interrupted when trying to complete a task? Get engaged in expediting reports, purchases, materials, etc.? Do work in batches to collect a certain number of the same type of work before embarking on the tasks? Find work lost in the “white space” between organizational silos? Do you experience?
  • 9.
    LEAN Waste Process Waste Over Production Inventory excessive Repair / Rejects Motion excessive Processing excessive Transport Waiting Process failure caused by defective information Wrong or sub-optimized decisions caused by defective Information Waste of Employee Brainpower Project Waste Task list too detailed Work not prioritized or scoped Ineffective controlling / validation Tools not handy, communication issues Re-explaining, duplication Tools / information in transit, not available in centralized repository Meeting not starting on time, Waiting for email / v-mail response Ineffective measures, Quality issues Requirements not confirmed or correctly owned Incorrect and/or not optimized resourcing, Integration issues
  • 10.
    Greater Demands meansIncreased Controlling Initiating & knowing Understand and define your reason for being Planning & Phasing Drive a new mindset for Faster, Better, Cheaper Executing Concurrently Manage cycle time Closing, Iterating, Re-Cycling Institutionalize learning Create a problem statement Know your mission & vision Define leading / lagging indicators Phase the project Design concurrent efforts Learn to use your software Time-Box all meetings Start and finish on time Run concurrent efforts Communicate up Communicate down Communicate across Document lessons learned Share lessons learned Keep in central repository Institutionalize Controlling
  • 11.
    Problem Statement Weare unable to consistently and clearly identify the complete relationship with our business partners which impacts: Assessing credit risk management Analyzing the full relationship for cross sell & up-sell Maximizing value exchange in the relationship Understanding the full relationship with a partner and impact on working capital Providing consistency in product offerings and services, where appropriate Exxon, Exxon/Mobil Buy/Sell position **Dollars are for demonstration purposes only and bear no resemblance to actual data Calendar Year 2006   2007 Honeywell Organization Purchase Sales Sales $$$ $$$ $$$ CORPORATE $$$     $1,000,000 $$$   AUTOMATION & CONTROL $$$ $3,000,000 $$$ SPECIALTY MATERIALS $5,000,000 $$$ $$$ TRANSPORTATION SYSTEMS $$$     HONEYWELL AEROSPACE SOLUTIONS
  • 12.
    Value Stream mapfor Central Customer Repository Common Repository Driving Common Metadata Incoming Customer Data Diverse Quality definitions Scrap: incomplete data Files not on time to request (OTTR) Outgoing Reporting Process D&B file CMD Hierarchies Industry Reports Customer Visit Preparation Revenue Reports Send errors to originating BG Load validated CMD into CCR for reporting DUN & Bradstreet Separation & Cleanse Validate, correct, standardize , enrich with hierarchy Apply confidence codes ID new CMD for D&B send Add established customer and revenue to CCR for reporting NVA NVA VA VA NVA Speed through Standard Work Re-work decreases Cycle time decreases Voice of the Customer Predictable Quality Continuous Improvement Supply Chain Management is Cost Management
  • 13.
    Lean Maturity Pyramid – Data Quality & Completeness Sort, Store, Shine, Standardize, and Sustain 5S Workplace Organization Share Information Share Standards Build Standards into the Workplace Prevent Abnormalities (Error-Proof) Stop Abnormalities (Prevent defects from moving on) Warn About Abnormalities (Build in alarms) Visual Display Visual Control BU CMD Sold-to Transactions feeds begin Governance Council Kickoff Metrics Management Managed State Data Cleansing Effort Define CORE CMD Standards Standardize DUNS# Storage Define Metrics Tracking & Trending 2007 2006/7 2005 2007/8 Mechanize CORE CMD Standards, stage II Mechanize CORE CMD Standards, stage III Enterprise MDM alignment, stage I Enterprise MDM alignment, stage II Enterprise MDM alignment, stage III Mechanize CORE CMD Standards, stage I Assess the maturity level Lean Begins with Information Sharing 6 5 4 3 2 1
  • 14.
    Finding Barriers andEnablers Historic PM autonomy - no PMO support Accountability for strategic initiatives at the operational level Integration of multiple versions of software Time zone issues Enormity of quality issues Complex distributed authority in a global corporation Continued growth through mergers and acquisitions Barriers Buy-in of top management Engaged middle management The economic demands Well-executed communication plan Inclusive project approach Goal-driven program Regular progress measurement & reporting Distributed decision-making Availability of best-practice processes Tool support (MS Project, SharePoint) Real benefits for front-line workers Enablers
  • 15.
    The LEAN PMBOKOpportunity Identification Understand business needs Conduct strategic interviews Analyze current state Current stewardship Data / Process Complexity Volume Business Acceptance Technical Systems Process definition Share best practices aligned to needs Define Core Customer Master Data Secure Business alignment with sign-off on Data Dictionary Program Create BU specific change management plans Identify, define supporting processes, metrics, audit, & reporting Create baseline metrics, reporting and auditing Create communication plan Execute pilot Start-up and Stabilization Finalize To-Be plans Complete process definition Finalize BU process implementation stages Assess pilot results Take corrective actions Institutionalize methodology Monitor visual controls On-going To Be process improvement Formal operations review Formal turnover from project team to process owners Executing Blueprinting Define “As-Is” process (s) Develop requirements Define To Be Process Define gaps in business Assess risks Define roles Secure scope buy-in Define pilot effort Share lessons learned Kickoff Meeting Consensus on charter / SIPOC Buy-in from Business Leaders Create staffing plan U D M O V C Understand Define Model Optimize Validate Control Controlling and Re-Cycling Initiating Planning Closing
  • 16.
    Load Balancing: LeverageBusiness Knowledge Delegate! Drive cost to the cost owner PM tracks, reviews progress, drives issue resolution Misuse of the PM Project Manager / Data Steward Driving Business Data Ownership Institutionalizes Stewardship SBG N/A N/A SBG N/A N/A I’m tired
  • 17.
    5 S Process SUSTAIN Monitor / Measure Utilize documented standards STANDARDIZE SHINE Take corrective action STORE Create a place for everything SORT Keep only the necessary to perform the task
  • 18.
    Sort - Establish goal and standard definitions Goal: Deliver continued improvement in CD2 quality Establish Scope and Criteria High confidence D&B DUNS# match to Sold-to customer records aligned with sales dollars Define ownership - BU owned and managed, CD2 team assisting Store Shine Standardize Sustain Sort
  • 19.
    STORE –Establish standard structures Determine required quantities Label needed items Maintain transaction traceability Define D&B DUNS# as key code – system independent & family linkage Create a place for everything Define scrap and remove from the process Enrich CMD records through the D&B process Develop shadow boards aligning CMD by family Sort Shine Standardize Sustain Store
  • 20.
    Shine –Establish standard procedures Corrective Action - Resolve CMD returned from D&B with a low confidence (LC) or non-match (NM) SBG created and owned Maintain audit trail – source system & customer number Utilize Standard Work process Enlist resources Identify SBG Data Stewards Track & drive results – time box every meetings, no circle backs Create standard work Provide consistent format Conduct Training on documented process Provide D&B suggested low confidence match Enable mechanized correction Sort Store Standardize Sustain Shine
  • 21.
    Standardize –Establish identification standards Sort Store Shine Sustain Standardize Create CORE Customer Master Data Define elements and attributes Obtain consensus across organizational lines Define unique identifier System independent D&B DUNS# Install in SBG systems SAP FI Credit Master Credit Info.No. (KNKK table)
  • 22.
    Sustain –Establish business-centric metrics and sustained self-discipline Measure Quality & predictability Definition: Percentage Honeywell yearly revenue aligned with D&B DUNS# Measure Re-work Drives Cost Containment & need for mechanized standards Definition: Cost of employee time + opportunity cost Measure Scrap & On Time to Request (OTTR) Drives Data Completeness Definition: Scrap (unusable record) for first pass yield per file Example: CMD record with no associated dollars, blank customer name, blank country, unusable record Sort Store Shine Standardize Sustain
  • 23.
    What Have WeLearned? Initiating & knowing Understand and define your reason for being Planning & Phasing Drive a new mindset for Faster, Better, Cheaper Executing Concurrently Manage cycle time Closing, Iterating, Re-Cycling Institutionalize learning Create a problem statement Know your mission & vision Define leading / lagging indicators Phase the project Design concurrent efforts Learn to use your software Time-Box all meetings Start and finish on time Run concurrent efforts Communicate up Communicate down Communicate across Document lessons learned Share lessons learned Keep in central repository Institutionalize Controlling
  • 24.
    Lean Celebration! TheVoice of the Customer shows what the customer really wants! LEAN is really valuable! I 5S all documentation! The LEAN PMBOK is great! I create standard work. Now I can recycle all my projects! I run concurrent efforts ! No more waiting for the next iteration, no more excessive requirements inventory! Knowing the 7 wastes keeps me on my toes! The end-to end value chain provides visibility into the process! I know where we need to work and who owns what! I load balance my resources! I push cost to the cost causer and have created the LEAN enterprise! No more waiting ! My projects complete on time! Meetings start on time! Supplies and files arrive on time! Freedom from over-production means only having what is pulled by the customer! No more process failure from defective information. My communication plan is LEAN, pulled by the customer, from a centralized repository ! Institutionalizing Lessons Learned keeps us on the continuous improvement track!
  • 25.
  • 26.
    ib Lean, LLC,Nancy W. Northrup ib LEAN, LLC, a Continuous Process Improvement company, specializes in the areas of: Master Data Governance Building the Project Office Project Turnarounds Six Sigma Leadership ib LEAN, LLC is currently partnering with Vector International to provide Six Sigma Training and Certification. Training, coaching, mentoring Nancy W. Northrup is an experienced Project Management Professional certified in Six Sigma Black Belt, Six Sigma Lean Black Belt, and trained and certified in DFSS and DMAIC.
  • 27.
    Nancy W. Northrupib LEAN, LLC Owner and Principal (862) 812-2014 http://www.linkedin.com/in/nancynorthrup Faster! Better! Cheaper! Presentation at PMI NJ IPM Day 11/05/09

Editor's Notes

  • #7 (repair or rejects or wrong information resulting in sub-optimized decisions or process failures)
  • #20 3
  • #21 3