haitai confectionery n foods 101530 Algorithm Investment Report
•
1 like•57 views

This document provides financial and performance data for an unnamed company over several quarterly and annual periods. It includes metrics like sales, operating profit, net income, debt ratios, and stock prices. It also evaluates the company's current stock price compared to different indication price ranges and makes investment recommendations. Overall, the document analyzes the company's past financial trends and uses an algorithm to provide a performance summary and suggested investment strategy.
![[Price for scheduled purchasing]
Arbitrarily made
Algorithm stocks Trading Strategies (consolidated) 101530 Date
Period
Gap
(Indication /
stock)
Color
low price 11,296 W 11,296 W ~ 0 W 24 % -1,036,178 W -92
Low mid 14,791 W 14,791 W ~ 11,296 W 62 % -2,715,241 W -184
Mid 18,285 W 18,285 W ~ 14,791 W 100 % -4,394,304 W All selling
High mid 21,779 W 21,779 W ~ 18,285 W 138 % -6,073,368 W All selling
Suggested Purchase
Amount 4,392,020 W
Number of stocks
purchased 481
Indication price Range Buying / Selling Buying / Selling [Stocks]
High price 25,273 W 25,273 W~ ~ 21,779 W 177 % -7,752,431 W All selling
2021-04-15
3 months
Current stock price Evaluation
Stock price rise
probability score
Investment opinion Prospective purchase amount
9,140 W Low price 55.1 Normal 10,000,000 W
43.9 33.0 40.4 20.8 35.9 46.1
2020.11.17 2020.12.15 2021.01.15 2021.02.16 2021.03.17 2021.04.14
Stock price rise
probability score
A Sector 45.8 45.2 45.4 49.2 45.6 51.8
55.1
B Sector 42.1 20.8 35.4 49.2 26.3 40.4
Total average
2021.01.15 2021.02.16 2021.03.17 2021.04.14
Total of
increase rate
Total score
A Sector -1 % 0 % 8 % -8 % 12 %
-9 % 49.0
B Sector -102 % 41 % 28 % -87 % 35 %
Total average -33 % 18 % -94 % 42 % 22 %
2020.12.15
46 45 45
49
46
52
42
21
35
49
26
40
44
33
40
21
36
46
0
10
20
30
40
50
60
2020.11.17 2020.12.15 2021.01.15 2021.02.16 2021.03.17 2021.04.14
Stock price rise probability score
A sector
B sector
Total average
-1% 0%
8%
-8%
12%
-102%
41%
28%
-87%
35%
-33%
18%
-94%
42%
22%
-120%
-100%
-80%
-60%
-40%
-20%
0%
20%
40%
60%
2020.12.15 2021.01.15 2021.02.16 2021.03.17 2021.04.14
Increase rate of stock price rise
A sector
B sector
Total average
haitai confectionery n foods](data:image/gif;base64,R0lGODlhAQABAIAAAAAAAP///yH5BAEAAAAALAAAAAABAAEAAAIBRAA7)
Recommended
Recommended
More Related Content
What's hot
What's hot (20)
Similar to haitai confectionery n foods 101530 Algorithm Investment Report
Similar to haitai confectionery n foods 101530 Algorithm Investment Report (20)
More from 알고리즘 기업분석 컨설팅-알기컨,algikeon
More from 알고리즘 기업분석 컨설팅-알기컨,algikeon (20)
Recently uploaded
Recently uploaded (20)
haitai confectionery n foods 101530 Algorithm Investment Report
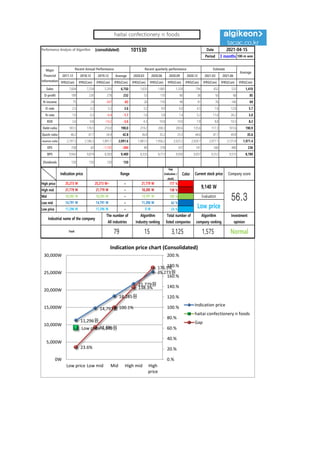
- 1. Performance Analysis of Algorithm (consolidated) 101530 Date Period 3 months 100-m won 2017.12 2018.12 2019.12 Average 2020.03 2020.06 2020.09 2020.12 2021.03 2021.06 IFRS(Con) IFRS(Con) IFRS(Con) IFRS(Con) IFRS(Con) IFRS(Con) IFRS(Con) IFRS(Con) IFRS(Con) IFRS(Con) IFRS(Con) Sales 7,604 7,254 5,393 6,750 1,635 1,881 1,328 796 652 533 1,410 O-profit 189 230 278 232 53 170 80 36 50 68 85 N-income 75 24 -347 -83 26 110 98 41 76 140 69 O-rate 2.5 3.2 5.2 3.6 3.2 9.0 6.0 4.5 7.6 12.8 5.7 N-rate 1.0 0.3 -6.4 -1.7 1.6 5.8 7.4 5.2 11.6 26.2 5.0 ROE 2.6 0.8 -14.2 -3.6 4.3 10.8 10.0 7.8 8.8 10.3 8.2 Debt-ratio 183.5 176.5 210.0 190.0 219.2 208.3 200.6 135.6 117.3 101.6 190.9 Quick-ratio 46.2 47.7 34.4 42.8 36.8 35.2 25.5 44.6 47.1 49.8 35.6 reserve-ratio 2,197.3 2,186.3 1,891.1 2,091.6 1,881.5 1,956.2 2,023.3 2,024.7 2,077.1 2,131.8 1,971.4 EPS 258 82 -1,192 -284 89 378 337 141 260 480 236 BPS 9,943 9,874 8,383 9,400 8,335 8,713 9,050 9,057 9,312 9,575 8,789 Dividends 150 150 150 150 Major Financial Information Recent Annual Performance Recent quarterly performance Estimate Average 2021-04-15 Gap (Indication / stock) Color High price ~ 177 % High mid ~ 138 % Mid ~ 100 % Low mid ~ 62 % Low price ~ 24 % Normal 11,296 W 11,296 W 0 W Industrial name of the company The number of All industries Algorithm Industry ranking Total number of listed companies Algorithm company ranking Investment opinion Food 79 15 3,125 1,575 21,779 W 21,779 W 18,285 W 18,285 W 18,285 W 14,791 W Evaluation 25,273 W 25,273 W~ 21,779 W 9,140 W 56.3 14,791 W 14,791 W 11,296 W Low price Indication price Range Current stock price Company score 11,296원 14,791원 18,285원 21,779원 25,273원 Low price 9,140원 23.6% 61.8% 100.1% 138.3% 176.5% 0.% 20.% 40.% 60.% 80.% 100.% 120.% 140.% 160.% 180.% 200.% 0W 5,000W 10,000W 15,000W 20,000W 25,000W 30,000W Low price Low mid Mid High mid High price Indication price chart (Consolidated) Indication price haitai confectionery n foods Gap haitai confectionery n foods
- 2. [Price for scheduled purchasing] Arbitrarily made Algorithm stocks Trading Strategies (consolidated) 101530 Date Period Gap (Indication / stock) Color low price 11,296 W 11,296 W ~ 0 W 24 % -1,036,178 W -92 Low mid 14,791 W 14,791 W ~ 11,296 W 62 % -2,715,241 W -184 Mid 18,285 W 18,285 W ~ 14,791 W 100 % -4,394,304 W All selling High mid 21,779 W 21,779 W ~ 18,285 W 138 % -6,073,368 W All selling Suggested Purchase Amount 4,392,020 W Number of stocks purchased 481 Indication price Range Buying / Selling Buying / Selling [Stocks] High price 25,273 W 25,273 W~ ~ 21,779 W 177 % -7,752,431 W All selling 2021-04-15 3 months Current stock price Evaluation Stock price rise probability score Investment opinion Prospective purchase amount 9,140 W Low price 55.1 Normal 10,000,000 W 43.9 33.0 40.4 20.8 35.9 46.1 2020.11.17 2020.12.15 2021.01.15 2021.02.16 2021.03.17 2021.04.14 Stock price rise probability score A Sector 45.8 45.2 45.4 49.2 45.6 51.8 55.1 B Sector 42.1 20.8 35.4 49.2 26.3 40.4 Total average 2021.01.15 2021.02.16 2021.03.17 2021.04.14 Total of increase rate Total score A Sector -1 % 0 % 8 % -8 % 12 % -9 % 49.0 B Sector -102 % 41 % 28 % -87 % 35 % Total average -33 % 18 % -94 % 42 % 22 % 2020.12.15 46 45 45 49 46 52 42 21 35 49 26 40 44 33 40 21 36 46 0 10 20 30 40 50 60 2020.11.17 2020.12.15 2021.01.15 2021.02.16 2021.03.17 2021.04.14 Stock price rise probability score A sector B sector Total average -1% 0% 8% -8% 12% -102% 41% 28% -87% 35% -33% 18% -94% 42% 22% -120% -100% -80% -60% -40% -20% 0% 20% 40% 60% 2020.12.15 2021.01.15 2021.02.16 2021.03.17 2021.04.14 Increase rate of stock price rise A sector B sector Total average haitai confectionery n foods
- 3. 정보와 완전 정보 결 투자판단 있습니 위배 무단으 숙지하 Compliance notice ① The information provided by The Algorithm Company Analysis Consulting is obtained through reliable data and information and The Algorithm Company Analysis Program (TACAP), but its accuracy or completeness are not guaranteed. Furthermore, it may change over time.Therefore, we are not legally responsible for the results of the data provided by The Algorithm Company Analysis Consulting because of information errors or omissions. ② The Algorithm Company Analysis Consulting and all the information provided on it site are reference materials for investment decisions and the final responsibility of investment is up to users utilizing this information. ③ The Algorithm Company Analysis Consulting and its site do not do anything that violates the related laws such as discretionary transaction. ④ Users can not reallocate and recycle the information provided by The Algorithm Company Analysis Consulting firm let alone the information provided by its Site. ⑤ Be sure to know about application period of this algorithm analysis report in order to improve its accuracy. Tel : 070 - 4667 - 5009 Email : tacac@tacac.co.kr Homepage : tacac.co.kr Blog : tacac.blog.me SERVICES M&A, IPO, RECOVER, CORPORATE RESTRUCTURING, MANAGEMENT OF TECHNOLOGY, BUSINESS STRATEGY, FAMILY BUSINESS Request : http://tacac.co.kr/?page_id=1374 ① Consulting is o The Algorithm accuracy or com change over tim results of the d Consulting bec ② information pr investment dec up ③ do anything th transaction. ④ The Algorithm information pr ⑤ analysis report