shinil 002700 Algorithm Investment Report
•
1 like•90 views

shinil 002700 Algorithm Investment Report
![[Price for scheduled purchasing]
Arbitrarily made
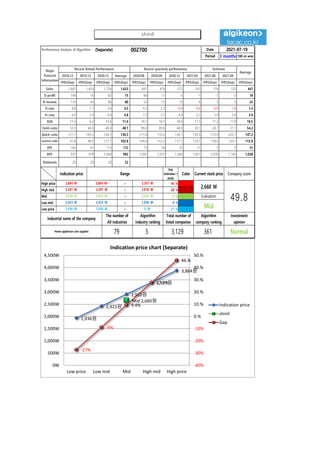
Algorithm stocks Trading Strategies (Separate) 002700 Date
Period
Gap
(Indication /
stock)
Color
2021-07-19
3 months
Current stock price Evaluation
Stock price rise
probability score
Investment opinion Prospective purchase amount
2,660 W Mid 35.7 Normal 4,000,000 W
Suggested Purchase
Amount 1,611,722 W
Number of stocks
purchased 606
Indication price Range Buying / Selling Buying / Selling [Stocks]
High price 3,884 W 3,884 W~ ~ 3,397 W 46 % -741,395 W -191
High mid 3,397 W 3,397 W ~ 2,910 W 28 % -446,392 W -131
Mid 2,910 W 2,910 W ~ 2,423 W 9 % -151,389 W -52
Low mid 2,423 W 2,423 W ~ 1,936 W -9 % 143,613 W 59
low price 1,936 W 1,936 W ~ 0 W -27 % 438,616 W 227
2021.02.23 2021.03.24 2021.04.21 2021.05.21 2021.06.18 2021.07.16
35.0 42.9 32.0
Stock price rise
probability score
A Sector 50.0 48.1 51.8 47.6 49.6 41.5
35.7
B Sector 32.1 49.2 47.6 47.6 36.3 22.5
Total average 41.0 48.6 33.8
18 % -34 %
2021.03.24 2021.04.21 2021.05.21 2021.06.18 2021.07.16
Total of
increase rate
Total score
A Sector -4 % 7 % -9 % 4 % -19 %
-8 % 41.0
B Sector 35 % -211 % 67 % -31 % -61 %
Total average 16 % -44 % 3 %
-4% 7%
-9% 4%
-19%
35%
-211%
67%
-31%
-61%
16%
-44%
3%
18%
-34%
-250%
-200%
-150%
-100%
-50%
0%
50%
100%
2021.03.24 2021.04.21 2021.05.21 2021.06.18 2021.07.16
Increase rate of stock price rise
A sector
B sector
Total average
shinil
50 48
52
48 50
41
32
49
16
48
36
23
41
49
34 35
43
32
0
10
20
30
40
50
60
2021.02.23 2021.03.24 2021.04.21 2021.05.21 2021.06.18 2021.07.16
Stock price rise probability score
A sector
B sector
Total average](data:image/gif;base64,R0lGODlhAQABAIAAAAAAAP///yH5BAEAAAAALAAAAAABAAEAAAIBRAA7)
Recommended
Recommended
More Related Content
What's hot
What's hot (20)
Similar to shinil 002700 Algorithm Investment Report
Similar to shinil 002700 Algorithm Investment Report (20)
More from 알고리즘 기업분석 컨설팅-알기컨,algikeon
More from 알고리즘 기업분석 컨설팅-알기컨,algikeon (20)
Recently uploaded
Recently uploaded (20)
shinil 002700 Algorithm Investment Report
- 1. Performance Analysis of Algorithm (Separate) 002700 Date Period 3 months 100-m won 2018.12 2019.12 2020.12 Average 2020.06 2020.09 2020.12 2021.03 2021.06 2021.09 IFRS(Sep) IFRS(Sep) IFRS(Sep) IFRS(Sep) IFRS(Sep) IFRS(Sep) IFRS(Sep) IFRS(Sep) IFRS(Sep) IFRS(Sep) IFRS(Sep) Sales 1,687 1,459 1,724 1,623 697 474 372 243 174 125 447 O-profit 148 16 62 75 66 11 -3 -1 -1 -2 18 N-income 116 43 80 80 52 13 15 8 5 3 22 O-rate 8.8 1.1 3.6 4.5 9.5 2.3 -0.8 -0.4 -0.9 -1.8 1.3 N-rate 6.9 2.9 4.6 4.8 7.5 2.7 4.0 3.3 3.0 2.8 3.9 ROE 17.4 6.2 10.6 11.4 29.1 18.1 18.4 17.5 17.2 17.0 19.5 Debt-ratio 53.5 44.0 46.9 48.1 99.6 89.6 46.9 39.1 28.7 21.1 54.2 Quick-ratio 121.7 143.2 126.1 130.3 111.6 110.2 126.1 139.5 173.0 222.7 147.2 reserve-ratio 91.8 98.9 117.7 102.8 109.6 113.2 117.7 116.1 118.4 120.7 115.9 EPS 163 61 113 112 73 18 21 11 7 5 31 BPS 937 978 1,060 992 1,005 1,037 1,060 1,051 1,078 1,105 1,038 Dividends 25 20 20 22 2021-07-19 Major Financial Information Recent Annual Performance Recent quarterly performance Estimate Average Gap (Indication / stock) Color High price ~ 46 % High mid ~ 28 % Mid ~ 9 % Low mid ~ -9 % Low price ~ -27 % Indication price Range Current stock price Company score 3,397 W 3,397 W 2,910 W 2,910 W 2,910 W 2,423 W Evaluation 3,884 W 3,884 W~ 3,397 W 2,660 W 49.8 2,423 W 2,423 W 1,936 W Mid Normal 1,936 W 1,936 W 0 W Industrial name of the company The number of All industries Algorithm Industry ranking Total number of listed companies Algorithm company ranking Investment opinion Home appliances and supplies 79 5 3,129 361 1,936원 2,423원 2,910원 3,397원 3,884원 Mid 2,660원 -27% -9% 9.4% 27.7% 46.% -40% -30% -20% -10% 0.% 10.% 20.% 30.% 40.% 50.% 0W 500W 1,000W 1,500W 2,000W 2,500W 3,000W 3,500W 4,000W 4,500W Low price Low mid Mid High mid High price Indication price chart (Separate) Indication price shinil Gap shinil
- 2. [Price for scheduled purchasing] Arbitrarily made Algorithm stocks Trading Strategies (Separate) 002700 Date Period Gap (Indication / stock) Color 2021-07-19 3 months Current stock price Evaluation Stock price rise probability score Investment opinion Prospective purchase amount 2,660 W Mid 35.7 Normal 4,000,000 W Suggested Purchase Amount 1,611,722 W Number of stocks purchased 606 Indication price Range Buying / Selling Buying / Selling [Stocks] High price 3,884 W 3,884 W~ ~ 3,397 W 46 % -741,395 W -191 High mid 3,397 W 3,397 W ~ 2,910 W 28 % -446,392 W -131 Mid 2,910 W 2,910 W ~ 2,423 W 9 % -151,389 W -52 Low mid 2,423 W 2,423 W ~ 1,936 W -9 % 143,613 W 59 low price 1,936 W 1,936 W ~ 0 W -27 % 438,616 W 227 2021.02.23 2021.03.24 2021.04.21 2021.05.21 2021.06.18 2021.07.16 35.0 42.9 32.0 Stock price rise probability score A Sector 50.0 48.1 51.8 47.6 49.6 41.5 35.7 B Sector 32.1 49.2 47.6 47.6 36.3 22.5 Total average 41.0 48.6 33.8 18 % -34 % 2021.03.24 2021.04.21 2021.05.21 2021.06.18 2021.07.16 Total of increase rate Total score A Sector -4 % 7 % -9 % 4 % -19 % -8 % 41.0 B Sector 35 % -211 % 67 % -31 % -61 % Total average 16 % -44 % 3 % -4% 7% -9% 4% -19% 35% -211% 67% -31% -61% 16% -44% 3% 18% -34% -250% -200% -150% -100% -50% 0% 50% 100% 2021.03.24 2021.04.21 2021.05.21 2021.06.18 2021.07.16 Increase rate of stock price rise A sector B sector Total average shinil 50 48 52 48 50 41 32 49 16 48 36 23 41 49 34 35 43 32 0 10 20 30 40 50 60 2021.02.23 2021.03.24 2021.04.21 2021.05.21 2021.06.18 2021.07.16 Stock price rise probability score A sector B sector Total average
- 3. may ded by Compliance notice ① The information provided by The Algorithm Company Analysis Consulting is obtained through reliable data and information and The Algorithm Company Analysis Program (TACAP), but its accuracy or completeness are not guaranteed. Furthermore, it may change over time.Therefore, we are not legally responsible for the results of the data provided by The Algorithm Company Analysis Consulting because of information errors or omissions. ② The Algorithm Company Analysis Consulting and all the information provided on it site are reference materials for investment decisions and the final responsibility of investment is up to users utilizing this information. ③ The Algorithm Company Analysis Consulting and its site do not do anything that violates the related laws such as discretionary transaction. ④ Users can not reallocate and recycle the information provided by The Algorithm Company Analysis Consulting firm let alone the information provided by its Site. ⑤ Be sure to know about application period of this algorithm analysis report in order to improve its accuracy. Tel : 070 - 4667 - 5009 Email : tacac@tacac.co.kr Homepage : tacac.co.kr Blog : tacac.blog.me SERVICES M&A, IPO, RECOVER, CORPORATE RESTRUCTURING, MANAGEMENT OF TECHNOLOGY, BUSINESS STRATEGY, FAMILY BUSINESS Request : http://tacac.co.kr/?page_id=1374