posco international 047050 Algorithm Investment Report
•
0 likes•615 views

posco international 047050 Algorithm Investment Report
![[Price for scheduled purchasing]
Arbitrarily made
Algorithm stocks Trading Strategies (consolidated) 047050 Date
Period
Gap
(Indication /
stock)
Color
low price 24,831 W 24,831 W ~ 0 W 15 % -756,786 W -30
Low mid 30,554 W 30,554 W ~ 24,831 W 41 % -2,118,224 W -69
Mid 36,276 W 36,276 W ~ 30,554 W 68 % -3,479,663 W -96
High mid 41,999 W 41,999 W ~ 36,276 W 94 % -4,841,101 W -115
Suggested Purchase
Amount 5,150,610 W
Number of stocks
purchased 238
Indication price Range Buying / Selling Buying / Selling [Stocks]
High price 47,722 W 47,722 W~ ~ 41,999 W 120 % -6,202,539 W All selling
2022-03-30
3 months
Current stock price Evaluation
Stock price rise
probability score
Investment opinion Prospective purchase amount
21,650 W Low price 56.9 Normal 10,000,000 W
48.3 52.3 48.5 55.0 42.0 40.5
2021.11.01 2021.11.29 2021.12.27 2022.01.25 2022.02.25 2022.03.29
Stock price rise
probability score
A Sector 44.6 46.8 50.0 45.5 43.5 45.6
56.9
B Sector 52.1 57.9 47.1 45.5 40.4 35.4
Total average
2021.12.27 2022.01.25 2022.02.25 2022.03.29
Total of
increase rate
Total score
A Sector 5 % 6 % -10 % -5 % 5 %
-5 % 43.7
B Sector 10 % -23 % -3 % -13 % -14 %
Total average 8 % -8 % 12 % -31 % -4 %
2021.11.29
45 47
50
46 44 46
52
58
47 46
40
35
48
52
49
55
42 41
0
10
20
30
40
50
60
70
2021.11.01 2021.11.29 2021.12.27 2022.01.25 2022.02.25 2022.03.29
Stock price rise probability score
A sector
B sector
Total average
5% 6%
-10%
-5%
5%
10%
-23%
-3%
-13% -14%
8%
-8%
12%
-31%
-4%
-40%
-30%
-20%
-10%
0%
10%
20%
2021.11.29 2021.12.27 2022.01.25 2022.02.25 2022.03.29
Increase rate of stock price rise
A sector
B sector
Total average
posco international](data:image/gif;base64,R0lGODlhAQABAIAAAAAAAP///yH5BAEAAAAALAAAAAABAAEAAAIBRAA7)
Recommended
Recommended
More Related Content
What's hot
What's hot (20)
Similar to posco international 047050 Algorithm Investment Report
Similar to posco international 047050 Algorithm Investment Report (20)
More from 알고리즘 기업분석 컨설팅-알기컨,algikeon
More from 알고리즘 기업분석 컨설팅-알기컨,algikeon (20)
Recently uploaded
Recently uploaded (20)
posco international 047050 Algorithm Investment Report
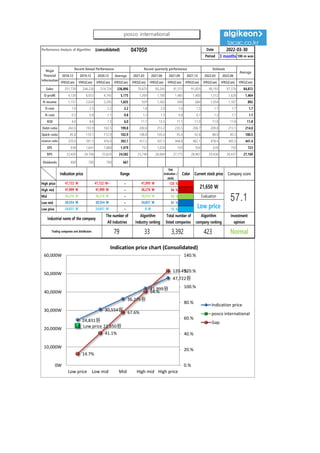
- 1. Performance Analysis of Algorithm (consolidated) 047050 Date Period 3 months 100-m won 2018.12 2019.12 2020.12 Average 2021.03 2021.06 2021.09 2021.12 2022.03 2022.06 IFRS(Con) IFRS(Con) IFRS(Con) IFRS(Con) IFRS(Con) IFRS(Con) IFRS(Con) IFRS(Con) IFRS(Con) IFRS(Con) IFRS(Con) Sales 251,739 244,226 214,724 236,896 70,870 85,245 91,515 91,859 90,193 97,376 84,872 O-profit 4,726 6,053 4,745 5,175 1,269 1,700 1,485 1,400 1,512 1,628 1,464 N-income 1,157 2,024 2,295 1,825 929 1,263 690 684 1,054 1,107 892 O-rate 1.9 2.5 2.2 2.2 1.8 2.0 1.6 1.5 1.7 1.7 1.7 N-rate 0.5 0.8 1.1 0.8 1.3 1.5 0.8 0.7 1.2 1.1 1.1 ROE 4.0 6.6 7.3 6.0 11.7 13.5 11.1 11.0 11.8 11.8 11.8 Debt-ratio 242.0 193.9 163.5 199.8 200.8 213.2 235.5 206.7 209.8 213.1 214.0 Quick-ratio 85.8 110.1 112.9 102.9 108.8 105.0 95.4 92.6 88.9 85.5 100.5 reserve-ratio 370.6 391.5 416.0 392.7 417.2 437.5 448.8 462.1 478.4 495.5 441.4 EPS 938 1,641 1,860 1,479 753 1,024 559 554 676 750 723 BPS 23,420 24,706 25,620 24,582 25,749 26,684 27,775 28,467 29,436 30,437 27,169 Dividends 600 700 700 667 Major Financial Information Recent Annual Performance Recent quarterly performance Estimate Average 2022-03-30 Gap (Indication / stock) Color High price ~ 120 % High mid ~ 94 % Mid ~ 68 % Low mid ~ 41 % Low price ~ 15 % Normal 24,831 W 24,831 W 0 W Industrial name of the company The number of All industries Algorithm Industry ranking Total number of listed companies Algorithm company ranking Investment opinion Trading companies and distributors 79 33 3,392 423 41,999 W 41,999 W 36,276 W 36,276 W 36,276 W 30,554 W Evaluation 47,722 W 47,722 W~ 41,999 W 21,650 W 57.1 30,554 W 30,554 W 24,831 W Low price Indication price Range Current stock price Company score 24,831원 30,554원 36,276원 41,999원 47,722원 Low price 21,650원 14.7% 41.1% 67.6% 94.% 120.4% 0.% 20.% 40.% 60.% 80.% 100.% 120.% 140.% 0W 10,000W 20,000W 30,000W 40,000W 50,000W 60,000W Low price Low mid Mid High mid High price Indication price chart (Consolidated) Indication price posco international Gap posco international
- 2. [Price for scheduled purchasing] Arbitrarily made Algorithm stocks Trading Strategies (consolidated) 047050 Date Period Gap (Indication / stock) Color low price 24,831 W 24,831 W ~ 0 W 15 % -756,786 W -30 Low mid 30,554 W 30,554 W ~ 24,831 W 41 % -2,118,224 W -69 Mid 36,276 W 36,276 W ~ 30,554 W 68 % -3,479,663 W -96 High mid 41,999 W 41,999 W ~ 36,276 W 94 % -4,841,101 W -115 Suggested Purchase Amount 5,150,610 W Number of stocks purchased 238 Indication price Range Buying / Selling Buying / Selling [Stocks] High price 47,722 W 47,722 W~ ~ 41,999 W 120 % -6,202,539 W All selling 2022-03-30 3 months Current stock price Evaluation Stock price rise probability score Investment opinion Prospective purchase amount 21,650 W Low price 56.9 Normal 10,000,000 W 48.3 52.3 48.5 55.0 42.0 40.5 2021.11.01 2021.11.29 2021.12.27 2022.01.25 2022.02.25 2022.03.29 Stock price rise probability score A Sector 44.6 46.8 50.0 45.5 43.5 45.6 56.9 B Sector 52.1 57.9 47.1 45.5 40.4 35.4 Total average 2021.12.27 2022.01.25 2022.02.25 2022.03.29 Total of increase rate Total score A Sector 5 % 6 % -10 % -5 % 5 % -5 % 43.7 B Sector 10 % -23 % -3 % -13 % -14 % Total average 8 % -8 % 12 % -31 % -4 % 2021.11.29 45 47 50 46 44 46 52 58 47 46 40 35 48 52 49 55 42 41 0 10 20 30 40 50 60 70 2021.11.01 2021.11.29 2021.12.27 2022.01.25 2022.02.25 2022.03.29 Stock price rise probability score A sector B sector Total average 5% 6% -10% -5% 5% 10% -23% -3% -13% -14% 8% -8% 12% -31% -4% -40% -30% -20% -10% 0% 10% 20% 2021.11.29 2021.12.27 2022.01.25 2022.02.25 2022.03.29 Increase rate of stock price rise A sector B sector Total average posco international
- 3. 정보와 완전 정보 결 투자판단 있습니 위배 무단으 숙지하 Compliance notice ① The information provided by The Algorithm Company Analysis Consulting is obtained through reliable data and information and The Algorithm Company Analysis Program (TACAP), but its accuracy or completeness are not guaranteed. Furthermore, it may change over time.Therefore, we are not legally responsible for the results of the data provided by The Algorithm Company Analysis Consulting because of information errors or omissions. ② The Algorithm Company Analysis Consulting and all the information provided on it site are reference materials for investment decisions and the final responsibility of investment is up to users utilizing this information. ③ The Algorithm Company Analysis Consulting and its site do not do anything that violates the related laws such as discretionary transaction. ④ Users can not reallocate and recycle the information provided by The Algorithm Company Analysis Consulting firm let alone the information provided by its Site. ⑤ Be sure to know about application period of this algorithm analysis report in order to improve its accuracy. Tel : 070 - 4667 - 5009 Email : tacac@tacac.co.kr Homepage : tacac.co.kr Blog : tacac.blog.me SERVICES M&A, IPO, RECOVER, CORPORATE RESTRUCTURING, MANAGEMENT OF TECHNOLOGY, BUSINESS STRATEGY, FAMILY BUSINESS Request : http://tacac.co.kr/?page_id=1374 ① Consulting is o The Algorithm accuracy or com change over tim results of the d Consulting bec ② information pr investment dec up ③ do anything th transaction. ④ The Algorithm information pr ⑤ analysis report