Download to read offline
![[Price for scheduled purchasing]
Arbitrarily made
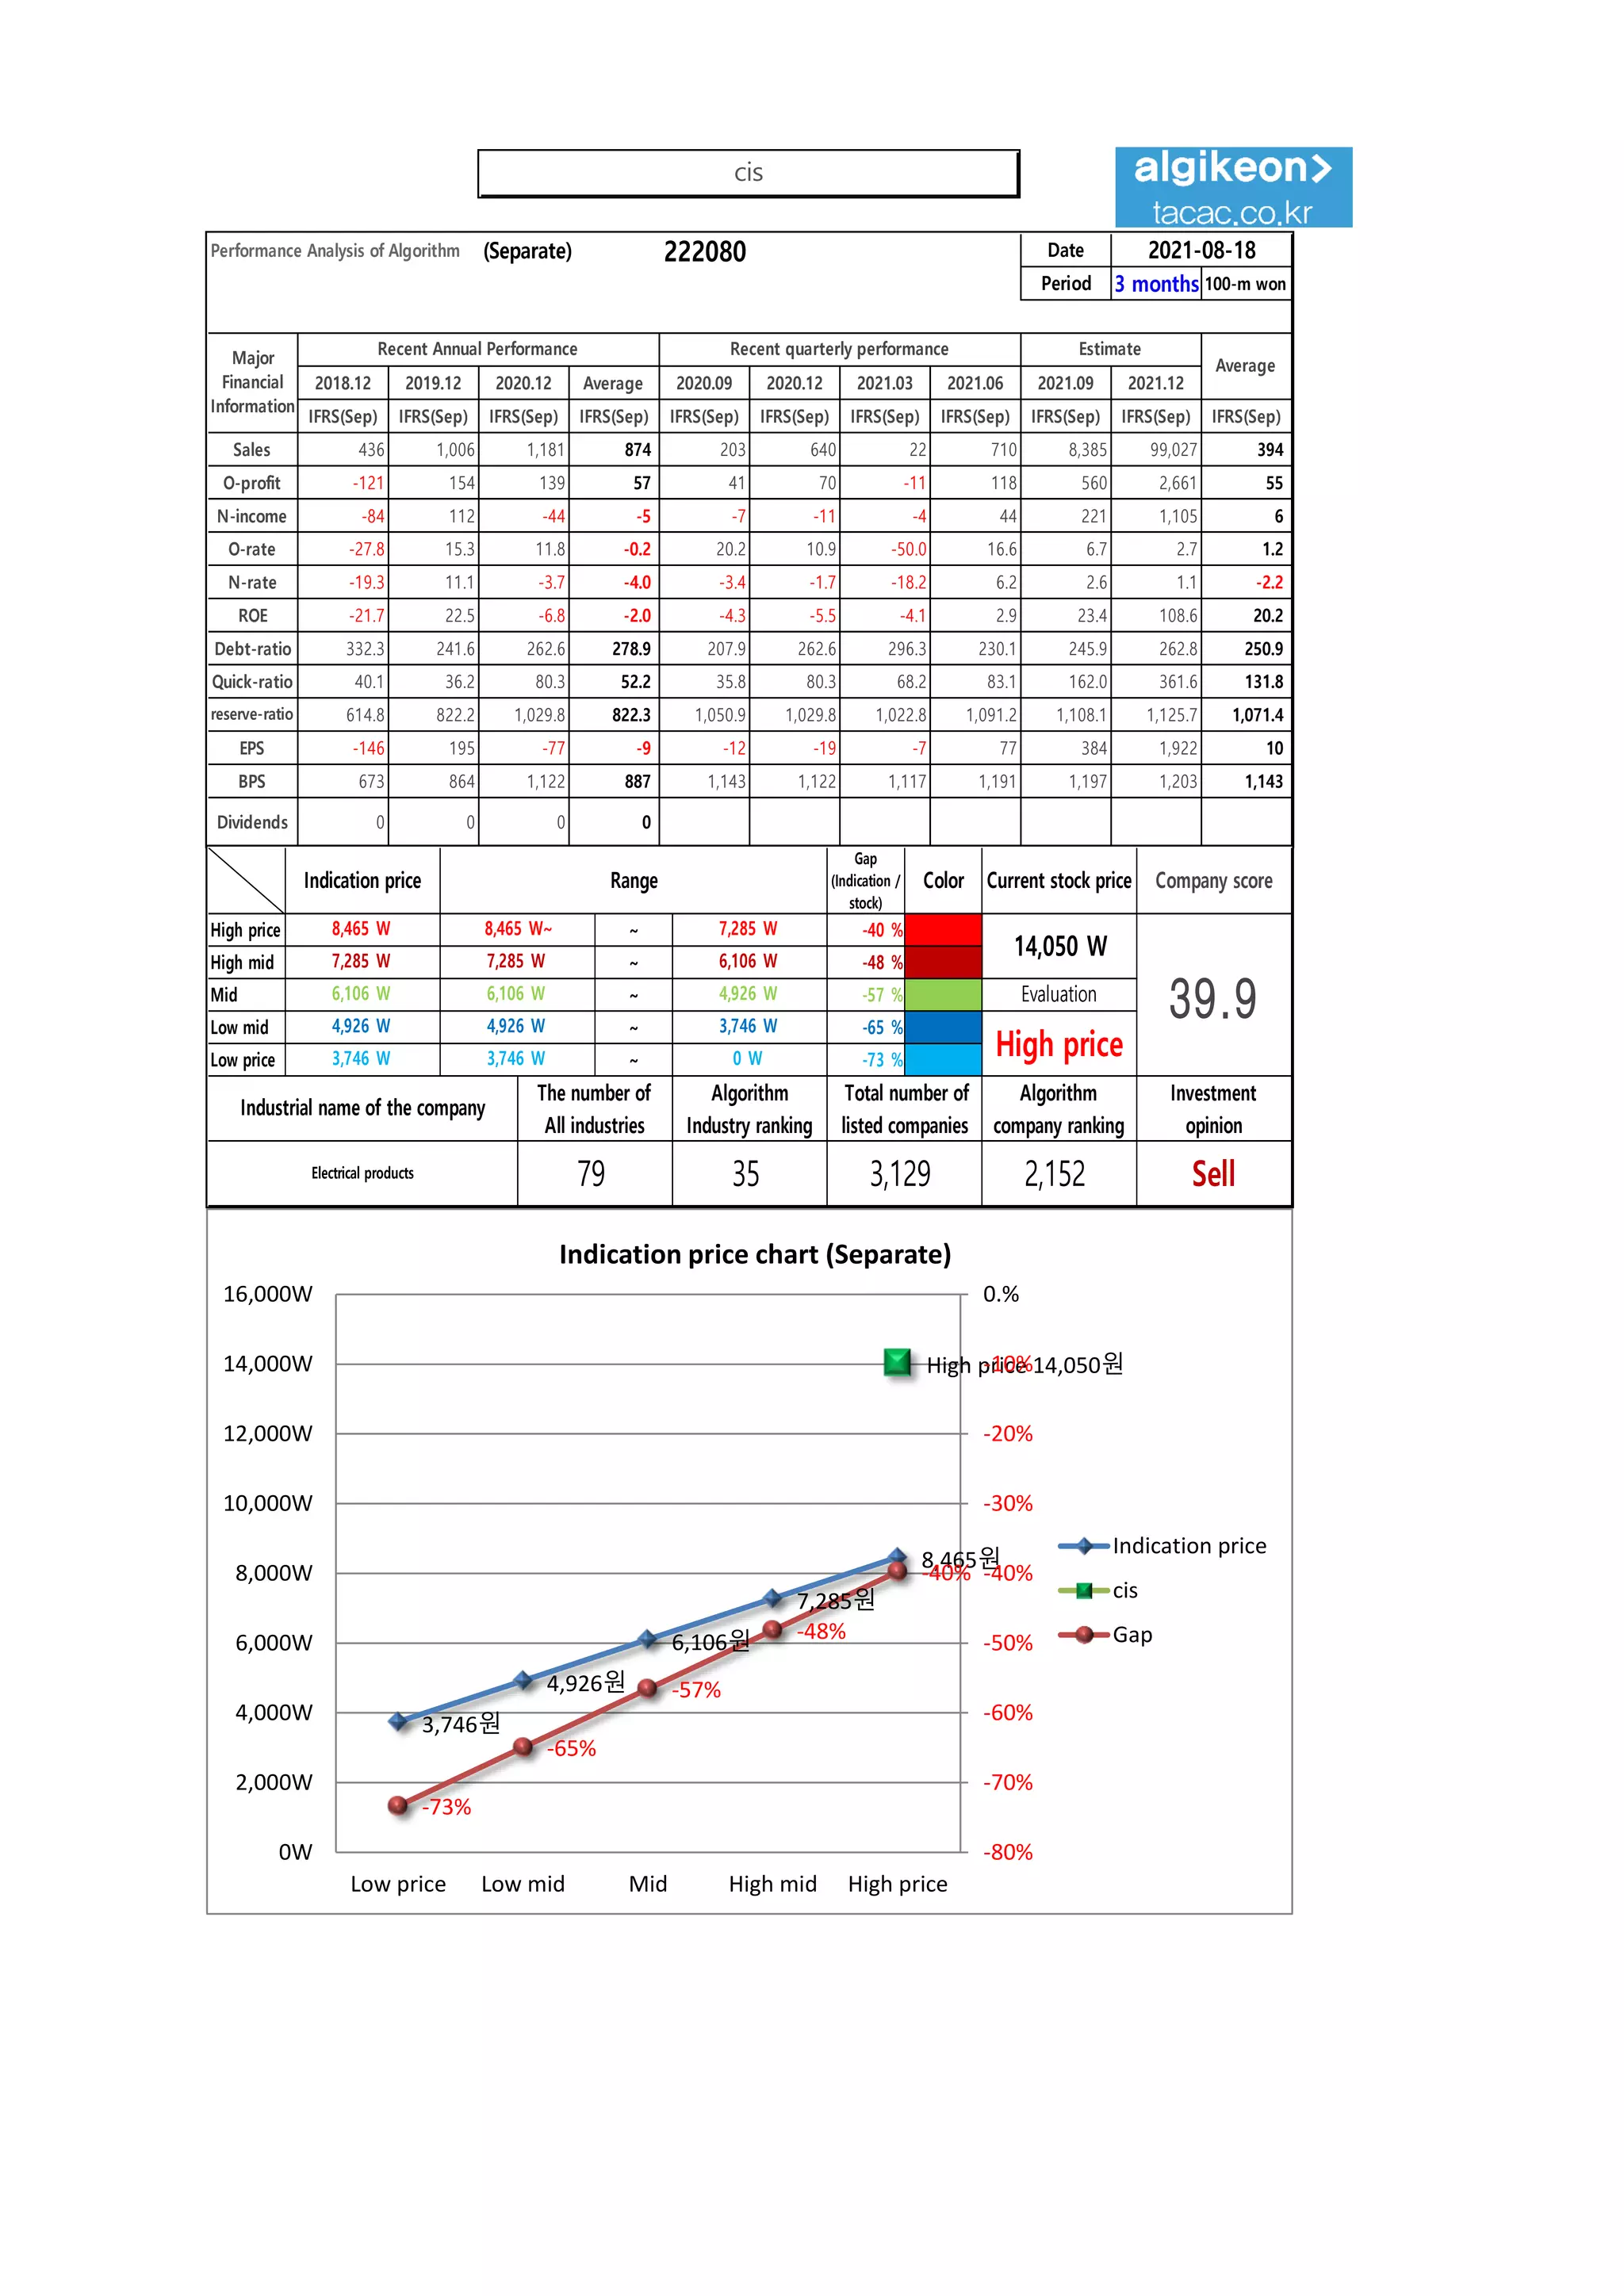
Algorithm stocks Trading Strategies (Separate) 222080 Date
Period
Gap
(Indication /
stock)
Color
low price 3,746 W 3,746 W ~ 0 W -73 % 120,936 W 32
Low mid 4,926 W 4,926 W ~ 3,746 W -65 % 107,089 W 22
Mid 6,106 W 6,106 W ~ 4,926 W -57 % 93,243 W 15
High mid 7,285 W 7,285 W ~ 6,106 W -48 % 79,396 W 11
Suggested Purchase
Amount 164,906 W
Number of stocks
purchased 12
Indication price Range Buying / Selling Buying / Selling [Stocks]
High price 8,465 W 8,465 W~ ~ 7,285 W -40 % 65,549 W 8
2021-08-18
3 months
Current stock price Evaluation
Stock price rise
probability score
Investment opinion Prospective purchase amount
14,050 W High price 17.7 Sell 2,000,000 W
Stock price rise
probability score
A Sector 50.1 44.1 43.4 47.7 50.7 54.0
17.7
B Sector 40.4 29.2 47.7 47.7 40.8 14.6
Total average 45.3 36.6 31.5 30.4 45.8 34.3
2021.03.25 2021.04.22 2021.05.24 2021.06.21 2021.07.19 2021.08.17
2021.05.24 2021.06.21 2021.07.19 2021.08.17
Total of
increase rate
Total score
A Sector -14 % -2 % 9 % 6 % 6 %
-9 % 39.0
B Sector -39 % -49 % 59 % -17 % -180 %
Total average -23 % -16 % -4 % 34 % -33 %
2021.04.22
-14%
-2% 9% 6% 6%
-39% -49%
59%
-17%
-180%
-23% -16%
-4%
34%
-33%
-200%
-150%
-100%
-50%
0%
50%
100%
2021.04.22 2021.05.24 2021.06.21 2021.07.19 2021.08.17
Increase rate of stock price rise
A sector
B sector
Total average
cis
50
44 43
48
51
54
40
29
20
48
41
15
45
37
32 30
46
34
0
10
20
30
40
50
60
2021.03.25 2021.04.22 2021.05.24 2021.06.21 2021.07.19 2021.08.17
Stock price rise probability score
A sector
B sector
Total average](https://image.slidesharecdn.com/cis222080algorithminvestmentreport-210818011424/75/cis-222080-Algorithm-Investment-Report-2-2048.jpg)

This document provides a summary of a company's financial performance and stock price information over several periods of time. It includes data on sales, profits, debt ratios, and stock prices on a quarterly and annual basis. It also analyzes the company's stock price against indication price ranges and provides a probability score for price increases. The analysis suggests the stock as a "sell" and provides prospective purchase amounts at different price levels.


![[쿠콘]coocon 294570 Algorithm Investment Report](https://cdn.slidesharecdn.com/ss_thumbnails/coocon294570algorithminvestmentreport-250926162409-bd6c1593-thumbnail.jpg?width=640&height=640&fit=bounds)


![[롯데웰푸드]lottewell food 280360 Algorithm Investment Report](https://cdn.slidesharecdn.com/ss_thumbnails/lottewellfood280360algorithminvestmentreport-251010014427-e0439c3a-thumbnail.jpg?width=640&height=640&fit=bounds)
![[대상]Daesang 001680 Algorithm Investment Report](https://cdn.slidesharecdn.com/ss_thumbnails/daesang001680algorithminvestmentreport-250915063303-81c41298-thumbnail.jpg?width=640&height=640&fit=bounds)

![[동서]dongsuh 026960 Algorithm Investment Report](https://cdn.slidesharecdn.com/ss_thumbnails/dongsuh026960algorithminvestmentreport-250226011658-61b0afaa-thumbnail.jpg?width=640&height=640&fit=bounds)

![[SFA반도체]SFA semicon 036540 Algorithm Investment Report](https://cdn.slidesharecdn.com/ss_thumbnails/sfasemicon036540algorithminvestmentreport-250219022804-aa8f2510-thumbnail.jpg?width=640&height=640&fit=bounds)
![[더즌]dozn 462860 Algorithm Investment Report](https://cdn.slidesharecdn.com/ss_thumbnails/dozn462860algorithminvestmentreport-250920161038-b31c0a65-thumbnail.jpg?width=640&height=640&fit=bounds)
![[동원산업]dongwon industries 006040 Algorithm Investment Report](https://cdn.slidesharecdn.com/ss_thumbnails/dongwonindustries006040algorithminvestmentreport-251003020532-5dd00f8a-thumbnail.jpg?width=640&height=640&fit=bounds)

![[헥토파이낸셜]hectofinancial 234340 Algorithm Investment Report](https://cdn.slidesharecdn.com/ss_thumbnails/hectofinancial234340algorithminvestmentreport-250917010057-0603ecf0-thumbnail.jpg?width=640&height=640&fit=bounds)
![[동서]dongsuh 026960 Algorithm Investment Report](https://cdn.slidesharecdn.com/ss_thumbnails/dongsuh026960algorithminvestmentreport-251001020056-e986a251-thumbnail.jpg?width=640&height=640&fit=bounds)
![[휴림로봇]hyulimrobot 090710 Algorithm Investment Report](https://cdn.slidesharecdn.com/ss_thumbnails/hyulimrobot090710algorithminvestmentreport-250923234005-7edfe548-thumbnail.jpg?width=640&height=640&fit=bounds)
![[웹케시]webcash 053580 Algorithm Investment Report](https://cdn.slidesharecdn.com/ss_thumbnails/webcash053580algorithminvestmentreport-250925003052-f31dd73c-thumbnail.jpg?width=640&height=640&fit=bounds)


![[한국공항]Korea Airport Service 005430 Algorithm Investment Report](https://cdn.slidesharecdn.com/ss_thumbnails/koreaairportservice005430algorithminvestmentreport-250915064019-e6873549-thumbnail.jpg?width=640&height=640&fit=bounds)
![[삼성중공업] Samsung Heavy Industries 010140 Algorithm Investment Report](https://cdn.slidesharecdn.com/ss_thumbnails/samsungheavyindustries010140algorithminvestmentreport-250904015122-fe022f35-thumbnail.jpg?width=640&height=640&fit=bounds)
![[삼성전자]samsung electronics 005930 Algorithm Investment Report](https://cdn.slidesharecdn.com/ss_thumbnails/samsungelectronics005930algorithminvestmentreport-250227014600-4fa86dc7-thumbnail.jpg?width=640&height=640&fit=bounds)
![동원fnb 049770 알고리즘 기업분석 보고서 [알고리즘 기업분석 컨설팅-알기컨]](https://cdn.slidesharecdn.com/ss_thumbnails/fnb049770-250224032312-db728faf-thumbnail.jpg?width=640&height=640&fit=bounds)
![대상 001680 알고리즘 기업분석 보고서 [알고리즘 기업분석 컨설팅-알기컨]](https://cdn.slidesharecdn.com/ss_thumbnails/001680-250303132112-443c504a-thumbnail.jpg?width=640&height=640&fit=bounds)