sk gas 018670 Algorithm Investment Report
•
1 like•232 views

sk gas 018670 Algorithm Investment Report
![[Price for scheduled purchasing]
Arbitrarily made
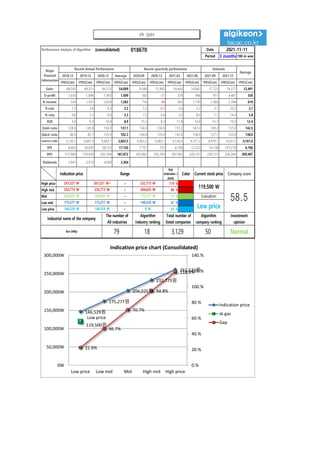
Algorithm stocks Trading Strategies (consolidated) 018670 Date
Period
Gap
(Indication /
stock)
Color
low price 146,529 W 146,529 W ~ 0 W 23 % -1,214,192 W -8
Low mid 175,277 W 175,277 W ~ 146,529 W 47 % -2,505,576 W -14
Mid 204,025 W 204,025 W ~ 175,277 W 71 % -3,796,960 W -19
High mid 232,773 W 232,773 W ~ 204,025 W 95 % -5,088,344 W -22
Suggested Purchase
Amount 5,368,061 W
Number of stocks
purchased 45
Indication price Range Buying / Selling Buying / Selling [Stocks]
High price 261,521 W 261,521 W~ ~ 232,773 W 119 % -6,379,728 W All selling
2021-11-11
3 months
Current stock price Evaluation
Stock price rise
probability score
Investment opinion Prospective purchase amount
119,500 W Low price 59.4 Normal 10,000,000 W
48.2 35.7 37.9 56.7 41.0 40.8
2021.06.15 2021.07.13 2021.08.10 2021.09.08 2021.10.13 2021.11.10
Stock price rise
probability score
A Sector 44.4 42.2 47.5 48.2 44.8 46.2
59.4
B Sector 52.1 29.2 28.3 48.2 37.1 35.4
Total average
2021.08.10 2021.09.08 2021.10.13 2021.11.10
Total of
increase rate
Total score
A Sector -5 % 11 % 1 % -8 % 3 %
-7 % 43.0
B Sector -79 % -3 % 41 % -30 % -5 %
Total average -35 % 6 % 33 % -38 % -0 %
2021.07.13
44 42
48 48
45 46
52
29 28
48
37 35
48
36 38
57
41 41
0
10
20
30
40
50
60
2021.06.15 2021.07.13 2021.08.10 2021.09.08 2021.10.13 2021.11.10
Stock price rise probability score
A sector
B sector
Total average
-5%
11%
1%
-8%
3%
-79%
-3%
41%
-30%
-5%
-35%
6%
33%
-38%
-0%
-100%
-80%
-60%
-40%
-20%
0%
20%
40%
60%
2021.07.13 2021.08.10 2021.09.08 2021.10.13 2021.11.10
Increase rate of stock price rise
A sector
B sector
Total average
sk gas](data:image/gif;base64,R0lGODlhAQABAIAAAAAAAP///yH5BAEAAAAALAAAAAABAAEAAAIBRAA7)
Recommended
Recommended
More Related Content
What's hot
What's hot (20)
Similar to sk gas 018670 Algorithm Investment Report
Similar to sk gas 018670 Algorithm Investment Report (20)
More from 알고리즘 기업분석 컨설팅-알기컨,algikeon
More from 알고리즘 기업분석 컨설팅-알기컨,algikeon (20)
Recently uploaded
Recently uploaded (20)
sk gas 018670 Algorithm Investment Report
- 1. Performance Analysis of Algorithm (consolidated) 018670 Date Period 3 months 100-m won 2018.12 2019.12 2020.12 Average 2020.09 2020.12 2021.03 2021.06 2021.09 2021.12 IFRS(Con) IFRS(Con) IFRS(Con) IFRS(Con) IFRS(Con) IFRS(Con) IFRS(Con) IFRS(Con) IFRS(Con) IFRS(Con) IFRS(Con) Sales 68,592 49,311 44,123 54,009 9,566 11,892 14,442 14,062 17,723 19,277 12,491 O-profit 1,030 1,896 1,902 1,609 502 -21 376 446 911 4,467 326 N-income 554 1,541 2,654 1,583 716 68 563 1,129 1,360 2,784 619 O-rate 1.5 3.8 4.3 3.2 5.2 -0.2 2.6 3.2 5.1 23.2 2.7 N-rate 0.8 3.1 6.0 3.3 7.5 0.6 3.9 8.0 7.7 14.4 5.0 ROE 3.4 9.3 14.0 8.9 15.2 8.3 11.8 14.4 15.1 19.3 12.4 Debt-ratio 128.6 145.8 136.9 137.1 134.4 136.9 151.2 147.4 149.2 151.0 142.5 Quick-ratio 86.9 85.1 135.0 102.3 144.8 135.0 143.9 128.4 127.1 125.9 138.0 reserve-ratio 3,120.1 3,607.4 4,083.1 3,603.5 4,063.2 4,083.1 4,126.4 4,371.2 4,479.7 4,591.1 4,161.0 EPS 6,002 16,695 28,753 17,150 7,757 737 6,100 12,232 14,738 147,270 6,706 BPS 177,980 179,930 205,704 187,872 203,862 205,704 207,903 220,157 228,131 236,394 209,407 Dividends 2,941 2,970 4,000 3,304 Major Financial Information Recent Annual Performance Recent quarterly performance Estimate Average 2021-11-11 Gap (Indication / stock) Color High price ~ 119 % High mid ~ 95 % Mid ~ 71 % Low mid ~ 47 % Low price ~ 23 % Normal 146,529 W 146,529 W 0 W Industrial name of the company The number of All industries Algorithm Industry ranking Total number of listed companies Algorithm company ranking Investment opinion Gas Utility 79 18 3,129 50 232,773 W 232,773 W 204,025 W 204,025 W 204,025 W 175,277 W Evaluation 261,521 W 261,521 W~ 232,773 W 119,500 W 58.5 175,277 W 175,277 W 146,529 W Low price Indication price Range Current stock price Company score 146,529원 175,277원 204,025원 232,773원 261,521원 Low price 119,500원 22.6% 46.7% 70.7% 94.8% 118.8% 0.% 20.% 40.% 60.% 80.% 100.% 120.% 140.% 0W 50,000W 100,000W 150,000W 200,000W 250,000W 300,000W Low price Low mid Mid High mid High price Indication price chart (Consolidated) Indication price sk gas Gap sk gas
- 2. [Price for scheduled purchasing] Arbitrarily made Algorithm stocks Trading Strategies (consolidated) 018670 Date Period Gap (Indication / stock) Color low price 146,529 W 146,529 W ~ 0 W 23 % -1,214,192 W -8 Low mid 175,277 W 175,277 W ~ 146,529 W 47 % -2,505,576 W -14 Mid 204,025 W 204,025 W ~ 175,277 W 71 % -3,796,960 W -19 High mid 232,773 W 232,773 W ~ 204,025 W 95 % -5,088,344 W -22 Suggested Purchase Amount 5,368,061 W Number of stocks purchased 45 Indication price Range Buying / Selling Buying / Selling [Stocks] High price 261,521 W 261,521 W~ ~ 232,773 W 119 % -6,379,728 W All selling 2021-11-11 3 months Current stock price Evaluation Stock price rise probability score Investment opinion Prospective purchase amount 119,500 W Low price 59.4 Normal 10,000,000 W 48.2 35.7 37.9 56.7 41.0 40.8 2021.06.15 2021.07.13 2021.08.10 2021.09.08 2021.10.13 2021.11.10 Stock price rise probability score A Sector 44.4 42.2 47.5 48.2 44.8 46.2 59.4 B Sector 52.1 29.2 28.3 48.2 37.1 35.4 Total average 2021.08.10 2021.09.08 2021.10.13 2021.11.10 Total of increase rate Total score A Sector -5 % 11 % 1 % -8 % 3 % -7 % 43.0 B Sector -79 % -3 % 41 % -30 % -5 % Total average -35 % 6 % 33 % -38 % -0 % 2021.07.13 44 42 48 48 45 46 52 29 28 48 37 35 48 36 38 57 41 41 0 10 20 30 40 50 60 2021.06.15 2021.07.13 2021.08.10 2021.09.08 2021.10.13 2021.11.10 Stock price rise probability score A sector B sector Total average -5% 11% 1% -8% 3% -79% -3% 41% -30% -5% -35% 6% 33% -38% -0% -100% -80% -60% -40% -20% 0% 20% 40% 60% 2021.07.13 2021.08.10 2021.09.08 2021.10.13 2021.11.10 Increase rate of stock price rise A sector B sector Total average sk gas
- 3. 정보와 완전 정보 결 투자판단 있습니 위배 무단으 숙지하 Compliance notice ① The information provided by The Algorithm Company Analysis Consulting is obtained through reliable data and information and The Algorithm Company Analysis Program (TACAP), but its accuracy or completeness are not guaranteed. Furthermore, it may change over time.Therefore, we are not legally responsible for the results of the data provided by The Algorithm Company Analysis Consulting because of information errors or omissions. ② The Algorithm Company Analysis Consulting and all the information provided on it site are reference materials for investment decisions and the final responsibility of investment is up to users utilizing this information. ③ The Algorithm Company Analysis Consulting and its site do not do anything that violates the related laws such as discretionary transaction. ④ Users can not reallocate and recycle the information provided by The Algorithm Company Analysis Consulting firm let alone the information provided by its Site. ⑤ Be sure to know about application period of this algorithm analysis report in order to improve its accuracy. Tel : 070 - 4667 - 5009 Email : tacac@tacac.co.kr Homepage : tacac.co.kr Blog : tacac.blog.me SERVICES M&A, IPO, RECOVER, CORPORATE RESTRUCTURING, MANAGEMENT OF TECHNOLOGY, BUSINESS STRATEGY, FAMILY BUSINESS Request : http://tacac.co.kr/?page_id=1374 ① Consulting is o The Algorithm accuracy or com change over tim results of the d Consulting bec ② information pr investment dec up ③ do anything th transaction. ④ The Algorithm information pr ⑤ analysis report