lotte foods 002270 Algorithm Investment Report
•
0 likes•60 views

lotte foods 002270 Algorithm Investment Report
![[Price for scheduled purchasing]
Arbitrarily made
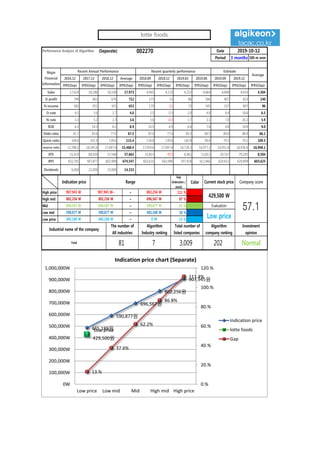
Algorithm stocks Trading Strategies (Separate) 002270 Date
Period
Gap
(Indication /
stock)
Color
low price 485,188 W 485,188 W ~ 0 W 13 % -577,995 W -1
Low mid 590,877 W 590,877 W ~ 485,188 W 38 % -1,674,967 W -3
Mid 696,567 W 696,567 W ~ 590,877 W 62 % -2,771,939 W -4
High mid 802,256 W 802,256 W ~ 696,567 W 87 % -3,868,911 W -5
Suggested Purchase
Amount 4,457,868 W
Number of stocks
purchased 10
Indication price Range Buying / Selling Buying / Selling [Stocks]
High price 907,945 W 907,945 W~ ~ 802,256 W 111 % -4,965,883 W All selling
2019-10-12
3 months
Current stock price Evaluation
Stock price rise
probability score
Investment opinion Prospective purchase amount
429,500 W Low price 53.5 Normal 8,800,000 W
Stock price rise
probability score
A Sector 47.9 47.8 42.0 47.1 48.6 43.9
53.5B Sector 21.7 50.0 47.1 47.1 14.6 38.3
Total average 34.8 48.9 39.1 35.0 31.6 41.1
2019.05.16 2019.06.14 2019.07.12 2019.08.09 2019.09.09 2019.10.11
2019.07.12 2019.08.09 2019.09.09 2019.10.11
Total of
increase rate
Total score
A Sector -0 % -14 % 11 % 3 % -11 %
1 % 48.7B Sector 57 % -38 % 23 % -223 % 62 %
Total average 29 % -25 % -12 % -11 % 23 %
2019.06.14
-0% -14%
11% 3%
-11%
57%
-38%
23%
-223%
62%
29%
-25% -12% -11%
23%
-250%
-200%
-150%
-100%
-50%
0%
50%
100%
2019.06.14 2019.07.12 2019.08.09 2019.09.09 2019.10.11
Increase rate of stock price rise
A sector
B sector
Total average
lotte foods
48 48
42
47 49
44
22
50
36
47
15
38
35
49
39
35
32
41
0
10
20
30
40
50
60
2019.05.16 2019.06.14 2019.07.12 2019.08.09 2019.09.09 2019.10.11
Stock price rise probability score
A sector
B sector
Total average](data:image/gif;base64,R0lGODlhAQABAIAAAAAAAP///yH5BAEAAAAALAAAAAABAAEAAAIBRAA7)
Recommended
Recommended
More Related Content
What's hot
What's hot (20)
Similar to lotte foods 002270 Algorithm Investment Report
Similar to lotte foods 002270 Algorithm Investment Report (20)
More from 알고리즘 기업분석 컨설팅-알기컨,algikeon
More from 알고리즘 기업분석 컨설팅-알기컨,algikeon (20)
Recently uploaded
Recently uploaded (20)
lotte foods 002270 Algorithm Investment Report
- 1. Performance Analysis of Algorithm (Separate) 002270 Date Period 3 months 100-m won 2016.12 2017.12 2018.12 Average 2018.09 2018.12 2019.03 2019.06 2019.09 2019.12 IFRS(Sep) IFRS(Sep) IFRS(Sep) IFRS(Sep) IFRS(Sep) IFRS(Sep) IFRS(Sep) IFRS(Sep) IFRS(Sep) IFRS(Sep) IFRS(Sep) Sales 17,624 18,186 18,108 17,973 4,965 4,133 4,252 4,664 4,848 4,433 4,504 O-profit 798 662 676 712 275 13 86 186 407 823 140 N-income 582 951 425 653 179 -11 72 145 337 897 96 O-rate 4.5 3.6 3.7 4.0 5.5 0.3 2.0 4.0 8.4 18.6 6.5 N-rate 3.3 5.2 2.3 3.6 3.6 -0.3 1.7 3.1 7.0 20.2 5.9 ROE 6.2 14.3 6.2 8.9 10.5 4.9 6.6 7.6 9.8 14.9 9.0 Debt-ratio 41.7 83.6 77.0 67.5 87.0 77.0 85.5 89.5 89.0 88.4 86.1 Quick-ratio 104.6 101.9 139.6 115.4 134.8 139.6 142.8 90.4 79.3 70.1 109.5 reserve-ratio 12,788.2 16,545.6 17,047.4 15,460.4 17,059.6 17,047.4 16,726.3 16,977.2 16,951.8 16,926.4 16,948.1 EPS 51,419 84,020 37,548 57,663 15,815 -972 6,361 12,811 29,767 79,295 8,504 BPS 832,781 587,877 602,984 674,547 602,631 602,984 597,418 611,466 620,611 629,894 603,625 Dividends 6,000 22,000 15,000 14,333 2019-10-12 Major Financial Information Recent Annual Performance Recent quarterly performance Estimate Average Gap (Indication / stock) Color High price ~ 111 % High mid ~ 87 % Mid ~ 62 % Low mid ~ 38 % Low price ~ 13 % Normal 485,188 W 485,188 W 0 W Industrial name of the company The number of All industries Algorithm Industry ranking Total number of listed companies Algorithm company ranking Investment opinion Food 81 7 3,009 202 802,256 W 802,256 W 696,567 W 696,567 W 696,567 W 590,877 W Evaluation 907,945 W 907,945 W~ 802,256 W 429,500 W 57.1590,877 W 590,877 W 485,188 W Low price Indication price Range Current stock price Company score 485,188원 590,877원 696,567원 802,256원 907,945원 Low price 429,500원 13.% 37.6% 62.2% 86.8% 111.4% 0.% 20.% 40.% 60.% 80.% 100.% 120.% 0W 100,000W 200,000W 300,000W 400,000W 500,000W 600,000W 700,000W 800,000W 900,000W 1,000,000W Low price Low mid Mid High mid High price Indication price chart (Separate) Indication price lotte foods Gap lotte foods
- 2. [Price for scheduled purchasing] Arbitrarily made Algorithm stocks Trading Strategies (Separate) 002270 Date Period Gap (Indication / stock) Color low price 485,188 W 485,188 W ~ 0 W 13 % -577,995 W -1 Low mid 590,877 W 590,877 W ~ 485,188 W 38 % -1,674,967 W -3 Mid 696,567 W 696,567 W ~ 590,877 W 62 % -2,771,939 W -4 High mid 802,256 W 802,256 W ~ 696,567 W 87 % -3,868,911 W -5 Suggested Purchase Amount 4,457,868 W Number of stocks purchased 10 Indication price Range Buying / Selling Buying / Selling [Stocks] High price 907,945 W 907,945 W~ ~ 802,256 W 111 % -4,965,883 W All selling 2019-10-12 3 months Current stock price Evaluation Stock price rise probability score Investment opinion Prospective purchase amount 429,500 W Low price 53.5 Normal 8,800,000 W Stock price rise probability score A Sector 47.9 47.8 42.0 47.1 48.6 43.9 53.5B Sector 21.7 50.0 47.1 47.1 14.6 38.3 Total average 34.8 48.9 39.1 35.0 31.6 41.1 2019.05.16 2019.06.14 2019.07.12 2019.08.09 2019.09.09 2019.10.11 2019.07.12 2019.08.09 2019.09.09 2019.10.11 Total of increase rate Total score A Sector -0 % -14 % 11 % 3 % -11 % 1 % 48.7B Sector 57 % -38 % 23 % -223 % 62 % Total average 29 % -25 % -12 % -11 % 23 % 2019.06.14 -0% -14% 11% 3% -11% 57% -38% 23% -223% 62% 29% -25% -12% -11% 23% -250% -200% -150% -100% -50% 0% 50% 100% 2019.06.14 2019.07.12 2019.08.09 2019.09.09 2019.10.11 Increase rate of stock price rise A sector B sector Total average lotte foods 48 48 42 47 49 44 22 50 36 47 15 38 35 49 39 35 32 41 0 10 20 30 40 50 60 2019.05.16 2019.06.14 2019.07.12 2019.08.09 2019.09.09 2019.10.11 Stock price rise probability score A sector B sector Total average
- 3. may ded by Compliance notice ① The information provided by The Algorithm Company Analysis Consulting is obtained through reliable data and information and The Algorithm Company Analysis Program (TACAP), but its accuracy or completeness are not guaranteed. Furthermore, it may change over time.Therefore, we are not legally responsible for the results of the data provided by The Algorithm Company Analysis Consulting because of information errors or omissions. ② The Algorithm Company Analysis Consulting and all the information provided on it site are reference materials for investment decisions and the final responsibility of investment is up to users utilizing this information. ③ The Algorithm Company Analysis Consulting and its site do not do anything that violates the related laws such as discretionary transaction. ④ Users can not reallocate and recycle the information provided by The Algorithm Company Analysis Consulting firm let alone the information provided by its Site. ⑤ Be sure to know about application period of this algorithm analysis report in order to improve its accuracy. Tel : 070 - 4667 - 5009 Email : tacac@tacac.co.kr Homepage : tacac.co.kr Blog : tacac.blog.me SERVICES M&A, IPO, RECOVER, CORPORATE RESTRUCTURING, MANAGEMENT OF TECHNOLOGY, BUSINESS STRATEGY, FAMILY BUSINESS Request : http://tacac.co.kr/?page_id=1374