wemade 112040 Algorithm Investment Report
•
1 like•269 views

This document provides a summary of financial and stock performance data for a company over several periods. It includes tables with metrics like sales, operating profit, net income, debt ratios, and earnings per share on a quarterly and annual basis. Additional sections analyze the company's stock price against indication prices, provide purchase strategies, and show stock price rise probabilities for different sectors over time.
![[Price for scheduled purchasing]
Arbitrarily made
Algorithm stocks Trading Strategies (consolidated) 112040 Date
Period
Gap
(Indication /
stock)
Color
low price 27,180 W 27,180 W ~ 0 W -79 % 481,167 W 18
Low mid 34,981 W 34,981 W ~ 27,180 W -73 % 445,287 W 13
Mid 42,783 W 42,783 W ~ 34,981 W -68 % 409,406 W 10
High mid 50,584 W 50,584 W ~ 42,783 W -62 % 373,526 W 7
Suggested Purchase
Amount 606,172 W
Number of stocks
purchased 5
Indication price Range Buying / Selling Buying / Selling [Stocks]
High price 58,386 W 58,386 W~ ~ 50,584 W -56 % 337,645 W 6
2021-09-06
3 months
Current stock price Evaluation
Stock price rise
probability score
Investment opinion Prospective purchase amount
131,800 W High price 28.2 Normal 2,500,000 W
38.2 38.3 34.8 32.5 42.0 42.6
2021.04.13 2021.05.12 2021.06.10 2021.07.08 2021.08.05 2021.09.03
Stock price rise
probability score
A Sector 50.5 48.2 48.0 46.4 44.5 50.6
28.2
B Sector 25.8 28.3 21.7 46.4 39.6 34.6
Total average
2021.06.10 2021.07.08 2021.08.05 2021.09.03
Total of
increase rate
Total score
A Sector -5 % -1 % -3 % -4 % 12 %
1 % 47.7
B Sector 9 % -31 % 53 % -17 % -14 %
Total average 0 % -10 % -7 % 23 % 1 %
2021.05.12
51 48 48 46 44
51
26 28
22
46
40
35
38 38
35 33
42 43
0
10
20
30
40
50
60
2021.04.13 2021.05.12 2021.06.10 2021.07.08 2021.08.05 2021.09.03
Stock price rise probability score
A sector
B sector
Total average
-5%
-1% -3% -4%
12%
9%
-31%
53%
-17% -14%
0%
-10% -7%
23%
1%
-40%
-20%
0%
20%
40%
60%
2021.05.12 2021.06.10 2021.07.08 2021.08.05 2021.09.03
Increase rate of stock price rise
A sector
B sector
Total average
wemade](data:image/gif;base64,R0lGODlhAQABAIAAAAAAAP///yH5BAEAAAAALAAAAAABAAEAAAIBRAA7)
Recommended
Recommended
More Related Content
What's hot
What's hot (20)
Similar to wemade 112040 Algorithm Investment Report
Similar to wemade 112040 Algorithm Investment Report (20)
More from 알고리즘 기업분석 컨설팅-알기컨,algikeon
More from 알고리즘 기업분석 컨설팅-알기컨,algikeon (20)
Recently uploaded
Recently uploaded (20)
wemade 112040 Algorithm Investment Report
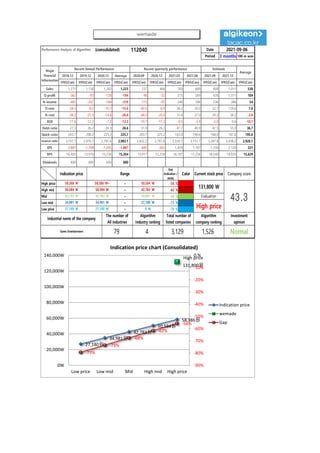
- 1. Performance Analysis of Algorithm (consolidated) 112040 Date Period 3 months 100-m won 2018.12 2019.12 2020.12 Average 2020.09 2020.12 2021.03 2021.06 2021.09 2021.12 IFRS(Con) IFRS(Con) IFRS(Con) IFRS(Con) IFRS(Con) IFRS(Con) IFRS(Con) IFRS(Con) IFRS(Con) IFRS(Con) IFRS(Con) Sales 1,271 1,136 1,262 1,223 237 466 760 689 808 1,011 538 O-profit -362 -93 -128 -194 -96 -32 275 269 426 1,311 104 N-income -485 -287 -184 -319 -115 -95 240 186 236 386 54 O-rate -28.5 -8.2 -10.1 -15.6 -40.5 -6.9 36.2 39.0 52.7 129.6 7.0 N-rate -38.2 -25.3 -14.6 -26.0 -48.5 -20.4 31.6 27.0 29.2 38.2 -2.6 ROE -17.6 -12.2 -7.2 -12.3 -19.7 -17.3 -0.5 -2.9 -2.0 0.6 -10.1 Debt-ratio 27.3 26.2 26.3 26.6 31.9 26.3 47.7 40.9 47.5 55.0 36.7 Quick-ratio 243.7 208.2 225.2 225.7 203.7 225.2 163.0 190.6 188.0 187.6 195.6 reserve-ratio 3,197.7 2,970.1 2,781.6 2,983.1 2,832.2 2,781.6 2,939.1 3,151.7 3,287.8 3,438.2 2,926.1 EPS -2,887 -1,708 -1,095 -1,897 -685 -565 1,429 1,107 1,330 2,120 321 BPS 16,405 13,970 15,238 15,204 13,917 15,238 16,107 17,256 18,540 19,920 15,629 Dividends 600 600 600 600 Major Financial Information Recent Annual Performance Recent quarterly performance Estimate Average 2021-09-06 Gap (Indication / stock) Color High price ~ -56 % High mid ~ -62 % Mid ~ -68 % Low mid ~ -73 % Low price ~ -79 % Normal 27,180 W 27,180 W 0 W Industrial name of the company The number of All industries Algorithm Industry ranking Total number of listed companies Algorithm company ranking Investment opinion Game Entertainment 79 4 3,129 1,526 50,584 W 50,584 W 42,783 W 42,783 W 42,783 W 34,981 W Evaluation 58,386 W 58,386 W~ 50,584 W 131,800 W 43.3 34,981 W 34,981 W 27,180 W High price Indication price Range Current stock price Company score 27,180원 34,981원 42,783원 50,584원 58,386원 High price 131,800원 -79% -73% -68% -62% -56% -90% -80% -70% -60% -50% -40% -30% -20% -10% 0.% 0W 20,000W 40,000W 60,000W 80,000W 100,000W 120,000W 140,000W Low price Low mid Mid High mid High price Indication price chart (Consolidated) Indication price wemade Gap wemade
- 2. [Price for scheduled purchasing] Arbitrarily made Algorithm stocks Trading Strategies (consolidated) 112040 Date Period Gap (Indication / stock) Color low price 27,180 W 27,180 W ~ 0 W -79 % 481,167 W 18 Low mid 34,981 W 34,981 W ~ 27,180 W -73 % 445,287 W 13 Mid 42,783 W 42,783 W ~ 34,981 W -68 % 409,406 W 10 High mid 50,584 W 50,584 W ~ 42,783 W -62 % 373,526 W 7 Suggested Purchase Amount 606,172 W Number of stocks purchased 5 Indication price Range Buying / Selling Buying / Selling [Stocks] High price 58,386 W 58,386 W~ ~ 50,584 W -56 % 337,645 W 6 2021-09-06 3 months Current stock price Evaluation Stock price rise probability score Investment opinion Prospective purchase amount 131,800 W High price 28.2 Normal 2,500,000 W 38.2 38.3 34.8 32.5 42.0 42.6 2021.04.13 2021.05.12 2021.06.10 2021.07.08 2021.08.05 2021.09.03 Stock price rise probability score A Sector 50.5 48.2 48.0 46.4 44.5 50.6 28.2 B Sector 25.8 28.3 21.7 46.4 39.6 34.6 Total average 2021.06.10 2021.07.08 2021.08.05 2021.09.03 Total of increase rate Total score A Sector -5 % -1 % -3 % -4 % 12 % 1 % 47.7 B Sector 9 % -31 % 53 % -17 % -14 % Total average 0 % -10 % -7 % 23 % 1 % 2021.05.12 51 48 48 46 44 51 26 28 22 46 40 35 38 38 35 33 42 43 0 10 20 30 40 50 60 2021.04.13 2021.05.12 2021.06.10 2021.07.08 2021.08.05 2021.09.03 Stock price rise probability score A sector B sector Total average -5% -1% -3% -4% 12% 9% -31% 53% -17% -14% 0% -10% -7% 23% 1% -40% -20% 0% 20% 40% 60% 2021.05.12 2021.06.10 2021.07.08 2021.08.05 2021.09.03 Increase rate of stock price rise A sector B sector Total average wemade
- 3. 정보와 완전 정보 결 투자판단 있습니 위배 무단으 숙지하 Compliance notice ① The information provided by The Algorithm Company Analysis Consulting is obtained through reliable data and information and The Algorithm Company Analysis Program (TACAP), but its accuracy or completeness are not guaranteed. Furthermore, it may change over time.Therefore, we are not legally responsible for the results of the data provided by The Algorithm Company Analysis Consulting because of information errors or omissions. ② The Algorithm Company Analysis Consulting and all the information provided on it site are reference materials for investment decisions and the final responsibility of investment is up to users utilizing this information. ③ The Algorithm Company Analysis Consulting and its site do not do anything that violates the related laws such as discretionary transaction. ④ Users can not reallocate and recycle the information provided by The Algorithm Company Analysis Consulting firm let alone the information provided by its Site. ⑤ Be sure to know about application period of this algorithm analysis report in order to improve its accuracy. Tel : 070 - 4667 - 5009 Email : tacac@tacac.co.kr Homepage : tacac.co.kr Blog : tacac.blog.me SERVICES M&A, IPO, RECOVER, CORPORATE RESTRUCTURING, MANAGEMENT OF TECHNOLOGY, BUSINESS STRATEGY, FAMILY BUSINESS Request : http://tacac.co.kr/?page_id=1374 ① Consulting is o The Algorithm accuracy or com change over tim results of the d Consulting bec ② information pr investment dec up ③ do anything th transaction. ④ The Algorithm information pr ⑤ analysis report