JAYJUN COSMETIC-025620-Algorithm Investment Report
•
0 likes•94 views

JAYJUN COSMETIC-025620-Algorithm Investment Report
![[Price for scheduled purchasing]
Arbitrarily made
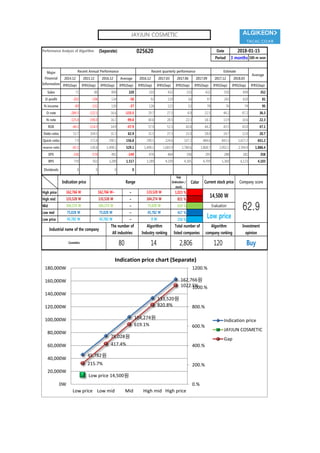
Algorithm stocks Trading Strategies (Separate) 025620 Date
Period
Gap
(Indication /
stock)
Color
2018-01-15
3 months
Current stock price Evaluation
Stock price rise
probability score
Investment opinion Prospective purchase amount
14,500 W Low price 65.4 Buy 10,000,000 W
Suggested Purchase
Amount 6,314,489 W
Number of stocks
purchased 435
Indication price Range Buying / Selling Buying / Selling [Stocks]
High price 162,766 W 162,766 W~ ~ 133,520 W 1,023 % -64,567,369 W All selling
High mid 133,520 W 133,520 W ~ 104,274 W 821 % -51,831,231 W All selling
Mid 104,274 W 104,274 W ~ 75,028 W 619 % -39,095,092 W All selling
Low mid 75,028 W 75,028 W ~ 45,782 W 417 % -26,358,954 W All selling
low price 45,782 W 45,782 W ~ 0 W 216 % -13,622,816 W All selling
2017.08.11 2017.09.11 2017.10.17 2017.11.14 2017.12.12 2018.01.12
45.0 31.1 56.1
Stock price rise
probability score
A Sector 47.6 49.2 48.6 49.2 45.5 52.2
65.4B Sector 36.7 36.7 49.2 49.2 16.7 60.0
Total average 42.2 42.9 44.1
-45 % 45 %
2017.09.11 2017.10.17 2017.11.14 2017.12.12 2018.01.12
Total of
increase rate
Total score
A Sector 3 % -1 % 1 % -8 % 13 %
1 % 50.0B Sector 0 % 7 % 20 % -195 % 72 %
Total average 2 % 3 % 2 %
3% -1% 1% -8%
13%0% 7% 20%
-195%
72%
2% 3% 2%
-45%
45%
-250%
-200%
-150%
-100%
-50%
0%
50%
100%
2017.09.11 2017.10.17 2017.11.14 2017.12.12 2018.01.12
Increase rate of stock price rise
A sector
B sector
Total average
JAYJUN COSMETIC
48 49 49 49
45
52
37 37 40
49
17
60
42 43 44 45
31
56
0
10
20
30
40
50
60
70
2017.08.11 2017.09.11 2017.10.17 2017.11.14 2017.12.12 2018.01.12
Stock price rise probability score
A sector
B sector
Total average](data:image/gif;base64,R0lGODlhAQABAIAAAAAAAP///yH5BAEAAAAALAAAAAABAAEAAAIBRAA7)
Recommended
Recommended
More Related Content
What's hot
What's hot (20)
Similar to JAYJUN COSMETIC-025620-Algorithm Investment Report
Similar to JAYJUN COSMETIC-025620-Algorithm Investment Report (20)
More from 알고리즘 기업분석 컨설팅-알기컨,algikeon
More from 알고리즘 기업분석 컨설팅-알기컨,algikeon (20)
Recently uploaded
Recently uploaded (20)
JAYJUN COSMETIC-025620-Algorithm Investment Report
- 1. Performance Analysis of Algorithm (Separate) 025620 Date Period 3 months 100-m won 2014.12 2015.12 2016.12 Average 2016.12 2017.03 2017.06 2017.09 2017.12 2018.03 IFRS(Sep) IFRS(Sep) IFRS(Sep) IFRS(Sep) IFRS(Sep) IFRS(Sep) IFRS(Sep) IFRS(Sep) IFRS(Sep) IFRS(Sep) IFRS(Sep) Sales 71 80 809 320 310 432 233 432 550 699 352 O-profit -202 -106 134 -58 92 119 16 97 243 610 81 N-income -89 -152 130 -37 126 123 52 78 76 74 95 O-rate -284.5 -132.5 16.6 -133.5 29.7 27.5 6.9 22.5 44.2 87.2 36.3 N-rate -125.4 -190.0 16.1 -99.8 40.6 28.5 22.3 18.1 13.9 10.6 22.3 ROE -44.3 -114.3 14.9 -47.9 57.9 51.5 42.6 44.2 43.5 43.0 47.1 Debt-ratio 52.7 104.5 31.5 62.9 31.5 27.3 21.0 18.0 14.7 12.0 20.7 Quick-ratio 7.9 172.4 290.1 156.8 290.1 324.6 337.2 484.6 843.3 1,627.2 651.2 reserve-ratio -41.5 130.6 1,498.1 529.1 1,498.1 1,683.9 1,780.6 1,868.7 2,092.1 2,394.9 1,886.4 EPS -336 -574 491 -140 476 464 196 295 288 281 358 BPS 759 502 3,289 1,517 3,289 4,109 4,305 4,709 5,369 6,123 4,103 Dividends 0 0 0 0 2018-01-15 Major Financial Information Recent Annual Performance Recent quarterly performance Estimate Average Gap (Indication / stock) Color High price ~ 1,023 % High mid ~ 821 % Mid ~ 619 % Low mid ~ 417 % Low price ~ 216 % Indication price Range Current stock price Company score 133,520 W 133,520 W 104,274 W 104,274 W 104,274 W 75,028 W Evaluation 162,766 W 162,766 W~ 133,520 W 14,500 W 62.975,028 W 75,028 W 45,782 W Low price Buy 45,782 W 45,782 W 0 W Industrial name of the company The number of All industries Algorithm Industry ranking Total number of listed companies Algorithm company ranking Investment opinion Cosmetics 80 14 2,806 120 45,782원 75,028원 104,274원 133,520원 162,766원 Low price 14,500원 215.7% 417.4% 619.1% 820.8% 1022.5% 0.% 200.% 400.% 600.% 800.% 1000.% 1200.% 0W 20,000W 40,000W 60,000W 80,000W 100,000W 120,000W 140,000W 160,000W 180,000W Low price Low mid Mid High mid High price Indication price chart (Separate) Indication price JAYJUN COSMETIC Gap JAYJUN COSMETIC
- 2. [Price for scheduled purchasing] Arbitrarily made Algorithm stocks Trading Strategies (Separate) 025620 Date Period Gap (Indication / stock) Color 2018-01-15 3 months Current stock price Evaluation Stock price rise probability score Investment opinion Prospective purchase amount 14,500 W Low price 65.4 Buy 10,000,000 W Suggested Purchase Amount 6,314,489 W Number of stocks purchased 435 Indication price Range Buying / Selling Buying / Selling [Stocks] High price 162,766 W 162,766 W~ ~ 133,520 W 1,023 % -64,567,369 W All selling High mid 133,520 W 133,520 W ~ 104,274 W 821 % -51,831,231 W All selling Mid 104,274 W 104,274 W ~ 75,028 W 619 % -39,095,092 W All selling Low mid 75,028 W 75,028 W ~ 45,782 W 417 % -26,358,954 W All selling low price 45,782 W 45,782 W ~ 0 W 216 % -13,622,816 W All selling 2017.08.11 2017.09.11 2017.10.17 2017.11.14 2017.12.12 2018.01.12 45.0 31.1 56.1 Stock price rise probability score A Sector 47.6 49.2 48.6 49.2 45.5 52.2 65.4B Sector 36.7 36.7 49.2 49.2 16.7 60.0 Total average 42.2 42.9 44.1 -45 % 45 % 2017.09.11 2017.10.17 2017.11.14 2017.12.12 2018.01.12 Total of increase rate Total score A Sector 3 % -1 % 1 % -8 % 13 % 1 % 50.0B Sector 0 % 7 % 20 % -195 % 72 % Total average 2 % 3 % 2 % 3% -1% 1% -8% 13%0% 7% 20% -195% 72% 2% 3% 2% -45% 45% -250% -200% -150% -100% -50% 0% 50% 100% 2017.09.11 2017.10.17 2017.11.14 2017.12.12 2018.01.12 Increase rate of stock price rise A sector B sector Total average JAYJUN COSMETIC 48 49 49 49 45 52 37 37 40 49 17 60 42 43 44 45 31 56 0 10 20 30 40 50 60 70 2017.08.11 2017.09.11 2017.10.17 2017.11.14 2017.12.12 2018.01.12 Stock price rise probability score A sector B sector Total average
- 3. may ded by Compliance notice ① The information provided by The Algorithm Company Analysis Consulting is obtained through reliable data and information and The Algorithm Company Analysis Program (TACAP), but its accuracy or completeness are not guaranteed. Furthermore, it may change over time.Therefore, we are not legally responsible for the results of the data provided by The Algorithm Company Analysis Consulting because of information errors or omissions. ② The Algorithm Company Analysis Consulting and all the information provided on it site are reference materials for investment decisions and the final responsibility of investment is up to users utilizing this information. ③ The Algorithm Company Analysis Consulting and its site do not do anything that violates the related laws such as discretionary transaction. ④ Users can not reallocate and recycle the information provided by The Algorithm Company Analysis Consulting firm let alone the information provided by its Site. ⑤ Be sure to know about application period of this algorithm analysis report in order to improve its accuracy. Tel : 070 - 4667 - 5009 Email : tacac@tacac.co.kr Homepage : tacac.co.kr Blog : tacac.blog.me SERVICES M&A, IPO, CORPORATE RESTRUCTURING, MANAGEMENT OF TECHNOLOGY, BUSINESS STRATEGY, FAMILY BUSINESS Request : http://tacac.co.kr/?page_id=1374