bioneer 064550 Algorithm Investment Report
•
1 like•130 views

bioneer 064550 Algorithm Investment Report
![[Price for scheduled purchasing]
Arbitrarily made
Algorithm stocks Trading Strategies (consolidated) 064550 Date
Period
Gap
(Indication /
stock)
Color
low price 15,438 W 15,438 W ~ 0 W -80 % 1,303,360 W 84
Low mid 20,645 W 20,645 W ~ 15,438 W -73 % 1,193,655 W 58
Mid 25,852 W 25,852 W ~ 20,645 W -67 % 1,083,950 W 42
High mid 31,059 W 31,059 W ~ 25,852 W -60 % 974,245 W 31
Suggested Purchase
Amount 1,628,630 W
Number of stocks
purchased 21
Indication price Range Buying / Selling Buying / Selling [Stocks]
High price 36,266 W 36,266 W~ ~ 31,059 W -53 % 864,540 W 24
2021-09-13
3 months
Current stock price Evaluation
Stock price rise
probability score
Investment opinion Prospective purchase amount
77,300 W High price 55.7 Normal 4,000,000 W
34.7 36.3 48.5 47.1 32.2 48.8
2021.04.20 2021.05.20 2021.06.17 2021.07.15 2021.08.12 2021.09.10
Stock price rise
probability score
A Sector 50.2 44.2 51.7 51.7 51.5 52.6
55.7
B Sector 19.2 28.3 45.4 51.7 12.9 45.0
Total average
2021.06.17 2021.07.15 2021.08.12 2021.09.10
Total of
increase rate
Total score
A Sector -14 % 14 % 0 % -0 % 2 %
3 % 54.0
B Sector 32 % 38 % 12 % -300 % 71 %
Total average 4 % 25 % -3 % -46 % 34 %
2021.05.20
50
44
52 52 51 53
19
28
45
52
13
45
35 36
49 47
32
49
0
10
20
30
40
50
60
2021.04.20 2021.05.20 2021.06.17 2021.07.15 2021.08.12 2021.09.10
Stock price rise probability score
A sector
B sector
Total average
-14%
14% 0% -0% 2%
32% 38%
12%
-300%
71%
4%
25%
-3%
-46%
34%
-400%
-300%
-200%
-100%
0%
100%
2021.05.20 2021.06.17 2021.07.15 2021.08.12 2021.09.10
Increase rate of stock price rise
A sector
B sector
Total average
bioneer](data:image/gif;base64,R0lGODlhAQABAIAAAAAAAP///yH5BAEAAAAALAAAAAABAAEAAAIBRAA7)
Recommended
Recommended
More Related Content
What's hot
What's hot (20)
Similar to bioneer 064550 Algorithm Investment Report
Similar to bioneer 064550 Algorithm Investment Report (20)
More from 알고리즘 기업분석 컨설팅-알기컨,algikeon
More from 알고리즘 기업분석 컨설팅-알기컨,algikeon (20)
Recently uploaded
Recently uploaded (20)
bioneer 064550 Algorithm Investment Report
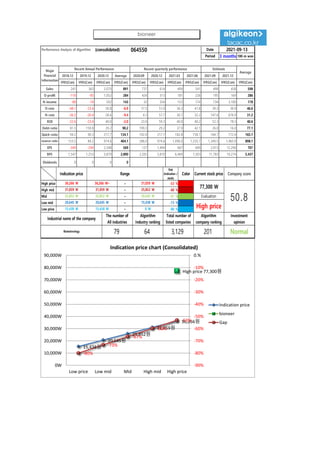
- 1. Performance Analysis of Algorithm (consolidated) 064550 Date Period 3 months 100-m won 2018.12 2019.12 2020.12 Average 2020.09 2020.12 2021.03 2021.06 2021.09 2021.12 IFRS(Con) IFRS(Con) IFRS(Con) IFRS(Con) IFRS(Con) IFRS(Con) IFRS(Con) IFRS(Con) IFRS(Con) IFRS(Con) IFRS(Con) Sales 241 363 2,070 891 737 614 499 541 498 458 598 O-profit -116 -85 1,052 284 424 313 181 226 195 169 286 N-income -88 -74 592 143 32 354 153 174 734 3,100 178 O-rate -48.1 -23.4 50.8 -6.9 57.5 51.0 36.3 41.8 39.3 36.9 46.6 N-rate -36.5 -20.4 28.6 -9.4 4.3 57.7 30.7 32.2 147.6 676.9 31.2 ROE -22.6 -23.4 40.0 -2.0 23.0 59.3 40.0 40.2 52.3 78.3 40.6 Debt-ratio 81.5 159.8 29.2 90.2 199.3 29.2 37.9 42.1 26.0 16.0 77.1 Quick-ratio 94.2 90.3 217.7 134.1 102.0 217.7 182.8 158.1 164.7 172.4 165.1 reserve-ratio 153.5 84.2 974.6 404.1 286.0 974.6 1,096.0 1,235.7 1,349.5 1,465.9 898.1 EPS -349 -294 2,348 569 127 1,404 607 690 2,913 12,294 707 BPS 1,547 1,253 5,870 2,890 2,205 5,870 6,469 7,203 11,783 19,274 5,437 Dividends 0 0 0 0 Major Financial Information Recent Annual Performance Recent quarterly performance Estimate Average 2021-09-13 Gap (Indication / stock) Color High price ~ -53 % High mid ~ -60 % Mid ~ -67 % Low mid ~ -73 % Low price ~ -80 % Normal 15,438 W 15,438 W 0 W Industrial name of the company The number of All industries Algorithm Industry ranking Total number of listed companies Algorithm company ranking Investment opinion Biotechnology 79 64 3,129 201 31,059 W 31,059 W 25,852 W 25,852 W 25,852 W 20,645 W Evaluation 36,266 W 36,266 W~ 31,059 W 77,300 W 50.8 20,645 W 20,645 W 15,438 W High price Indication price Range Current stock price Company score 15,438원 20,645원 25,852원 31,059원 36,266원 High price 77,300원 -80% -73% -67% -60% -53% -90% -80% -70% -60% -50% -40% -30% -20% -10% 0.% 0W 10,000W 20,000W 30,000W 40,000W 50,000W 60,000W 70,000W 80,000W 90,000W Low price Low mid Mid High mid High price Indication price chart (Consolidated) Indication price bioneer Gap bioneer
- 2. [Price for scheduled purchasing] Arbitrarily made Algorithm stocks Trading Strategies (consolidated) 064550 Date Period Gap (Indication / stock) Color low price 15,438 W 15,438 W ~ 0 W -80 % 1,303,360 W 84 Low mid 20,645 W 20,645 W ~ 15,438 W -73 % 1,193,655 W 58 Mid 25,852 W 25,852 W ~ 20,645 W -67 % 1,083,950 W 42 High mid 31,059 W 31,059 W ~ 25,852 W -60 % 974,245 W 31 Suggested Purchase Amount 1,628,630 W Number of stocks purchased 21 Indication price Range Buying / Selling Buying / Selling [Stocks] High price 36,266 W 36,266 W~ ~ 31,059 W -53 % 864,540 W 24 2021-09-13 3 months Current stock price Evaluation Stock price rise probability score Investment opinion Prospective purchase amount 77,300 W High price 55.7 Normal 4,000,000 W 34.7 36.3 48.5 47.1 32.2 48.8 2021.04.20 2021.05.20 2021.06.17 2021.07.15 2021.08.12 2021.09.10 Stock price rise probability score A Sector 50.2 44.2 51.7 51.7 51.5 52.6 55.7 B Sector 19.2 28.3 45.4 51.7 12.9 45.0 Total average 2021.06.17 2021.07.15 2021.08.12 2021.09.10 Total of increase rate Total score A Sector -14 % 14 % 0 % -0 % 2 % 3 % 54.0 B Sector 32 % 38 % 12 % -300 % 71 % Total average 4 % 25 % -3 % -46 % 34 % 2021.05.20 50 44 52 52 51 53 19 28 45 52 13 45 35 36 49 47 32 49 0 10 20 30 40 50 60 2021.04.20 2021.05.20 2021.06.17 2021.07.15 2021.08.12 2021.09.10 Stock price rise probability score A sector B sector Total average -14% 14% 0% -0% 2% 32% 38% 12% -300% 71% 4% 25% -3% -46% 34% -400% -300% -200% -100% 0% 100% 2021.05.20 2021.06.17 2021.07.15 2021.08.12 2021.09.10 Increase rate of stock price rise A sector B sector Total average bioneer
- 3. 정보와 완전 정보 결 투자판단 있습니 위배 무단으 숙지하 Compliance notice ① The information provided by The Algorithm Company Analysis Consulting is obtained through reliable data and information and The Algorithm Company Analysis Program (TACAP), but its accuracy or completeness are not guaranteed. Furthermore, it may change over time.Therefore, we are not legally responsible for the results of the data provided by The Algorithm Company Analysis Consulting because of information errors or omissions. ② The Algorithm Company Analysis Consulting and all the information provided on it site are reference materials for investment decisions and the final responsibility of investment is up to users utilizing this information. ③ The Algorithm Company Analysis Consulting and its site do not do anything that violates the related laws such as discretionary transaction. ④ Users can not reallocate and recycle the information provided by The Algorithm Company Analysis Consulting firm let alone the information provided by its Site. ⑤ Be sure to know about application period of this algorithm analysis report in order to improve its accuracy. Tel : 070 - 4667 - 5009 Email : tacac@tacac.co.kr Homepage : tacac.co.kr Blog : tacac.blog.me SERVICES M&A, IPO, RECOVER, CORPORATE RESTRUCTURING, MANAGEMENT OF TECHNOLOGY, BUSINESS STRATEGY, FAMILY BUSINESS Request : http://tacac.co.kr/?page_id=1374 ① Consulting is o The Algorithm accuracy or com change over tim results of the d Consulting bec ② information pr investment dec up ③ do anything th transaction. ④ The Algorithm information pr ⑤ analysis report