pulmuone 017810 Algorithm Investment Report
•
0 likes•82 views

pulmuone 017810 Algorithm Investment Report
![[Price for scheduled purchasing]
Arbitrarily made
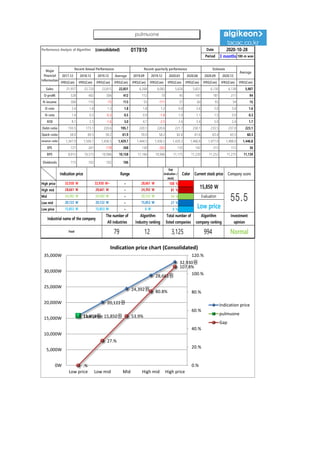
Algorithm stocks Trading Strategies (consolidated) 017810 Date
Period
Gap
(Indication /
stock)
Color
2020-10-28
3 months
Current stock price Evaluation
Stock price rise
probability score
Investment opinion Prospective purchase amount
15,850 W Low price 45.6 Normal 8,000,000 W
Suggested Purchase
Amount 3,491,092 W
Number of stocks
purchased 220
Indication price Range Buying / Selling Buying / Selling [Stocks]
High price 32,930 W 32,930 W~ ~ 28,661 W 108 % -3,761,945 W All selling
High mid 28,661 W 28,661 W ~ 24,392 W 81 % -2,821,641 W -98
Mid 24,392 W 24,392 W ~ 20,122 W 54 % -1,881,337 W -77
Low mid 20,122 W 20,122 W ~ 15,853 W 27 % -941,033 W -47
low price 15,853 W 15,853 W ~ 0 W 0 % -728 W -0
Stock price rise
probability score
A Sector 43.1 53.9 49.4 46.7 50.6 52.3
45.6B Sector 30.8 34.2 32.5 46.7 39.2 50.0
Total average
2020.06.02 2020.06.30 2020.07.28 2020.08.26 2020.09.23 2020.10.27
37.0 44.1 40.9 25.0 44.9 51.1
44 % 12 %
2020.06.30 2020.07.28 2020.08.26 2020.09.23 2020.10.27
Total of
increase rate
Total score
A Sector 20 % -9 % -6 % 8 % 3 %
0 % 52.3B Sector 10 % -5 % 30 % -19 % 22 %
Total average 16 % -8 % -64 %
43
54
49
47
51 52
31
34 33
47
39
50
37
44
41
25
45
51
0
10
20
30
40
50
60
2020.06.02 2020.06.30 2020.07.28 2020.08.26 2020.09.23 2020.10.27
Stock price rise probability score
A sector
B sector
Total average
20%
-9% -6%
8% 3%
10%
-5%
30%
-19%
22%
16%
-8%
-64%
44%
12%
-80%
-60%
-40%
-20%
0%
20%
40%
60%
2020.06.30 2020.07.28 2020.08.26 2020.09.23 2020.10.27
Increase rate of stock price rise
A sector
B sector
Total average
pulmuone](data:image/gif;base64,R0lGODlhAQABAIAAAAAAAP///yH5BAEAAAAALAAAAAABAAEAAAIBRAA7)
Recommended
Recommended
More Related Content
What's hot
What's hot (20)
Similar to pulmuone 017810 Algorithm Investment Report
Similar to pulmuone 017810 Algorithm Investment Report (16)
More from 알고리즘 기업분석 컨설팅-알기컨,algikeon
More from 알고리즘 기업분석 컨설팅-알기컨,algikeon (20)
Recently uploaded
Recently uploaded (20)
pulmuone 017810 Algorithm Investment Report
- 1. Performance Analysis of Algorithm (consolidated) 017810 Date Period 3 months 100-m won 2017.12 2018.12 2019.12 Average 2019.09 2019.12 2020.03 2020.06 2020.09 2020.12 IFRS(Con) IFRS(Con) IFRS(Con) IFRS(Con) IFRS(Con) IFRS(Con) IFRS(Con) IFRS(Con) IFRS(Con) IFRS(Con) IFRS(Con) Sales 21,957 22,720 23,815 22,831 6,268 6,082 5,626 5,651 6,130 6,138 5,907 O-profit 528 402 306 412 112 70 45 147 181 211 94 N-income 304 110 -75 113 55 -111 57 60 93 54 15 O-rate 2.4 1.8 1.3 1.8 1.8 1.2 0.8 2.6 3.0 3.4 1.6 N-rate 1.4 0.5 -0.3 0.5 0.9 -1.8 1.0 1.1 1.5 0.9 0.3 ROE 8.1 2.5 -1.6 3.0 4.7 -2.5 2.4 2.4 3.0 2.4 1.7 Debt-ratio 193.5 173.1 220.6 195.7 220.1 220.6 221.7 230.1 233.5 237.0 223.1 Quick-ratio 58.0 69.5 58.2 61.9 59.0 58.2 62.6 61.6 63.4 65.5 60.3 reserve-ratio 1,347.9 1,504.7 1,436.5 1,429.7 1,444.5 1,436.5 1,439.3 1,466.8 1,477.0 1,488.0 1,446.8 EPS 721 261 -178 268 130 -263 135 142 215 112 36 BPS 8,915 10,573 10,986 10,158 11,166 10,986 11,175 11,230 11,252 11,275 11,139 Dividends 115 102 102 106 2020-10-28 Major Financial Information Recent Annual Performance Recent quarterly performance Estimate Average Gap (Indication / stock) Color High price ~ 108 % High mid ~ 81 % Mid ~ 54 % Low mid ~ 27 % Low price ~ 0 % Indication price Range Current stock price Company score 28,661 W 28,661 W 24,392 W 24,392 W 24,392 W 20,122 W Evaluation 32,930 W 32,930 W~ 28,661 W 15,850 W 55.520,122 W 20,122 W 15,853 W Low price Normal 15,853 W 15,853 W 0 W Industrial name of the company The number of All industries Algorithm Industry ranking Total number of listed companies Algorithm company ranking Investment opinion Food 79 12 3,125 994 15,853원 20,122원 24,392원 28,661원 32,930원 Low price 15,850원 .% 27.% 53.9% 80.8% 107.8% 0.% 20.% 40.% 60.% 80.% 100.% 120.% 0W 5,000W 10,000W 15,000W 20,000W 25,000W 30,000W 35,000W Low price Low mid Mid High mid High price Indication price chart (Consolidated) Indication price pulmuone Gap pulmuone
- 2. [Price for scheduled purchasing] Arbitrarily made Algorithm stocks Trading Strategies (consolidated) 017810 Date Period Gap (Indication / stock) Color 2020-10-28 3 months Current stock price Evaluation Stock price rise probability score Investment opinion Prospective purchase amount 15,850 W Low price 45.6 Normal 8,000,000 W Suggested Purchase Amount 3,491,092 W Number of stocks purchased 220 Indication price Range Buying / Selling Buying / Selling [Stocks] High price 32,930 W 32,930 W~ ~ 28,661 W 108 % -3,761,945 W All selling High mid 28,661 W 28,661 W ~ 24,392 W 81 % -2,821,641 W -98 Mid 24,392 W 24,392 W ~ 20,122 W 54 % -1,881,337 W -77 Low mid 20,122 W 20,122 W ~ 15,853 W 27 % -941,033 W -47 low price 15,853 W 15,853 W ~ 0 W 0 % -728 W -0 Stock price rise probability score A Sector 43.1 53.9 49.4 46.7 50.6 52.3 45.6B Sector 30.8 34.2 32.5 46.7 39.2 50.0 Total average 2020.06.02 2020.06.30 2020.07.28 2020.08.26 2020.09.23 2020.10.27 37.0 44.1 40.9 25.0 44.9 51.1 44 % 12 % 2020.06.30 2020.07.28 2020.08.26 2020.09.23 2020.10.27 Total of increase rate Total score A Sector 20 % -9 % -6 % 8 % 3 % 0 % 52.3B Sector 10 % -5 % 30 % -19 % 22 % Total average 16 % -8 % -64 % 43 54 49 47 51 52 31 34 33 47 39 50 37 44 41 25 45 51 0 10 20 30 40 50 60 2020.06.02 2020.06.30 2020.07.28 2020.08.26 2020.09.23 2020.10.27 Stock price rise probability score A sector B sector Total average 20% -9% -6% 8% 3% 10% -5% 30% -19% 22% 16% -8% -64% 44% 12% -80% -60% -40% -20% 0% 20% 40% 60% 2020.06.30 2020.07.28 2020.08.26 2020.09.23 2020.10.27 Increase rate of stock price rise A sector B sector Total average pulmuone
- 3. 정보와 완전 정보 결 투자판단 있습니 위배 무단으 숙지하 Compliance notice ① The information provided by The Algorithm Company Analysis Consulting is obtained through reliable data and information and The Algorithm Company Analysis Program (TACAP), but its accuracy or completeness are not guaranteed. Furthermore, it may change over time.Therefore, we are not legally responsible for the results of the data provided by The Algorithm Company Analysis Consulting because of information errors or omissions. ② The Algorithm Company Analysis Consulting and all the information provided on it site are reference materials for investment decisions and the final responsibility of investment is up to users utilizing this information. ③ The Algorithm Company Analysis Consulting and its site do not do anything that violates the related laws such as discretionary transaction. ④ Users can not reallocate and recycle the information provided by The Algorithm Company Analysis Consulting firm let alone the information provided by its Site. ⑤ Be sure to know about application period of this algorithm analysis report in order to improve its accuracy. Tel : 070 - 4667 - 5009 Email : tacac@tacac.co.kr Homepage : tacac.co.kr Blog : tacac.blog.me SERVICES M&A, IPO, RECOVER, CORPORATE RESTRUCTURING, MANAGEMENT OF TECHNOLOGY, BUSINESS STRATEGY, FAMILY BUSINESS Request : http://tacac.co.kr/?page_id=1374 ① Consulting is o The Algorithm accuracy or com change over tim results of the d Consulting bec ② information pr investment dec up ③ do anything th transaction. ④ The Algorithm information pr ⑤ analysis report