celltrion pharm 068760 Algorithm Investment Report
•
0 likes•76 views

celltrion pharm 068760 Algorithm Investment Report
![[Price for scheduled purchasing]
Arbitrarily made
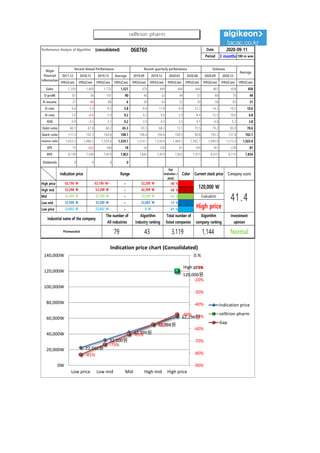
Algorithm stocks Trading Strategies (consolidated) 068760 Date
Period
Gap
(Indication /
stock)
Color
low price 22,602 W 22,602 W ~ 0 W -81 % 622,234 W 28
Low mid 32,500 W 32,500 W ~ 22,602 W -73 % 558,996 W 17
Mid 42,399 W 42,399 W ~ 32,500 W -65 % 495,759 W 12
High mid 52,298 W 52,298 W ~ 42,399 W -56 % 432,521 W 8
Suggested Purchase
Amount 766,628 W
Number of stocks
purchased 6
Indication price Range Buying / Selling Buying / Selling [Stocks]
High price 62,196 W 62,196 W~ ~ 52,298 W -48 % 369,283 W 6
2020-09-11
3 months
Current stock price Evaluation
Stock price rise
probability score
Investment opinion Prospective purchase amount
120,000 W High price 48.3 Normal 2,500,000 W
31.8 45.9 49.8 29.6 37.4 40.6
2020.04.17 2020.05.20 2020.06.17 2020.07.15 2020.08.12 2020.09.10
Stock price rise
probability score
A Sector 49.8 50.6 46.7 48.9 47.3 44.6
48.3B Sector 13.8 41.3 52.9 48.9 27.5 36.7
Total average
2020.06.17 2020.07.15 2020.08.12 2020.09.10
Total of
increase rate
Total score
A Sector 2 % -8 % 4 % -3 % -6 %
-0 % 51.3B Sector 67 % 22 % -8 % -78 % 25 %
Total average 31 % 8 % -68 % 21 % 8 %
2020.05.20
50 51
47 49 47
45
14
41
53
49
28
37
32
46
50
30
37
41
0
10
20
30
40
50
60
2020.04.17 2020.05.20 2020.06.17 2020.07.15 2020.08.12 2020.09.10
Stock price rise probability score
A sector
B sector
Total average
2%
-8%
4%
-3% -6%
67%
22%
-8%
-78%
25%31%
8%
-68%
21%
8%
-100%
-80%
-60%
-40%
-20%
0%
20%
40%
60%
80%
2020.05.20 2020.06.17 2020.07.15 2020.08.12 2020.09.10
Increase rate of stock price rise
A sector
B sector
Total average
celltrion pharm](data:image/gif;base64,R0lGODlhAQABAIAAAAAAAP///yH5BAEAAAAALAAAAAABAAEAAAIBRAA7)
Recommended
Recommended
More Related Content
What's hot
What's hot (20)
Similar to celltrion pharm 068760 Algorithm Investment Report
Similar to celltrion pharm 068760 Algorithm Investment Report (20)
More from 알고리즘 기업분석 컨설팅-알기컨,algikeon
More from 알고리즘 기업분석 컨설팅-알기컨,algikeon (20)
Recently uploaded
Recently uploaded (20)
celltrion pharm 068760 Algorithm Investment Report
- 1. Performance Analysis of Algorithm (consolidated) 068760 Date Period 3 months 100-m won 2017.12 2018.12 2019.12 Average 2019.09 2019.12 2020.03 2020.06 2020.09 2020.12 IFRS(Con) IFRS(Con) IFRS(Con) IFRS(Con) IFRS(Con) IFRS(Con) IFRS(Con) IFRS(Con) IFRS(Con) IFRS(Con) IFRS(Con) Sales 1,359 1,469 1,735 1,521 474 449 444 464 461 458 458 O-profit 87 36 147 90 40 53 44 57 66 75 49 N-income 27 -94 86 6 20 43 22 39 58 85 31 O-rate 6.4 2.5 8.5 5.8 8.4 11.8 9.9 12.3 14.2 16.5 10.6 N-rate 2.0 -6.4 5.0 0.2 4.2 9.6 5.0 8.4 12.5 18.6 6.8 ROE 0.9 -3.5 3.1 0.2 2.9 4.5 3.5 4.1 4.6 5.2 3.8 Debt-ratio 60.1 67.6 68.2 65.3 65.5 68.2 73.1 75.5 79.2 83.0 70.6 Quick-ratio 117.3 102.3 104.6 108.1 106.4 104.6 100.5 96.8 105.2 131.8 102.1 reserve-ratio 1,653.3 1,486.5 1,539.4 1,559.7 1,514.1 1,539.4 1,469.3 1,492.7 1,499.0 1,515.4 1,503.9 EPS 75 -262 240 18 56 120 61 109 161 238 87 BPS 8,199 7,540 7,819 7,853 7,685 7,819 7,855 7,975 8,075 8,175 7,834 Dividends 0 0 0 0 Major Financial Information Recent Annual Performance Recent quarterly performance Estimate Average 2020-09-11 Gap (Indication / stock) Color High price ~ -48 % High mid ~ -56 % Mid ~ -65 % Low mid ~ -73 % Low price ~ -81 % Normal 22,602 W 22,602 W 0 W Industrial name of the company The number of All industries Algorithm Industry ranking Total number of listed companies Algorithm company ranking Investment opinion Pharmaceutical 79 43 3,119 1,144 52,298 W 52,298 W 42,399 W 42,399 W 42,399 W 32,500 W Evaluation 62,196 W 62,196 W~ 52,298 W 120,000 W 41.432,500 W 32,500 W 22,602 W High price Indication price Range Current stock price Company score 22,602원 32,500원 42,399원 52,298원 62,196원 High price 120,000원 -81% -73% -65% -56% -48% -90% -80% -70% -60% -50% -40% -30% -20% -10% 0.% 0W 20,000W 40,000W 60,000W 80,000W 100,000W 120,000W 140,000W Low price Low mid Mid High mid High price Indication price chart (Consolidated) Indication price celltrion pharm Gap celltrion pharm
- 2. [Price for scheduled purchasing] Arbitrarily made Algorithm stocks Trading Strategies (consolidated) 068760 Date Period Gap (Indication / stock) Color low price 22,602 W 22,602 W ~ 0 W -81 % 622,234 W 28 Low mid 32,500 W 32,500 W ~ 22,602 W -73 % 558,996 W 17 Mid 42,399 W 42,399 W ~ 32,500 W -65 % 495,759 W 12 High mid 52,298 W 52,298 W ~ 42,399 W -56 % 432,521 W 8 Suggested Purchase Amount 766,628 W Number of stocks purchased 6 Indication price Range Buying / Selling Buying / Selling [Stocks] High price 62,196 W 62,196 W~ ~ 52,298 W -48 % 369,283 W 6 2020-09-11 3 months Current stock price Evaluation Stock price rise probability score Investment opinion Prospective purchase amount 120,000 W High price 48.3 Normal 2,500,000 W 31.8 45.9 49.8 29.6 37.4 40.6 2020.04.17 2020.05.20 2020.06.17 2020.07.15 2020.08.12 2020.09.10 Stock price rise probability score A Sector 49.8 50.6 46.7 48.9 47.3 44.6 48.3B Sector 13.8 41.3 52.9 48.9 27.5 36.7 Total average 2020.06.17 2020.07.15 2020.08.12 2020.09.10 Total of increase rate Total score A Sector 2 % -8 % 4 % -3 % -6 % -0 % 51.3B Sector 67 % 22 % -8 % -78 % 25 % Total average 31 % 8 % -68 % 21 % 8 % 2020.05.20 50 51 47 49 47 45 14 41 53 49 28 37 32 46 50 30 37 41 0 10 20 30 40 50 60 2020.04.17 2020.05.20 2020.06.17 2020.07.15 2020.08.12 2020.09.10 Stock price rise probability score A sector B sector Total average 2% -8% 4% -3% -6% 67% 22% -8% -78% 25%31% 8% -68% 21% 8% -100% -80% -60% -40% -20% 0% 20% 40% 60% 80% 2020.05.20 2020.06.17 2020.07.15 2020.08.12 2020.09.10 Increase rate of stock price rise A sector B sector Total average celltrion pharm
- 3. 정보와 완전 정보 결 투자판단 있습니 위배 무단으 숙지하 Compliance notice ① The information provided by The Algorithm Company Analysis Consulting is obtained through reliable data and information and The Algorithm Company Analysis Program (TACAP), but its accuracy or completeness are not guaranteed. Furthermore, it may change over time.Therefore, we are not legally responsible for the results of the data provided by The Algorithm Company Analysis Consulting because of information errors or omissions. ② The Algorithm Company Analysis Consulting and all the information provided on it site are reference materials for investment decisions and the final responsibility of investment is up to users utilizing this information. ③ The Algorithm Company Analysis Consulting and its site do not do anything that violates the related laws such as discretionary transaction. ④ Users can not reallocate and recycle the information provided by The Algorithm Company Analysis Consulting firm let alone the information provided by its Site. ⑤ Be sure to know about application period of this algorithm analysis report in order to improve its accuracy. Tel : 070 - 4667 - 5009 Email : tacac@tacac.co.kr Homepage : tacac.co.kr Blog : tacac.blog.me SERVICES M&A, IPO, RECOVER, CORPORATE RESTRUCTURING, MANAGEMENT OF TECHNOLOGY, BUSINESS STRATEGY, FAMILY BUSINESS Request : http://tacac.co.kr/?page_id=1374 ① Consulting is o The Algorithm accuracy or com change over tim results of the d Consulting bec ② information pr investment dec up ③ do anything th transaction. ④ The Algorithm information pr ⑤ analysis report