Performance Analysis of Algorithm Company Over 3 Months
•
1 like•155 views

gs 078930 Algorithm Investment Report
![[Price for scheduled purchasing]
Arbitrarily made
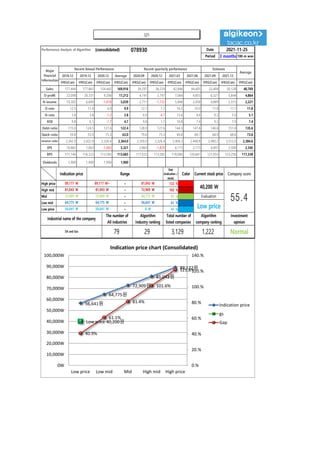
Algorithm stocks Trading Strategies (consolidated) 078930 Date
Period
Gap
(Indication /
stock)
Color
low price 56,641 W 56,641 W ~ 0 W 41 % -1,725,427 W -30
Low mid 64,775 W 64,775 W ~ 56,641 W 61 % -2,579,101 W -40
Mid 72,909 W 72,909 W ~ 64,775 W 81 % -3,432,776 W -47
High mid 81,043 W 81,043 W ~ 72,909 W 102 % -4,286,450 W All selling
Suggested Purchase
Amount 4,218,940 W
Number of stocks
purchased 105
Indication price Range Buying / Selling Buying / Selling [Stocks]
High price 89,177 W 89,177 W~ ~ 81,043 W 122 % -5,140,124 W All selling
2021-11-25
3 months
Current stock price Evaluation
Stock price rise
probability score
Investment opinion Prospective purchase amount
40,200 W Low price 46.9 Normal 10,000,000 W
48.6 39.7 42.6 34.2 39.7 37.5
2021.06.29 2021.07.27 2021.08.25 2021.09.27 2021.10.27 2021.11.24
Stock price rise
probability score
A Sector 47.5 47.7 47.3 53.0 43.1 44.6
46.9
B Sector 49.6 31.7 37.9 53.0 36.3 30.4
Total average
2021.08.25 2021.09.27 2021.10.27 2021.11.24
Total of
increase rate
Total score
A Sector 0 % -1 % 11 % -23 % 3 %
-6 % 41.3
B Sector -57 % 16 % 28 % -46 % -19 %
Total average -22 % 7 % -25 % 14 % -6 %
2021.07.27
48 48 47
53
43 45
50
32
38
53
36
30
49
40
43
34
40 37
0
10
20
30
40
50
60
2021.06.29 2021.07.27 2021.08.25 2021.09.27 2021.10.27 2021.11.24
Stock price rise probability score
A sector
B sector
Total average
0% -1%
11%
-23%
3%
-57%
16%
28%
-46%
-19%
-22%
7%
-25%
14%
-6%
-80%
-60%
-40%
-20%
0%
20%
40%
2021.07.27 2021.08.25 2021.09.27 2021.10.27 2021.11.24
Increase rate of stock price rise
A sector
B sector
Total average
gs](data:image/gif;base64,R0lGODlhAQABAIAAAAAAAP///yH5BAEAAAAALAAAAAABAAEAAAIBRAA7)
Recommended
Recommended
More Related Content
What's hot
What's hot (20)
Similar to Performance Analysis of Algorithm Company Over 3 Months
Similar to Performance Analysis of Algorithm Company Over 3 Months (20)
More from 알고리즘 기업분석 컨설팅-알기컨,algikeon
More from 알고리즘 기업분석 컨설팅-알기컨,algikeon (20)
Recently uploaded
Recently uploaded (20)
Performance Analysis of Algorithm Company Over 3 Months
- 1. Performance Analysis of Algorithm (consolidated) 078930 Date Period 3 months 100-m won 2018.12 2019.12 2020.12 Average 2020.09 2020.12 2021.03 2021.06 2021.09 2021.12 IFRS(Con) IFRS(Con) IFRS(Con) IFRS(Con) IFRS(Con) IFRS(Con) IFRS(Con) IFRS(Con) IFRS(Con) IFRS(Con) IFRS(Con) Sales 177,444 177,861 154,442 169,916 39,297 36,529 42,846 44,405 53,404 50,128 40,769 O-profit 22,098 20,331 9,206 17,212 4,741 2,797 7,064 4,855 6,327 5,844 4,864 N-income 10,305 6,689 -1,878 5,039 2,711 -1,732 5,846 2,058 4,889 2,515 2,221 O-rate 12.5 11.4 6.0 9.9 12.1 7.7 16.5 10.9 11.8 11.7 11.8 N-rate 5.8 3.8 -1.2 2.8 6.9 -4.7 13.6 4.6 9.2 5.0 5.1 ROE 9.8 6.1 -1.7 4.7 9.8 1.7 10.8 7.4 9.3 7.9 7.4 Debt-ratio 115.0 124.5 127.6 122.4 128.9 127.6 144.3 141.6 146.6 151.8 135.6 Quick-ratio 59.8 53.9 75.3 63.0 79.6 75.3 69.8 69.7 68.9 68.6 73.6 reserve-ratio 2,342.9 2,422.9 2,326.4 2,364.0 2,359.0 2,326.4 2,404.3 2,448.8 2,480.2 2,512.0 2,384.6 EPS 10,882 7,063 -1,983 5,321 2,863 -1,829 6,173 2,173 4,497 2,508 2,345 BPS 111,140 116,323 113,585 113,683 117,035 113,585 118,066 120,667 121,955 123,256 117,338 Dividends 1,900 1,900 1,900 1,900 Major Financial Information Recent Annual Performance Recent quarterly performance Estimate Average 2021-11-25 Gap (Indication / stock) Color High price ~ 122 % High mid ~ 102 % Mid ~ 81 % Low mid ~ 61 % Low price ~ 41 % Normal 56,641 W 56,641 W 0 W Industrial name of the company The number of All industries Algorithm Industry ranking Total number of listed companies Algorithm company ranking Investment opinion Oil and Gas 79 29 3,129 1,222 81,043 W 81,043 W 72,909 W 72,909 W 72,909 W 64,775 W Evaluation 89,177 W 89,177 W~ 81,043 W 40,200 W 55.4 64,775 W 64,775 W 56,641 W Low price Indication price Range Current stock price Company score 56,641원 64,775원 72,909원 81,043원 89,177원 Low price 40,200원 40.9% 61.1% 81.4% 101.6% 121.8% 0.% 20.% 40.% 60.% 80.% 100.% 120.% 140.% 0W 10,000W 20,000W 30,000W 40,000W 50,000W 60,000W 70,000W 80,000W 90,000W 100,000W Low price Low mid Mid High mid High price Indication price chart (Consolidated) Indication price gs Gap gs
- 2. [Price for scheduled purchasing] Arbitrarily made Algorithm stocks Trading Strategies (consolidated) 078930 Date Period Gap (Indication / stock) Color low price 56,641 W 56,641 W ~ 0 W 41 % -1,725,427 W -30 Low mid 64,775 W 64,775 W ~ 56,641 W 61 % -2,579,101 W -40 Mid 72,909 W 72,909 W ~ 64,775 W 81 % -3,432,776 W -47 High mid 81,043 W 81,043 W ~ 72,909 W 102 % -4,286,450 W All selling Suggested Purchase Amount 4,218,940 W Number of stocks purchased 105 Indication price Range Buying / Selling Buying / Selling [Stocks] High price 89,177 W 89,177 W~ ~ 81,043 W 122 % -5,140,124 W All selling 2021-11-25 3 months Current stock price Evaluation Stock price rise probability score Investment opinion Prospective purchase amount 40,200 W Low price 46.9 Normal 10,000,000 W 48.6 39.7 42.6 34.2 39.7 37.5 2021.06.29 2021.07.27 2021.08.25 2021.09.27 2021.10.27 2021.11.24 Stock price rise probability score A Sector 47.5 47.7 47.3 53.0 43.1 44.6 46.9 B Sector 49.6 31.7 37.9 53.0 36.3 30.4 Total average 2021.08.25 2021.09.27 2021.10.27 2021.11.24 Total of increase rate Total score A Sector 0 % -1 % 11 % -23 % 3 % -6 % 41.3 B Sector -57 % 16 % 28 % -46 % -19 % Total average -22 % 7 % -25 % 14 % -6 % 2021.07.27 48 48 47 53 43 45 50 32 38 53 36 30 49 40 43 34 40 37 0 10 20 30 40 50 60 2021.06.29 2021.07.27 2021.08.25 2021.09.27 2021.10.27 2021.11.24 Stock price rise probability score A sector B sector Total average 0% -1% 11% -23% 3% -57% 16% 28% -46% -19% -22% 7% -25% 14% -6% -80% -60% -40% -20% 0% 20% 40% 2021.07.27 2021.08.25 2021.09.27 2021.10.27 2021.11.24 Increase rate of stock price rise A sector B sector Total average gs
- 3. 정보와 완전 정보 결 투자판단 있습니 위배 무단으 숙지하 Compliance notice ① The information provided by The Algorithm Company Analysis Consulting is obtained through reliable data and information and The Algorithm Company Analysis Program (TACAP), but its accuracy or completeness are not guaranteed. Furthermore, it may change over time.Therefore, we are not legally responsible for the results of the data provided by The Algorithm Company Analysis Consulting because of information errors or omissions. ② The Algorithm Company Analysis Consulting and all the information provided on it site are reference materials for investment decisions and the final responsibility of investment is up to users utilizing this information. ③ The Algorithm Company Analysis Consulting and its site do not do anything that violates the related laws such as discretionary transaction. ④ Users can not reallocate and recycle the information provided by The Algorithm Company Analysis Consulting firm let alone the information provided by its Site. ⑤ Be sure to know about application period of this algorithm analysis report in order to improve its accuracy. Tel : 070 - 4667 - 5009 Email : tacac@tacac.co.kr Homepage : tacac.co.kr Blog : tacac.blog.me SERVICES M&A, IPO, RECOVER, CORPORATE RESTRUCTURING, MANAGEMENT OF TECHNOLOGY, BUSINESS STRATEGY, FAMILY BUSINESS Request : http://tacac.co.kr/?page_id=1374 ① Consulting is o The Algorithm accuracy or com change over tim results of the d Consulting bec ② information pr investment dec up ③ do anything th transaction. ④ The Algorithm information pr ⑤ analysis report