lotte chemical 011170 Algorithm Investment Report
•
0 likes•73 views

lotte chemical 011170 Algorithm Investment Report
![[Price for scheduled purchasing]
Arbitrarily made
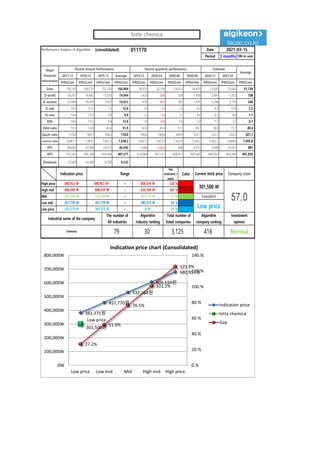
Algorithm stocks Trading Strategies (consolidated) 011170 Date
Period
Gap
(Indication /
stock)
Color
2021-03-15
3 months
Current stock price Evaluation
Stock price rise
probability score
Investment opinion Prospective purchase amount
301,500 W Low price 42.4 Normal 10,000,000 W
Suggested Purchase
Amount 4,533,780 W
Number of stocks
purchased 15
Indication price Range Buying / Selling Buying / Selling [Stocks]
High price 680,953 W 680,953 W~ ~ 606,559 W 126 % -5,705,995 W All selling
High mid 606,559 W 606,559 W ~ 532,164 W 101 % -4,587,295 W All selling
Mid 532,164 W 532,164 W ~ 457,770 W 77 % -3,468,594 W -7
Low mid 457,770 W 457,770 W ~ 383,375 W 52 % -2,349,893 W -5
low price 383,375 W 383,375 W ~ 0 W 27 % -1,231,192 W -3
Stock price rise
probability score
A Sector 46.1 49.8 46.8 51.8 46.7 46.2
42.4
B Sector 31.7 44.6 45.0 51.8 33.8 40.0
Total average
2020.10.15 2020.11.12 2020.12.10 2021.01.12 2021.02.09 2021.03.12
38.9 47.2 45.9 26.3 40.2 43.1
35 % 7 %
2020.11.12 2020.12.10 2021.01.12 2021.02.09 2021.03.12
Total of
increase rate
Total score
A Sector 8 % -7 % 10 % -11 % -1 %
-4 % 49.0
B Sector 29 % 1 % 13 % -53 % 16 %
Total average 18 % -3 % -75 %
46
50
47
52
47 46
32
45 45
52
34
40
39
47 46
26
40
43
0
10
20
30
40
50
60
2020.10.15 2020.11.12 2020.12.10 2021.01.12 2021.02.09 2021.03.12
Stock price rise probability score
A sector
B sector
Total average
8%
-7%
10%
-11%
-1%
29%
1%
13%
-53%
16%
18%
-3%
-75%
35%
7%
-100%
-80%
-60%
-40%
-20%
0%
20%
40%
60%
2020.11.12 2020.12.10 2021.01.12 2021.02.09 2021.03.12
Increase rate of stock price rise
A sector
B sector
Total average
lotte chemica](data:image/gif;base64,R0lGODlhAQABAIAAAAAAAP///yH5BAEAAAAALAAAAAABAAEAAAIBRAA7)
Recommended
Recommended
More Related Content
What's hot
What's hot (20)
Similar to lotte chemical 011170 Algorithm Investment Report
Similar to lotte chemical 011170 Algorithm Investment Report (20)
More from 알고리즘 기업분석 컨설팅-알기컨,algikeon
More from 알고리즘 기업분석 컨설팅-알기컨,algikeon (20)
Recently uploaded
Recently uploaded (20)
lotte chemical 011170 Algorithm Investment Report
- 1. Performance Analysis of Algorithm (consolidated) 011170 Date Period 3 months 100-m won 2017.12 2018.12 2019.12 Average 2019.12 2020.03 2020.06 2020.09 2020.12 2021.03 IFRS(Con) IFRS(Con) IFRS(Con) IFRS(Con) IFRS(Con) IFRS(Con) IFRS(Con) IFRS(Con) IFRS(Con) IFRS(Con) IFRS(Con) Sales 158,745 160,731 151,235 156,904 36,921 32,756 26,822 30,455 31,620 35,682 31,739 O-profit 29,297 19,462 11,073 19,944 1,423 -860 329 1,938 2,691 5,552 708 N-income 22,846 16,419 7,567 15,611 476 -902 307 1,478 1,296 3,150 340 O-rate 18.5 12.1 7.3 12.6 3.9 -2.6 1.2 6.4 8.5 15.6 2.2 N-rate 14.4 10.2 5.0 9.9 1.3 -2.8 1.1 4.9 4.1 8.8 1.1 ROE 18.6 12.1 5.4 12.0 1.4 -0.6 0.5 1.4 1.3 2.2 0.7 Debt-ratio 59.5 53.6 42.6 51.9 42.6 43.4 37.2 38.2 36.9 35.7 40.4 Quick-ratio 175.8 160.1 198.2 178.0 198.2 188.8 204.9 214.7 222.7 232.3 201.7 reserve-ratio 6,687.7 7,389.5 7,607.5 7,228.2 7,607.5 7,422.8 7,432.9 7,520.2 7,492.3 7,464.6 7,495.8 EPS 66,655 47,904 22,077 45,545 1,389 -2,632 896 4,312 3,499 10,253 991 BPS 357,542 395,164 410,008 387,571 410,008 407,727 406,411 407,569 406,762 405,956 407,929 Dividends 10,500 10,500 6,700 9,233 2021-03-15 Major Financial Information Recent Annual Performance Recent quarterly performance Estimate Average Gap (Indication / stock) Color High price ~ 126 % High mid ~ 101 % Mid ~ 77 % Low mid ~ 52 % Low price ~ 27 % Indication price Range Current stock price Company score 606,559 W 606,559 W 532,164 W 532,164 W 532,164 W 457,770 W Evaluation 680,953 W 680,953 W~ 606,559 W 301,500 W 57.0 457,770 W 457,770 W 383,375 W Low price Normal 383,375 W 383,375 W 0 W Industrial name of the company The number of All industries Algorithm Industry ranking Total number of listed companies Algorithm company ranking Investment opinion Chemistry 79 30 3,125 416 383,375원 457,770원 532,164원 606,559원 680,953원 Low price 301,500원 27.2% 51.8% 76.5% 101.2% 125.9% 0.% 20.% 40.% 60.% 80.% 100.% 120.% 140.% 0W 100,000W 200,000W 300,000W 400,000W 500,000W 600,000W 700,000W 800,000W Low price Low mid Mid High mid High price Indication price chart (Consolidated) Indication price lotte chemica Gap lotte chemica
- 2. [Price for scheduled purchasing] Arbitrarily made Algorithm stocks Trading Strategies (consolidated) 011170 Date Period Gap (Indication / stock) Color 2021-03-15 3 months Current stock price Evaluation Stock price rise probability score Investment opinion Prospective purchase amount 301,500 W Low price 42.4 Normal 10,000,000 W Suggested Purchase Amount 4,533,780 W Number of stocks purchased 15 Indication price Range Buying / Selling Buying / Selling [Stocks] High price 680,953 W 680,953 W~ ~ 606,559 W 126 % -5,705,995 W All selling High mid 606,559 W 606,559 W ~ 532,164 W 101 % -4,587,295 W All selling Mid 532,164 W 532,164 W ~ 457,770 W 77 % -3,468,594 W -7 Low mid 457,770 W 457,770 W ~ 383,375 W 52 % -2,349,893 W -5 low price 383,375 W 383,375 W ~ 0 W 27 % -1,231,192 W -3 Stock price rise probability score A Sector 46.1 49.8 46.8 51.8 46.7 46.2 42.4 B Sector 31.7 44.6 45.0 51.8 33.8 40.0 Total average 2020.10.15 2020.11.12 2020.12.10 2021.01.12 2021.02.09 2021.03.12 38.9 47.2 45.9 26.3 40.2 43.1 35 % 7 % 2020.11.12 2020.12.10 2021.01.12 2021.02.09 2021.03.12 Total of increase rate Total score A Sector 8 % -7 % 10 % -11 % -1 % -4 % 49.0 B Sector 29 % 1 % 13 % -53 % 16 % Total average 18 % -3 % -75 % 46 50 47 52 47 46 32 45 45 52 34 40 39 47 46 26 40 43 0 10 20 30 40 50 60 2020.10.15 2020.11.12 2020.12.10 2021.01.12 2021.02.09 2021.03.12 Stock price rise probability score A sector B sector Total average 8% -7% 10% -11% -1% 29% 1% 13% -53% 16% 18% -3% -75% 35% 7% -100% -80% -60% -40% -20% 0% 20% 40% 60% 2020.11.12 2020.12.10 2021.01.12 2021.02.09 2021.03.12 Increase rate of stock price rise A sector B sector Total average lotte chemica
- 3. 정보와 완전 정보 결 투자판단 있습니 위배 무단으 숙지하 Compliance notice ① The information provided by The Algorithm Company Analysis Consulting is obtained through reliable data and information and The Algorithm Company Analysis Program (TACAP), but its accuracy or completeness are not guaranteed. Furthermore, it may change over time.Therefore, we are not legally responsible for the results of the data provided by The Algorithm Company Analysis Consulting because of information errors or omissions. ② The Algorithm Company Analysis Consulting and all the information provided on it site are reference materials for investment decisions and the final responsibility of investment is up to users utilizing this information. ③ The Algorithm Company Analysis Consulting and its site do not do anything that violates the related laws such as discretionary transaction. ④ Users can not reallocate and recycle the information provided by The Algorithm Company Analysis Consulting firm let alone the information provided by its Site. ⑤ Be sure to know about application period of this algorithm analysis report in order to improve its accuracy. Tel : 070 - 4667 - 5009 Email : tacac@tacac.co.kr Homepage : tacac.co.kr Blog : tacac.blog.me SERVICES M&A, IPO, RECOVER, CORPORATE RESTRUCTURING, MANAGEMENT OF TECHNOLOGY, BUSINESS STRATEGY, FAMILY BUSINESS Request : http://tacac.co.kr/?page_id=1374 ① Consulting is o The Algorithm accuracy or com change over tim results of the d Consulting bec ② information pr investment dec up ③ do anything th transaction. ④ The Algorithm information pr ⑤ analysis report