cho heung 002600 Algorithm Investment Report
•
0 likes•131 views

cho heung 002600 Algorithm Investment Report
![[Price for scheduled purchasing]
Arbitrarily made
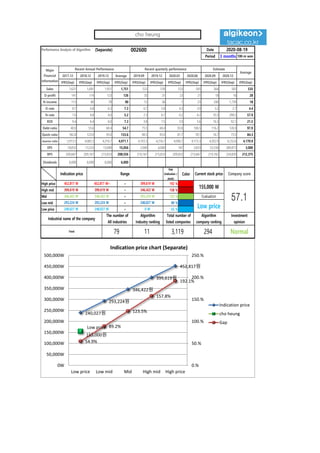
Algorithm stocks Trading Strategies (Separate) 002600 Date
Period
Gap
(Indication /
stock)
Color
low price 240,027 W 240,027 W ~ 0 W 55 % -3,056,291 W -13
Low mid 293,224 W 293,224 W ~ 240,027 W 89 % -4,968,483 W -17
Mid 346,422 W 346,422 W ~ 293,224 W 123 % -6,880,675 W All selling
High mid 399,619 W 399,619 W ~ 346,422 W 158 % -8,792,867 W All selling
Suggested Purchase
Amount 5,571,498 W
Number of stocks
purchased 36
Indication price Range Buying / Selling Buying / Selling [Stocks]
High price 452,817 W 452,817 W~ ~ 399,619 W 192 % -10,705,059 W All selling
2020-08-19
3 months
Current stock price Evaluation
Stock price rise
probability score
Investment opinion Prospective purchase amount
155,000 W Low price 64.1 Normal 10,000,000 W
Stock price rise
probability score
A Sector 62.3 52.9 42.7 51.3 46.9 57.8
64.1B Sector 22.5 37.8 51.3 51.3 22.1 58.3
Total average 42.4 45.4 40.8 57.8 34.5 58.1
2020.03.24 2020.04.22 2020.05.25 2020.06.22 2020.07.20 2020.08.18
2020.05.25 2020.06.22 2020.07.20 2020.08.18
Total of
increase rate
Total score
A Sector -18 % -24 % 17 % -9 % 19 %
-0 % 51.7B Sector 40 % 3 % 24 % -132 % 62 %
Total average 7 % -11 % 29 % -67 % 41 %
2020.04.22
-18% -24%
17%
-9%
19%
40%
3%
24%
-132%
62%
7%
-11%
29%
-67%
41%
-150%
-100%
-50%
0%
50%
100%
2020.04.22 2020.05.25 2020.06.22 2020.07.20 2020.08.18
Increase rate of stock price rise
A sector
B sector
Total average
cho heung
62
53
43
51
47
58
23
38 39
51
22
58
42 45
41
58
35
58
0
10
20
30
40
50
60
70
2020.03.24 2020.04.22 2020.05.25 2020.06.22 2020.07.20 2020.08.18
Stock price rise probability score
A sector
B sector
Total average](data:image/gif;base64,R0lGODlhAQABAIAAAAAAAP///yH5BAEAAAAALAAAAAABAAEAAAIBRAA7)
Recommended
Recommended
More Related Content
What's hot
What's hot (20)
Similar to cho heung 002600 Algorithm Investment Report
Similar to cho heung 002600 Algorithm Investment Report (20)
More from 알고리즘 기업분석 컨설팅-알기컨,algikeon
More from 알고리즘 기업분석 컨설팅-알기컨,algikeon (20)
Recently uploaded
Recently uploaded (20)
cho heung 002600 Algorithm Investment Report
- 1. Performance Analysis of Algorithm (Separate) 002600 Date Period 3 months 100-m won 2017.12 2018.12 2019.12 Average 2019.09 2019.12 2020.03 2020.06 2020.09 2020.12 IFRS(Sep) IFRS(Sep) IFRS(Sep) IFRS(Sep) IFRS(Sep) IFRS(Sep) IFRS(Sep) IFRS(Sep) IFRS(Sep) IFRS(Sep) IFRS(Sep) Sales 1,621 1,681 1,951 1,751 523 539 533 545 564 583 535 O-profit 141 114 123 126 35 31 23 21 18 16 28 N-income 113 80 78 90 12 36 1 23 200 1,739 18 O-rate 8.7 6.8 6.3 7.3 6.7 5.8 4.3 3.9 3.2 2.7 4.4 N-rate 7.0 4.8 4.0 5.2 2.3 6.7 0.2 4.2 35.5 298.5 57.9 ROE 9.4 6.4 6.0 7.3 3.8 7.5 3.9 5.6 16.3 92.1 21.5 Debt-ratio 40.0 55.6 68.4 54.7 75.5 68.4 93.8 106.5 116.2 126.9 97.9 Quick-ratio 182.8 123.0 95.0 133.6 98.5 95.0 81.7 78.1 76.7 75.5 84.3 reserve-ratio 3,913.3 4,083.3 4,216.7 4,071.1 4,103.3 4,216.7 4,096.7 4,173.3 4,202.9 4,232.6 4,170.9 EPS 18,833 13,333 13,000 15,056 2,000 6,000 167 3,833 33,334 289,873 3,000 BPS 200,667 209,167 215,833 208,556 210,167 215,833 209,833 213,667 219,182 224,839 212,375 Dividends 6,000 6,000 6,000 6,000 2020-08-19 Major Financial Information Recent Annual Performance Recent quarterly performance Estimate Average Gap (Indication / stock) Color High price ~ 192 % High mid ~ 158 % Mid ~ 123 % Low mid ~ 89 % Low price ~ 55 % Normal 240,027 W 240,027 W 0 W Industrial name of the company The number of All industries Algorithm Industry ranking Total number of listed companies Algorithm company ranking Investment opinion Food 79 11 3,119 294 399,619 W 399,619 W 346,422 W 346,422 W 346,422 W 293,224 W Evaluation 452,817 W 452,817 W~ 399,619 W 155,000 W 57.1293,224 W 293,224 W 240,027 W Low price Indication price Range Current stock price Company score 240,027원 293,224원 346,422원 399,619원 452,817원 Low price 155,000원 54.9% 89.2% 123.5% 157.8% 192.1% 0.% 50.% 100.% 150.% 200.% 250.% 0W 50,000W 100,000W 150,000W 200,000W 250,000W 300,000W 350,000W 400,000W 450,000W 500,000W Low price Low mid Mid High mid High price Indication price chart (Separate) Indication price cho heung Gap cho heung
- 2. [Price for scheduled purchasing] Arbitrarily made Algorithm stocks Trading Strategies (Separate) 002600 Date Period Gap (Indication / stock) Color low price 240,027 W 240,027 W ~ 0 W 55 % -3,056,291 W -13 Low mid 293,224 W 293,224 W ~ 240,027 W 89 % -4,968,483 W -17 Mid 346,422 W 346,422 W ~ 293,224 W 123 % -6,880,675 W All selling High mid 399,619 W 399,619 W ~ 346,422 W 158 % -8,792,867 W All selling Suggested Purchase Amount 5,571,498 W Number of stocks purchased 36 Indication price Range Buying / Selling Buying / Selling [Stocks] High price 452,817 W 452,817 W~ ~ 399,619 W 192 % -10,705,059 W All selling 2020-08-19 3 months Current stock price Evaluation Stock price rise probability score Investment opinion Prospective purchase amount 155,000 W Low price 64.1 Normal 10,000,000 W Stock price rise probability score A Sector 62.3 52.9 42.7 51.3 46.9 57.8 64.1B Sector 22.5 37.8 51.3 51.3 22.1 58.3 Total average 42.4 45.4 40.8 57.8 34.5 58.1 2020.03.24 2020.04.22 2020.05.25 2020.06.22 2020.07.20 2020.08.18 2020.05.25 2020.06.22 2020.07.20 2020.08.18 Total of increase rate Total score A Sector -18 % -24 % 17 % -9 % 19 % -0 % 51.7B Sector 40 % 3 % 24 % -132 % 62 % Total average 7 % -11 % 29 % -67 % 41 % 2020.04.22 -18% -24% 17% -9% 19% 40% 3% 24% -132% 62% 7% -11% 29% -67% 41% -150% -100% -50% 0% 50% 100% 2020.04.22 2020.05.25 2020.06.22 2020.07.20 2020.08.18 Increase rate of stock price rise A sector B sector Total average cho heung 62 53 43 51 47 58 23 38 39 51 22 58 42 45 41 58 35 58 0 10 20 30 40 50 60 70 2020.03.24 2020.04.22 2020.05.25 2020.06.22 2020.07.20 2020.08.18 Stock price rise probability score A sector B sector Total average
- 3. may ded by Compliance notice ① The information provided by The Algorithm Company Analysis Consulting is obtained through reliable data and information and The Algorithm Company Analysis Program (TACAP), but its accuracy or completeness are not guaranteed. Furthermore, it may change over time.Therefore, we are not legally responsible for the results of the data provided by The Algorithm Company Analysis Consulting because of information errors or omissions. ② The Algorithm Company Analysis Consulting and all the information provided on it site are reference materials for investment decisions and the final responsibility of investment is up to users utilizing this information. ③ The Algorithm Company Analysis Consulting and its site do not do anything that violates the related laws such as discretionary transaction. ④ Users can not reallocate and recycle the information provided by The Algorithm Company Analysis Consulting firm let alone the information provided by its Site. ⑤ Be sure to know about application period of this algorithm analysis report in order to improve its accuracy. Tel : 070 - 4667 - 5009 Email : tacac@tacac.co.kr Homepage : tacac.co.kr Blog : tacac.blog.me SERVICES M&A, IPO, RECOVER, CORPORATE RESTRUCTURING, MANAGEMENT OF TECHNOLOGY, BUSINESS STRATEGY, FAMILY BUSINESS Request : http://tacac.co.kr/?page_id=1374