green cross labsell 144510 Algorithm Investment Report
•
1 like•157 views

green cross labsell 144510 Algorithm Investment Report
![[Price for scheduled purchasing]
Arbitrarily made
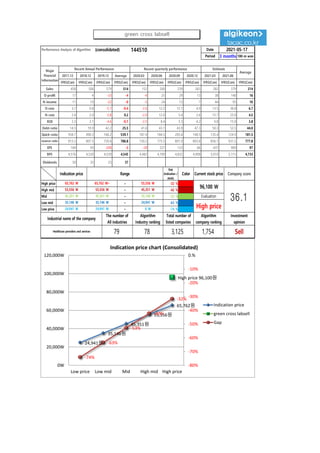
Algorithm stocks Trading Strategies (consolidated) 144510 Date
Period
Gap
(Indication /
stock)
Color
low price 24,941 W 24,941 W ~ 0 W -74 % 141,900 W 6
Low mid 35,146 W 35,146 W ~ 24,941 W -63 % 121,550 W 3
Mid 45,351 W 45,351 W ~ 35,146 W -53 % 101,199 W 2
High mid 55,556 W 55,556 W ~ 45,351 W -42 % 80,849 W 1
Suggested Purchase
Amount 191,636 W
Number of stocks
purchased 2
Indication price Range Buying / Selling Buying / Selling [Stocks]
High price 65,762 W 65,762 W~ ~ 55,556 W -32 % 60,499 W 1
2021-05-17
3 months
Current stock price Evaluation
Stock price rise
probability score
Investment opinion Prospective purchase amount
96,100 W High price 29.6 Sell 1,500,000 W
40.9 41.9 31.5 51.7 34.1 38.0
2020.12.16 2021.01.18 2021.02.17 2021.03.18 2021.04.15 2021.05.14
Stock price rise
probability score
A Sector 49.6 46.8 41.7 49.1 46.1 49.3
29.6
B Sector 32.1 37.1 21.3 49.1 22.1 26.7
Total average
2021.02.17 2021.03.18 2021.04.15 2021.05.14
Total of
increase rate
Total score
A Sector -6 % -12 % 15 % -6 % 6 %
-7 % 44.3
B Sector 13 % -75 % 57 % -122 % 17 %
Total average 3 % -33 % 39 % -51 % 10 %
2021.01.18
50
47
42
49
46
49
32
37
21
49
22
27
41 42
31
52
34
38
0
10
20
30
40
50
60
2020.12.16 2021.01.18 2021.02.17 2021.03.18 2021.04.15 2021.05.14
Stock price rise probability score
A sector
B sector
Total average
-6% -12%
15%
-6%
6%
13%
-75%
57%
-122%
17%
3%
-33%
39%
-51%
10%
-150%
-100%
-50%
0%
50%
100%
2021.01.18 2021.02.17 2021.03.18 2021.04.15 2021.05.14
Increase rate of stock price rise
A sector
B sector
Total average
green cross labsell](data:image/gif;base64,R0lGODlhAQABAIAAAAAAAP///yH5BAEAAAAALAAAAAABAAEAAAIBRAA7)
Recommended
Recommended
More Related Content
What's hot
What's hot (20)
Similar to green cross labsell 144510 Algorithm Investment Report
Similar to green cross labsell 144510 Algorithm Investment Report (20)
More from 알고리즘 기업분석 컨설팅-알기컨,algikeon
More from 알고리즘 기업분석 컨설팅-알기컨,algikeon (20)
Recently uploaded
Recently uploaded (20)
green cross labsell 144510 Algorithm Investment Report
- 1. Performance Analysis of Algorithm (consolidated) 144510 Date Period 3 months 100-m won 2017.12 2018.12 2019.12 Average 2020.03 2020.06 2020.09 2020.12 2021.03 2021.06 IFRS(Con) IFRS(Con) IFRS(Con) IFRS(Con) IFRS(Con) IFRS(Con) IFRS(Con) IFRS(Con) IFRS(Con) IFRS(Con) IFRS(Con) Sales 458 506 579 514 152 200 239 265 282 379 214 O-profit 17 4 -33 -4 -4 25 29 13 38 140 16 N-income 11 10 -22 -0 -3 24 13 7 44 95 10 O-rate 3.7 0.8 -5.7 -0.4 -2.6 12.5 12.1 4.9 13.5 36.8 6.7 N-rate 2.4 2.0 -3.8 0.2 -2.0 12.0 5.4 2.6 15.7 25.0 4.5 ROE 2.3 2.1 -4.6 -0.1 -2.5 8.4 5.3 4.2 9.8 15.9 3.8 Debt-ratio 14.5 19.9 42.2 25.5 41.6 43.1 43.9 47.3 50.3 53.5 44.0 Quick-ratio 958.7 490.3 168.2 539.1 187.4 184.5 205.6 148.5 135.4 124.9 181.5 reserve-ratio 813.2 807.5 739.6 786.8 730.2 775.5 801.9 803.8 856.1 931.5 777.8 EPS 104 95 -208 -3 -28 227 123 66 437 900 97 BPS 4,576 4,520 4,539 4,545 4,482 4,709 4,832 4,908 5,010 5,115 4,733 Dividends 50 35 25 37 Major Financial Information Recent Annual Performance Recent quarterly performance Estimate Average 2021-05-17 Gap (Indication / stock) Color High price ~ -32 % High mid ~ -42 % Mid ~ -53 % Low mid ~ -63 % Low price ~ -74 % Sell 24,941 W 24,941 W 0 W Industrial name of the company The number of All industries Algorithm Industry ranking Total number of listed companies Algorithm company ranking Investment opinion Healthcare providers and services 79 78 3,125 1,754 55,556 W 55,556 W 45,351 W 45,351 W 45,351 W 35,146 W Evaluation 65,762 W 65,762 W~ 55,556 W 96,100 W 36.1 35,146 W 35,146 W 24,941 W High price Indication price Range Current stock price Company score 24,941원 35,146원 45,351원 55,556원 65,762원 High price 96,100원 -74% -63% -53% -42% -32% -80% -70% -60% -50% -40% -30% -20% -10% 0.% 0W 20,000W 40,000W 60,000W 80,000W 100,000W 120,000W Low price Low mid Mid High mid High price Indication price chart (Consolidated) Indication price green cross labsell Gap green cross labsell
- 2. [Price for scheduled purchasing] Arbitrarily made Algorithm stocks Trading Strategies (consolidated) 144510 Date Period Gap (Indication / stock) Color low price 24,941 W 24,941 W ~ 0 W -74 % 141,900 W 6 Low mid 35,146 W 35,146 W ~ 24,941 W -63 % 121,550 W 3 Mid 45,351 W 45,351 W ~ 35,146 W -53 % 101,199 W 2 High mid 55,556 W 55,556 W ~ 45,351 W -42 % 80,849 W 1 Suggested Purchase Amount 191,636 W Number of stocks purchased 2 Indication price Range Buying / Selling Buying / Selling [Stocks] High price 65,762 W 65,762 W~ ~ 55,556 W -32 % 60,499 W 1 2021-05-17 3 months Current stock price Evaluation Stock price rise probability score Investment opinion Prospective purchase amount 96,100 W High price 29.6 Sell 1,500,000 W 40.9 41.9 31.5 51.7 34.1 38.0 2020.12.16 2021.01.18 2021.02.17 2021.03.18 2021.04.15 2021.05.14 Stock price rise probability score A Sector 49.6 46.8 41.7 49.1 46.1 49.3 29.6 B Sector 32.1 37.1 21.3 49.1 22.1 26.7 Total average 2021.02.17 2021.03.18 2021.04.15 2021.05.14 Total of increase rate Total score A Sector -6 % -12 % 15 % -6 % 6 % -7 % 44.3 B Sector 13 % -75 % 57 % -122 % 17 % Total average 3 % -33 % 39 % -51 % 10 % 2021.01.18 50 47 42 49 46 49 32 37 21 49 22 27 41 42 31 52 34 38 0 10 20 30 40 50 60 2020.12.16 2021.01.18 2021.02.17 2021.03.18 2021.04.15 2021.05.14 Stock price rise probability score A sector B sector Total average -6% -12% 15% -6% 6% 13% -75% 57% -122% 17% 3% -33% 39% -51% 10% -150% -100% -50% 0% 50% 100% 2021.01.18 2021.02.17 2021.03.18 2021.04.15 2021.05.14 Increase rate of stock price rise A sector B sector Total average green cross labsell
- 3. 정보와 완전 정보 결 투자판단 있습니 위배 무단으 숙지하 Compliance notice ① The information provided by The Algorithm Company Analysis Consulting is obtained through reliable data and information and The Algorithm Company Analysis Program (TACAP), but its accuracy or completeness are not guaranteed. Furthermore, it may change over time.Therefore, we are not legally responsible for the results of the data provided by The Algorithm Company Analysis Consulting because of information errors or omissions. ② The Algorithm Company Analysis Consulting and all the information provided on it site are reference materials for investment decisions and the final responsibility of investment is up to users utilizing this information. ③ The Algorithm Company Analysis Consulting and its site do not do anything that violates the related laws such as discretionary transaction. ④ Users can not reallocate and recycle the information provided by The Algorithm Company Analysis Consulting firm let alone the information provided by its Site. ⑤ Be sure to know about application period of this algorithm analysis report in order to improve its accuracy. Tel : 070 - 4667 - 5009 Email : tacac@tacac.co.kr Homepage : tacac.co.kr Blog : tacac.blog.me SERVICES M&A, IPO, RECOVER, CORPORATE RESTRUCTURING, MANAGEMENT OF TECHNOLOGY, BUSINESS STRATEGY, FAMILY BUSINESS Request : http://tacac.co.kr/?page_id=1374 ① Consulting is o The Algorithm accuracy or com change over tim results of the d Consulting bec ② information pr investment dec up ③ do anything th transaction. ④ The Algorithm information pr ⑤ analysis report