sajo industrial 007160 Algorithm Investment Report
•
0 likes•56 views

sajo industrial 007160 Algorithm Investment Report
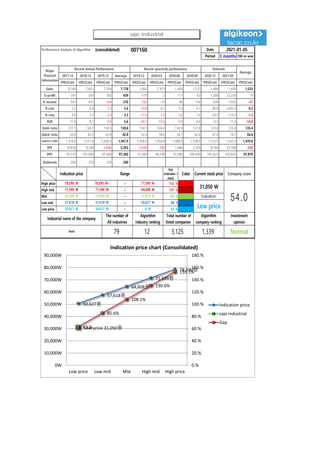
![[Price for scheduled purchasing]
Arbitrarily made
Algorithm stocks Trading Strategies (consolidated) 007160 Date
Period
Gap
(Indication /
stock)
Color
2021-01-05
3 months
Current stock price Evaluation
Stock price rise
probability score
Investment opinion Prospective purchase amount
31,050 W Low price 58.6 Normal 8,800,000 W
Suggested Purchase
Amount 3,997,895 W
Number of stocks
purchased 129
Indication price Range Buying / Selling Buying / Selling [Stocks]
High price 78,590 W 78,590 W~ ~ 71,599 W 153 % -6,121,124 W All selling
High mid 71,599 W 71,599 W ~ 64,608 W 131 % -5,220,999 W All selling
Mid 64,608 W 64,608 W ~ 57,618 W 108 % -4,320,874 W All selling
Low mid 57,618 W 57,618 W ~ 50,627 W 86 % -3,420,749 W -59
low price 50,627 W 50,627 W ~ 0 W 63 % -2,520,624 W -50
Stock price rise
probability score
A Sector 47.0 52.9 48.6 48.1 45.4 47.5
58.6B Sector 20.4 27.9 34.6 48.1 48.8 34.6
Total average
2020.08.05 2020.09.03 2020.10.06 2020.11.04 2020.12.02 2021.01.04
33.7 40.4 41.6 48.8 47.1 41.1
-4 % -15 %
2020.09.03 2020.10.06 2020.11.04 2020.12.02 2021.01.04
Total of
increase rate
Total score
A Sector 11 % -9 % -1 % -6 % 5 %
3 % 51.0B Sector 27 % 19 % 28 % 1 % -41 %
Total average 17 % 3 % 15 %
47
53
49 48
45 48
20
28
35
48 49
3534
40 42
49 47
41
0
10
20
30
40
50
60
2020.08.05 2020.09.03 2020.10.06 2020.11.04 2020.12.02 2021.01.04
Stock price rise probability score
A sector
B sector
Total average
11%
-9%
-1%
-6%
5%
27%
19%
28%
1%
-41%
17%
3%
15%
-4%
-15%
-50%
-40%
-30%
-20%
-10%
0%
10%
20%
30%
40%
2020.09.03 2020.10.06 2020.11.04 2020.12.02 2021.01.04
Increase rate of stock price rise
A sector
B sector
Total average
sajo industrial](data:image/gif;base64,R0lGODlhAQABAIAAAAAAAP///yH5BAEAAAAALAAAAAABAAEAAAIBRAA7)
Recommended
Recommended
More Related Content
What's hot
What's hot (20)
Similar to sajo industrial 007160 Algorithm Investment Report
Similar to sajo industrial 007160 Algorithm Investment Report (20)
More from 알고리즘 기업분석 컨설팅-알기컨,algikeon
More from 알고리즘 기업분석 컨설팅-알기컨,algikeon (20)
Recently uploaded
Recently uploaded (20)
sajo industrial 007160 Algorithm Investment Report
- 1. Performance Analysis of Algorithm (consolidated) 007160 Date Period 3 months 100-m won 2017.12 2018.12 2019.12 Average 2019.12 2020.03 2020.06 2020.09 2020.12 2021.03 IFRS(Con) IFRS(Con) IFRS(Con) IFRS(Con) IFRS(Con) IFRS(Con) IFRS(Con) IFRS(Con) IFRS(Con) IFRS(Con) IFRS(Con) Sales 8,160 7,821 7,354 7,778 1,662 1,413 1,495 1,523 1,486 1,450 1,523 O-profit 591 543 182 439 -179 2 111 62 1,200 23,230 -1 N-income 541 412 -144 270 -292 -14 84 116 438 1,655 -27 O-rate 7.2 6.9 2.5 5.6 -10.8 0.1 7.4 4.1 80.8 1,602.4 0.2 N-rate 6.6 5.3 -2.0 3.3 -17.6 -1.0 5.6 7.6 29.5 114.2 -1.3 ROE 11.6 8.1 -3.0 5.6 -24.1 -12.6 -9.9 -9.4 -4.3 11.4 -14.0 Debt-ratio 127.1 130.7 134.5 130.8 134.5 144.4 134.9 127.8 125.8 123.8 135.4 Quick-ratio 33.4 42.5 52.4 42.8 52.4 56.0 56.1 62.0 67.6 74.1 56.6 reserve-ratio 1,376.0 1,511.6 1,456.0 1,447.9 1,456.0 1,450.8 1,468.8 1,508.0 1,525.9 1,543.9 1,470.9 EPS 10,820 8,240 -2,880 5,393 -5,840 -280 1,680 2,320 8,764 33,108 -530 BPS 93,120 101,960 97,000 97,360 97,000 96,140 97,900 100,440 101,625 102,823 97,870 Dividends 200 250 150 200 2021-01-05 Major Financial Information Recent Annual Performance Recent quarterly performance Estimate Average Gap (Indication / stock) Color High price ~ 153 % High mid ~ 131 % Mid ~ 108 % Low mid ~ 86 % Low price ~ 63 % Indication price Range Current stock price Company score 71,599 W 71,599 W 64,608 W 64,608 W 64,608 W 57,618 W Evaluation 78,590 W 78,590 W~ 71,599 W 31,050 W 54.057,618 W 57,618 W 50,627 W Low price Normal 50,627 W 50,627 W 0 W Industrial name of the company The number of All industries Algorithm Industry ranking Total number of listed companies Algorithm company ranking Investment opinion Food 79 12 3,125 1,339 50,627원 57,618원 64,608원 71,599원 78,590원 Low price 31,050원63.% 85.6% 108.1% 130.6% 153.1% 0.% 20.% 40.% 60.% 80.% 100.% 120.% 140.% 160.% 180.% 0W 10,000W 20,000W 30,000W 40,000W 50,000W 60,000W 70,000W 80,000W 90,000W Low price Low mid Mid High mid High price Indication price chart (Consolidated) Indication price sajo industrial Gap sajo industrial
- 2. [Price for scheduled purchasing] Arbitrarily made Algorithm stocks Trading Strategies (consolidated) 007160 Date Period Gap (Indication / stock) Color 2021-01-05 3 months Current stock price Evaluation Stock price rise probability score Investment opinion Prospective purchase amount 31,050 W Low price 58.6 Normal 8,800,000 W Suggested Purchase Amount 3,997,895 W Number of stocks purchased 129 Indication price Range Buying / Selling Buying / Selling [Stocks] High price 78,590 W 78,590 W~ ~ 71,599 W 153 % -6,121,124 W All selling High mid 71,599 W 71,599 W ~ 64,608 W 131 % -5,220,999 W All selling Mid 64,608 W 64,608 W ~ 57,618 W 108 % -4,320,874 W All selling Low mid 57,618 W 57,618 W ~ 50,627 W 86 % -3,420,749 W -59 low price 50,627 W 50,627 W ~ 0 W 63 % -2,520,624 W -50 Stock price rise probability score A Sector 47.0 52.9 48.6 48.1 45.4 47.5 58.6B Sector 20.4 27.9 34.6 48.1 48.8 34.6 Total average 2020.08.05 2020.09.03 2020.10.06 2020.11.04 2020.12.02 2021.01.04 33.7 40.4 41.6 48.8 47.1 41.1 -4 % -15 % 2020.09.03 2020.10.06 2020.11.04 2020.12.02 2021.01.04 Total of increase rate Total score A Sector 11 % -9 % -1 % -6 % 5 % 3 % 51.0B Sector 27 % 19 % 28 % 1 % -41 % Total average 17 % 3 % 15 % 47 53 49 48 45 48 20 28 35 48 49 3534 40 42 49 47 41 0 10 20 30 40 50 60 2020.08.05 2020.09.03 2020.10.06 2020.11.04 2020.12.02 2021.01.04 Stock price rise probability score A sector B sector Total average 11% -9% -1% -6% 5% 27% 19% 28% 1% -41% 17% 3% 15% -4% -15% -50% -40% -30% -20% -10% 0% 10% 20% 30% 40% 2020.09.03 2020.10.06 2020.11.04 2020.12.02 2021.01.04 Increase rate of stock price rise A sector B sector Total average sajo industrial
- 3. 정보와 완전 정보 결 투자판단 있습니 위배 무단으 숙지하 Compliance notice ① The information provided by The Algorithm Company Analysis Consulting is obtained through reliable data and information and The Algorithm Company Analysis Program (TACAP), but its accuracy or completeness are not guaranteed. Furthermore, it may change over time.Therefore, we are not legally responsible for the results of the data provided by The Algorithm Company Analysis Consulting because of information errors or omissions. ② The Algorithm Company Analysis Consulting and all the information provided on it site are reference materials for investment decisions and the final responsibility of investment is up to users utilizing this information. ③ The Algorithm Company Analysis Consulting and its site do not do anything that violates the related laws such as discretionary transaction. ④ Users can not reallocate and recycle the information provided by The Algorithm Company Analysis Consulting firm let alone the information provided by its Site. ⑤ Be sure to know about application period of this algorithm analysis report in order to improve its accuracy. Tel : 070 - 4667 - 5009 Email : tacac@tacac.co.kr Homepage : tacac.co.kr Blog : tacac.blog.me SERVICES M&A, IPO, RECOVER, CORPORATE RESTRUCTURING, MANAGEMENT OF TECHNOLOGY, BUSINESS STRATEGY, FAMILY BUSINESS Request : http://tacac.co.kr/?page_id=1374 ① Consulting is o The Algorithm accuracy or com change over tim results of the d Consulting bec ② information pr investment dec up ③ do anything th transaction. ④ The Algorithm information pr ⑤ analysis report