SlideShare a Scribd company logo
1 of 10
Download to read offline
Ashish Chopra (Ashish.Chopra@MotilalOswal.com); +91 22 3982 5424
Siddharth Vora (Siddharth.Vora@MotilalOswal.com); +91 22 3982 5585
13 June 2014
Update | Sector: Technology
TCS
CMP: INR2,215 TP: INR2,200 Neutral
Status quo; on track for revenue acceleration
Margins receding to the targeted band on headwinds
 TCS retained its outlook for FY15 – of a healthy demand environment,
accelerating organic revenue growth in FY15 and with normal seasonality of a
stronger 1H v/s 2H. We estimate 5.5% QoQ growth USD3.7b in 1QFY15E. (50bp
impact from cross currency)
 1Q traction will be driven by larger verticals which will grow close to company
average while verticals like media and healthcare & life sciences should grow
faster on a small base. India revenues should be flattish, US continues to see
discretionary spend and traditional outsourcing drives Europe.
 Margins will see headwinds of over 300bp QoQ, from wage hikes (over 200bp and
appreciation of INR (~100bp). We expect offset from growth and productivity
gains, and model 160bp QoQ decline to 27.6%.
1QFY15 Expectations: Momentum intact, on track for a better FY15
 TCS’ commentary on the outlook is unchanged – with expectation of better
organic growth in FY15 v/s FY14, and growth in 1H being stronger than that
in 2H
 We expect USD revenue growth to come in at 5.5% for the quarter with cross
currency impact of +50bps. This implies YoY growth of 16.8%, compared to
16% in 1QFY14
 Due to appreciation in INR during the quarter Rupee revenues will have a
negative 300bp impact. This drives our Rupee revenue estimate of
INR220.7b, +2.4% QoQ.
We estimate 1QFY15 USD revenue growth at 5.5%
Source: Company, MOSL
Margin faces headwinds from wage hike and currency
 TCS announced higher wage hikes for FY15, and that is likely to have an
impact of over 200bp QoQ. Currency appreciation introduces additional
100bp headwind for the margins during the quarter.
2,412
2,525
2,586
2,648
2,728
2,853
2,948
3,040
3,165
3,337
3,438
3,503
3,696
7.5%
4.7% 2.4% 2.4% 3.0%
4.6% 3.3% 3.1% 4.1% 5.4%
3.0% 1.9%
5.5%
1QFY12
2QFY12
3QFY12
4QFY12
1QFY13
2QFY13
3QFY13
4QFY13
1QFY14
2QFY14
3QFY14
4QFY14
1QFY15EUSDRevenues QoQ Growth (%)
Investors are advised to refer through disclosures made at the end of the Research Report.
BSE Sensex S&P CNX
25,228 7,542
Stock Info
Bloomberg TCS IN
Equity Shares (m) 1,958.7
52-Week Range (INR) 2,384/1,382
1, 6, 12 Rel. Per (%) -6/-11/19
M.Cap. (INR b) 4,338.0
M.Cap. (USD b) 72.6
Financial Snapshot (INR Billion)
Y/E March 2014 2015E 2016E
Sales 818.1 946.7 1,080.5
EBITDA 251.3 270.6 304.4
PAT 191.2 207.4 237.8
EPS (INR) 97.6 105.9 121.4
EPS Gr. (%) 37.0 8.5 14.7
BV/Sh. (INR) 282.5 326.9 399.1
RoE (%) 39.7 34.8 33.4
P/E (x) 22.7 20.9 18.2
EV/EBITDA (x) 16.5 15.1 13.2
Div. yield (%) 1.4 1.7 1.9
Shareholding pattern (%)
As on Mar-14 Dec-13 Mar-13
Promoter 73.9 73.9 74.0
Dom Inst 5.4 5.3 5.4
Foreign 16.1 16.3 16.1
Others 4.6 4.5 4.5
Stock Performance (1-year)
TCS
13 June 2014 2
 Impact from a high growth rate and contribution from productivity
improvement should help partially offset the impact from headwinds, and we
expect the decline to be limited to 160bp, implying EBIT margin of 27.6% in
1QFY15.
We estimate margins to decline by 160bps to 27.6%
Source: Company, MOSL
 TCS continues to maintain its target band for margins as 26-28% going forward
and may tweak the rate of investments going forward in the event of additional
headwinds like appreciation of INR.
 Our PAT estimate for the quarter stands at INR49.5b, down 6.6%, on account of
appreciation in INR, lower operating margin, and little impact from forex hedges
compared to gains worth INR2b in 4QFY14.
Segmental traction
 Growth will be broad based across verticals with large verticals growing close to
company average and smaller verticals like healthcare & life sciences and media
are expected to grow above company average.
Vertical performance in 4QFY14
Verticals
Contr. to
overall rev (%)
QoQ Gr. (%)
Contr. to incr
rev (%)
4 Quarter
CQGR
BFSI 42.9 2.4 53.5 3.2
Mfg 8.6 (0.4) (2.0) 3.9
Telecom 9.3 (1.3) (6.6) 3.6
LS & Healthcare 6.1 5.3 16.7 8.4
Retail & Distr 13.5 (0.3) (2.4) 3.8
Transportation 3.5 1.9 3.5 4.4
Energy and Utilities 3.8 1.9 3.8 3.6
Media & Entmnt 2.6 15.2 18.5 9.3
Hi-Tech 5.3 1.9 5.3 1.7
Others 4.4 4.3 9.7 (0.6)
Source: MOSL, Company
 In terms of geography, revenue momentum in US continues – with greater
project based or discretionary demand. Europe is seeing sustained momentum
of traditional outsourcing spend picking up. Growth will be driven by developed
geographies while India revenues are expected to be flattish during the quarter.
TCS
13 June 2014 3
Geography performance in 4QFY14
Geographies
Contr. to
overall rev (%)
QoQ Gr. (%)
Contr. to incr
rev (%)
4 Quarter
CQGR
North America 52.2 0.9 25.8 3.1
Latin America 2.2 (2.5) (3.1) 1.4
UK 17.8 3.6 33.7 5.1
Continental Europe 12.1 6.3 38.5 10.4
India 6.2 0.3 0.9 (5.1)
APAC 7.4 1.9 7.4 4.0
MEA 2.1 (2.7) (3.2) 3.6
Source: MOSL, Company
 In terms of services, growth continues to be broad-based across the offerings.
TCS’ proprietary cloud offering iON remains work in progress, still small in terms
of revenue size to impact overall company performance,
Change in depreciation policy in line with the revised Companies Act
 To be in accordance with the Companies Act 2013, TCS effected change in its
depreciation policy. The company has taken the opportunity to further
rationalize the policies for depreciation – bringing different policies across
subsidiary companies under one standard.
 TCS will be following straight-line depreciation with lower asset life from the
previously followed WDV method. This will result in: [1] a one-time impact in
Indian GAAP of write back of 4-5% of net Fixed Assets as an exceptional item
and [2] one time impact in IFRS of additional charge of ~2% of Fixed Asset added
to normal depreciation. We will factor the same into our estimates as clarity on
the exact impact of the same emerges in 1QFY 15 financials.
Valuation and view
Our estimates remain largely unchanged after the management’s latest outlook.
Over the past four years, TCS has led the incremental revenues as well as operating
profits not just domestically, but also in the global arena (compared to peers
multiple times its size); and its market cap is second only to IBM. At 18.8% USD
revenue CAGR over FY14-16E, we expect TCS to continue leading the industry
growth with excellent execution. At 20.9x FY15E and 18.2x FY16E EPS, we remain
Neutral on valuations. We would treat any corrections as an entry opportunity.
TCS
13 June 2014 4
Story in charts
TCS continues to lead industry growth…
Source: Company, MOSL
…but India headwinds cripple outperformance
Source: Company, MOSL
Revenue growth finally getting delinked to headcount...
Source: Company, MOSL
...as competitive intensity gradually pulls down pricing
Source: Company, MOSL
Operating at peak efficiency, reflected in utilization...
Source: Company, MOSL
...Expect margins to settle lower and EPS to lag rev. growth
Source: Company, MOSL
TCS
13 June 2014 5
Operating Metrics
1QFY13 2QFY13 3QFY13 4QFY13 1QFY14 2QFY14 3QFY14 4QFY14
Service Lines (%)
ADM 43.4 43.1 42.4 42.4 42.3 41.7 41.4 41.0
Engineering and Industrial Services 4.6 4.6 4.7 4.6 4.7 4.7 4.6 4.8
Infrastructure Services 10.6 11.4 11.7 12.1 11.9 11.8 12.0 12.0
Enterprise Solutions 15.2 14.9 15.1 15.5 15.1 15.4 15.7 15.7
Global Consulting 2.8 3.0 3.2 3.1 3.5 3.3 3.4 3.4
Asset Leverage Solutions 2.8 2.7 2.8 2.5 2.5 2.7 2.3 2.6
Assurance Services 7.6 7.7 7.7 7.8 8.1 8.5 8.5 8.4
BPO 13.0 12.6 12.4 12.0 11.9 11.9 12.1 12.1
Industry Verticals (%)
BFSI 43.0 42.8 43.0 43.5 43.0 43.1 42.7 42.9
Manufacturing 7.9 8.2 8.5 8.5 8.4 8.4 8.8 8.6
Telecom 10.3 10.3 9.5 9.3 9.6 9.3 9.6 9.3
Life Sciences & Healthcare 5.3 5.2 5.2 5.1 5.5 5.7 5.9 6.1
Retail & Distribution 13.2 13.4 13.4 13.4 14.0 13.9 13.8 13.5
Transportation 3.7 3.6 3.6 3.4 3.4 3.4 3.5 3.5
Energy and Utilities 3.6 3.6 3.8 3.8 3.7 3.8 3.8 3.8
Media & Entertainment 2.2 2.2 2.1 2.1 2.1 2.2 2.3 2.6
Hi-Tech 6.0 5.9 5.8 5.7 5.5 5.4 5.3 5.3
Others 4.8 4.8 5.1 5.2 4.8 4.8 4.3 4.4
Geographies (%)
America 53.5 52.8 52.6 53.2 54.1 53.2 52.7 52.2
UK 17.0 17.1 17.5 16.8 17.0 17.3 17.5 17.8
Rest of Europe 9.6 9.5 9.1 9.4 9.9 11.2 11.6 12.1
Europe 26.6 26.6 26.6 26.2 26.9 28.5 29.1 29.9
India 7.1 7.5 7.6 8.8 7.6 6.9 6.3 6.2
APAC 7.4 7.6 7.5 7.3 6.9 7.1 7.4 7.4
Latin America 3.3 3.4 3.6 2.4 2.4 2.3 2.3 2.2
MEA 2.1 2.1 2.1 2.1 2.1 2.0 2.2 2.1
Others 12.8 13.1 13.2 11.8 11.4 11.4 11.9 11.7
Revenue Mix (%)
Offshore 50.5 49.1 49.4 48.3 48.5 48.1 47.8 47.4
Onsite 44.7 45.8 45.6 46.5 46.3 46.5 46.8 47.0
GDC 4.8 5.1 5.0 5.2 5.2 5.4 5.4 5.6
Utilization
Excluding Trainees 81.3 81.6 81.7 82.0 82.7 83.4 84.3 83.8
Including Trainees 72.3 72.8 72.1 72.2 72.5 75.0 77.5 77.9
Source: MOSL, Company
TCS
13 June 2014 6
Operating Metrics
1QFY13 2QFY13 3QFY13 4QFY13 1QFY14 2QFY14 3QFY14 4QFY14
QoQ growth (%)
Service Lines
ADM 0.7 3.8 1.7 3.1 3.9 3.9 2.3 0.9
Engineering and Industrial Services 3.0 4.6 5.6 0.9 6.4 5.4 0.8 6.3
Infrastructure Services 5.0 12.5 6.1 6.7 2.4 4.6 4.8 1.9
Enterprise Solutions 3.0 2.5 4.7 5.9 1.4 7.5 5.0 1.9
Global Consulting 6.8 12.0 10.2 -0.1 17.5 -0.6 6.1 1.9
Asset Leverage Solutions -26.0 0.8 7.2 -7.9 4.1 13.9 -12.2 15.2
Assurance Services 7.3 5.9 3.3 4.5 8.1 10.7 3.0 0.7
BPO 16.5 1.3 1.7 -0.2 3.2 5.4 4.8 1.9
Industry Verticals
BFSI 5.0 4.1 3.8 4.3 2.9 5.7 2.1 2.4
Manufacturing 3.0 8.5 7.1 3.1 2.9 5.4 7.9 -0.4
Telecom 6.1 4.6 -4.7 1.0 7.5 2.1 6.4 -1.3
Life Sciences & Healthcare 3.0 2.6 3.3 1.1 12.3 9.3 6.6 5.3
Retail & Distribution 8.8 6.2 3.3 3.1 8.8 4.7 2.3 -0.3
Transportation 3.0 1.7 3.3 -2.6 4.1 5.4 6.1 1.9
Energy and Utilities -2.4 4.6 9.1 3.1 1.4 8.3 3.0 1.9
Media & Entertainment 3.0 4.6 -1.4 3.1 4.1 10.5 7.7 15.2
Hi-Tech 3.0 2.8 1.6 1.3 0.4 3.5 1.1 1.9
Others -22.7 4.6 9.8 5.1 -3.9 5.4 -7.7 4.3
Geographies
America 2.8 3.2 2.9 4.3 5.9 3.7 2.1 0.9
UK 15.2 5.2 5.8 -1.0 5.3 7.3 4.2 3.6
Rest of Europe 0.9 3.5 -1.0 6.5 9.6 19.3 6.7 6.3
Europe 9.6 4.6 3.3 1.6 6.9 11.7 5.2 4.7
India -13.9 10.5 4.7 19.4 -10.1 -4.3 -5.9 0.3
APAC -1.0 7.4 2.0 0.4 -1.6 8.5 7.4 1.9
Latin America 9.7 7.7 9.4 -31.2 4.1 1.1 3.0 -2.5
MEA 3.0 4.6 3.3 3.1 4.1 0.4 13.3 -2.7
Others 2.2 7.0 4.1 -7.8 0.6 5.4 7.5 0.2
Offshore 5.0 1.2 3.9 -0.5 5.9 5.4 3.0 1.1
Onsite 3.4 6.7 2.8 3.8 5.0 6.7 4.4 2.4
GDC 11.6 10.6 1.2 5.8 5.5 10.3 3.7 5.8
Overall International business 4.6 4.1 3.2 1.8 5.5 6.3 3.7 2.0
Domestic Business -13.9 10.5 4.6 19.6 -10.1 -4.4 -5.8 0.4
Source: MOSL, Company
TCS
13 June 2014 7
Financials and valuations
Income statement (INR Million)
Y/E March 2011 2012 2013 2014 2015E 2016E
Sales 373,245 488,938 629,895 818,094 946,723 1,080,484
Change (%) 24.3 31.0 28.8 29.9 15.7 14.1
Cost of Services 198,505 258,773 332,545 422,065 513,543 598,835
SG&A Expenses 62,848 85,988 116,480 144,707 162,539 177,260
EBITDA 111,892 144,177 180,870 251,322 270,642 304,388
% of Net Sales 30.0 29.5 28.7 30.7 28.6 28.2
Depreciation 7,990 9,036 10,792 13,243 15,206 17,242
Other Income 5,247 4,041 11,174 15,891 20,203 28,504
PBT 109,149 139,182 181,252 253,969 275,639 315,650
Tax 21,203 31,688 40,344 60,712 66,153 75,756
Rate (%) 19.4 22.8 22.3 23.9 24.0 24.0
Minority Interest 1,116 1,110 1,494 2,089 2,080 2,080
PAT 86,827 106,384 139,413 191,168 207,406 237,814
Change (%) 26.3 22.5 31.0 37.1 8.5 14.7
Balance sheet (INR Million)
Y/E March 2011 2012 2013 2014 2015E 2016E
Share Capital 1,957 1,957 1,957 1,959 1,959 1,959
Reserves 250,432 323,276 407,524 551,393 638,273 779,840
Net Worth 252,389 325,233 409,481 553,352 640,232 781,798
Preference shares 1,000 1,000 1,000 0 0 0
Minority Interest 4,663 5,276 6,561 6,905 6,905 6,905
Loans 10,718 12,306 10,894 12,561 14,307 16,133
Capital Employed 268,771 343,815 427,936 572,817 661,443 804,836
Gross Block 86,156 107,400 135,587 170,530 204,717 236,907
Less : Depreciation 33,816 42,852 53,644 66,887 82,092 99,334
Net Block 52,340 64,548 81,944 103,644 122,625 137,573
Other LT Assets 89,929 110,269 88,815 118,105 141,657 160,298
Investments 18,390 0 33,765 37,673 37,673 37,673
Curr. Assets 171,948 237,173 315,022 429,703 562,793 689,659
Debtors 95,479 137,469 172,366 222,360 272,704 310,917
Cash & Bank Balance 47,401 34,617 79,035 156,495 231,377 311,803
Other Current Assets 29,068 65,087 63,621 50,848 58,712 66,939
Current Liab. & Prov 63,837 68,175 91,609 116,308 203,305 220,368
Current Liabilities 63,837 68,175 91,609 116,308 203,305 220,368
Net Current Assets 108,111 168,998 223,413 313,395 359,488 469,291
Application of Funds 268,771 343,815 427,936 572,817 661,443 804,836
E: MOSL Estimates
TCS
13 June 2014 8
Financials and valuation
Ratios
Y/E March 2011 2012 2013 2014 2015E 2016E
Basic (INR)
EPS 44.4 54.4 71.2 97.6 105.9 121.4
Cash EPS 48.4 59.0 76.7 104.4 113.7 130.2
Book Value 129.5 166.7 209.7 282.5 326.9 399.1
DPS 14.0 25.0 22.0 32.0 37.0 42.0
Payout % 31.6 46.0 30.9 32.8 34.9 34.6
Valuation (x)
P/E 49.9 40.7 31.1 22.7 20.9 18.2
Cash P/E 45.7 37.6 28.9 21.2 19.5 17.0
EV/EBITDA 38.2 29.9 23.4 16.5 15.1 13.2
EV/Sales 11.5 8.8 6.7 5.1 4.3 3.7
Price/Book Value 17.1 13.3 10.6 7.8 6.8 5.5
Dividend Yield (%) 0.6 1.1 1.0 1.4 1.7 1.9
Profitability Ratios (%)
RoE 37.4 36.7 37.8 39.7 34.8
RoCE 42.2 44.1 44.1 47.6 41.4
Turnover Ratios
Debtors (Days) 81 87 90 88 95 99
Fixed Asset Turnover (x) 7.9 8.4 8.6 8.8 8.4 8.3
Cash flow statement (INR Million)
Y/E March 2011 2012 2013 2014 2015E 2016E
CF from Operations 94,817 115,419 150,205 204,411 222,611 255,056
Cash for Working Capital 18,165 -73,671 -9,997 -12,522 28,789 -29,377
Net Operating CF 112,982 41,747 140,208 191,890 251,401 225,679
Net Purchase of FA -53,633 -41,584 -6,733 -64,233 -57,739 -50,831
Net Purchase of Invest. 19,409 18,390 -33,765 -3,909 0 0
Net Cash from Invest. -34,224 -23,193 -40,498 -68,142 -57,739 -50,831
Proc. from equity issues -11,155 24,319 -3,504 25,371 -35,736 0
Proceeds from LTB/STB 1,608 1,588 -1,412 1,666 1,746 1,826
Dividend Payments -32,058 -57,246 -50,377 -73,325 -84,790 -96,248
Cash Flow from Fin. -41,604 -31,339 -55,292 -46,287 -118,780 -94,421
Free Cash Flow 59,349 164 133,475 127,656 193,662 174,847
Net Cash Flow 37,153 -12,785 44,418 77,461 74,882 80,426
Opening Cash Bal. 10,249 47,402 34,617 79,035 156,495 231,377
Add: Net Cash 37,153 -12,785 44,418 77,461 74,882 80,426
Closing Cash Bal. 47,402 34,617 79,035 156,495 231,377 311,803
E: MOSL Estimates
TCS
13 June 2014 9
N O T E S
TCS
13 June 2014 10
Disclosures
This report is for personal information of the authorized recipient and does not construe to be any investment, legal or taxation advice to you. This research report does not constitute an offer, invitation or
inducement to invest in securities or other investments and Motilal Oswal Securities Limited (hereinafter referred as MOSt) is not soliciting any action based upon it. This report is not for public distribution
and has been furnished to you solely for your information and should not be reproduced or redistributed to any other person in any form.
Unauthorized disclosure, use, dissemination or copying (either whole or partial) of this information, is prohibited. The person accessing this information specifically agrees to exempt MOSt or any of its
affiliates or employees from, any and all responsibility/liability arising from such misuse and agrees not to hold MOSt or any of its affiliates or employees responsible for any such misuse and further agrees
to hold MOSt or any of its affiliates or employees free and harmless from all losses, costs, damages, expenses that may be suffered by the person accessing this information due to any errors and delays.
The information contained herein is based on publicly available data or other sources believed to be reliable. While we would endeavour to update the information herein on reasonable basis, MOSt and/or
its affiliates are under no obligation to update the information. Also there may be regulatory, compliance, or other reasons that may prevent MOSt and/or its affiliates from doing so. MOSt or any of its
affiliates or employees shall not be in any way responsible and liable for any loss or damage that may arise to any person from any inadvertent error in the information contained in this report. MOSt or any
of its affiliates or employees do not provide, at any time, any express or implied warranty of any kind, regarding any matter pertaining to this report, including without limitation the implied warranties of
merchantability, fitness for a particular purpose, and non-infringement. The recipients of this report should rely on their own investigations.
This report is intended for distribution to institutional investors. Recipients who are not institutional investors should seek advice of their independent financial advisor prior to taking any investment decision
based on this report or for any necessary explanation of its contents.
MOSt and/or its affiliates and/or employees may have interests/positions, financial or otherwise in the securities mentioned in this report. To enhance transparency, MOSt has incorporated a Disclosure of
Interest Statement in this document. This should, however, not be treated as endorsement of the views expressed in the report.
Disclosure of Interest Statement TATA CONSULTANCY SVCS LTD
1. Analyst ownership of the stock No
2. Group/Directors ownership of the stock No
3. Broking relationship with company covered No
4. Investment Banking relationship with company covered No
Analyst Certification
The views expressed in this research report accurately reflect the personal views of the analyst(s) about the subject securities or issues, and no part of the compensation of the research analyst(s) was, is,
or will be directly or indirectly related to the specific recommendations and views expressed by research analyst(s) in this report. The research analysts, strategists, or research associates principally
responsible for preparation of MOSt research receive compensation based upon various factors, including quality of research, investor client feedback, stock picking, competitive factors and firm revenues.
Regional Disclosures (outside India)
This report is not directed or intended for distribution to or use by any person or entity resident in a state, country or any jurisdiction, where such distribution, publication, availability or use would be contrary
to law, regulation or which would subject MOSt & its group companies to registration or licensing requirements within such jurisdictions.
For U.K.
This report is intended for distribution only to persons having professional experience in matters relating to investments as described in Article 19 of the Financial Services and Markets Act 2000 (Financial
Promotion) Order 2005 (referred to as "investment professionals"). This document must not be acted on or relied on by persons who are not investment professionals. Any investment or investment activity
to which this document relates is only available to investment professionals and will be engaged in only with such persons.
For U.S.
Motilal Oswal Securities Limited (MOSL) is not a registered broker - dealer under the U.S. Securities Exchange Act of 1934, as amended (the"1934 act") and under applicable state laws in the United
States. In addition MOSL is not a registered investment adviser under the U.S. Investment Advisers Act of 1940, as amended (the "Advisers Act" and together with the 1934 Act, the "Acts), and under
applicable state laws in the United States. Accordingly, in the absence of specific exemption under the Acts, any brokerage and investment services provided by MOSL, including the products and services
described herein are not available to or intended for U.S. persons.
This report is intended for distribution only to "Major Institutional Investors" as defined by Rule 15a-6(b)(4) of the Exchange Act and interpretations thereof by SEC (henceforth referred to as "major
institutional investors"). This document must not be acted on or relied on by persons who are not major institutional investors. Any investment or investment activity to which this document relates is only
available to major institutional investors and will be engaged in only with major institutional investors. In reliance on the exemption from registration provided by Rule 15a-6 of the U.S. Securities Exchange
Act of 1934, as amended (the "Exchange Act") and interpretations thereof by the U.S. Securities and Exchange Commission ("SEC") in order to conduct business with Institutional Investors based in the
U.S., MOSL has entered into a chaperoning agreement with a U.S. registered broker-dealer, Motilal Oswal Securities International Private Limited. ("MOSIPL"). Any business interaction pursuant to this
report will have to be executed within the provisions of this chaperoning agreement.
The Research Analysts contributing to the report may not be registered /qualified as research analyst with FINRA. Such research analyst may not be associated persons of the U.S. registered broker-
dealer, MOSIPL, and therefore, may not be subject to NASD rule 2711 and NYSE Rule 472 restrictions on communication with a subject company, public appearances and trading securities held by a
research analyst account.
For Singapore
Motilal Oswal Capital Markets Singapore Pte Limited is acting as an exempt financial advisor under section 23(1)(f) of the Financial Advisers Act(FAA) read with regulation 17(1)(d) of the Financial
Advisors Regulations and is a subsidiary of Motilal Oswal Securities Limited in India. This research is distributed in Singapore by Motilal Oswal Capital Markets Singapore Pte Limited and it is only directed
in Singapore to accredited investors, as defined in the Financial Advisers Regulations and the Securities and Futures Act (Chapter 289), as amended from time to time.
In respect of any matter arising from or in connection with the research you could contact the following representatives of Motilal Oswal Capital Markets Singapore Pte Limited:
Anosh Koppikar Kadambari Balachandran
Email:anosh.Koppikar@motilaloswal.com Email : kadambari.balachandran@motilaloswal.com
Contact(+65)68189232 Contact: (+65) 68189233 / 65249115
Office Address:21 (Suite 31),16 Collyer Quay,Singapore 04931
Motilal Oswal Securities Ltd
Motilal Oswal Tower, Level 9, Sayani Road, Prabhadevi, Mumbai 400 025
Phone: +91 22 3982 5500 E-mail: reports@motilaloswal.com

More Related Content

What's hot

Tcs 2 qfy2011-221010
Tcs 2 qfy2011-221010Tcs 2 qfy2011-221010
Tcs 2 qfy2011-221010Angel Broking
 
Hdfc securities wipro_29_oct_2014
Hdfc securities wipro_29_oct_2014Hdfc securities wipro_29_oct_2014
Hdfc securities wipro_29_oct_2014IndiaNotes.com
 
Idea Cellular: Q1FY15 results above estimates, buy
Idea Cellular: Q1FY15 results above estimates, buyIdea Cellular: Q1FY15 results above estimates, buy
Idea Cellular: Q1FY15 results above estimates, buyIndiaNotes.com
 
Market outlook 29 10 10
Market outlook 29 10 10Market outlook 29 10 10
Market outlook 29 10 10Angel Broking
 
Choice Broking Research-UltraTech Cement.
 Choice Broking Research-UltraTech Cement. Choice Broking Research-UltraTech Cement.
Choice Broking Research-UltraTech Cement.choice broking
 
Union bank of india ru2 qfy2011-271010
Union bank of india ru2 qfy2011-271010Union bank of india ru2 qfy2011-271010
Union bank of india ru2 qfy2011-271010Angel Broking
 
Cipla 07092021 1630988705
Cipla 07092021 1630988705Cipla 07092021 1630988705
Cipla 07092021 1630988705robertbrookes6
 
CHST Interim Results - August 2016
CHST Interim Results - August 2016CHST Interim Results - August 2016
CHST Interim Results - August 2016Pranav Rao
 
Aerospace & Defence Telemetry Market 2017-2027
Aerospace & Defence Telemetry Market 2017-2027Aerospace & Defence Telemetry Market 2017-2027
Aerospace & Defence Telemetry Market 2017-2027Visiongain
 
Idea2 act tata motors 06072021-1625541614
Idea2 act tata motors 06072021-1625541614Idea2 act tata motors 06072021-1625541614
Idea2 act tata motors 06072021-1625541614robertbrookes6
 
The Quarter One Update for GHCL
The Quarter One Update for GHCLThe Quarter One Update for GHCL
The Quarter One Update for GHCLKritiSahani
 
Vaibhav Global Q1FY15: Outlook continues to remain positive; Hold
 Vaibhav Global Q1FY15: Outlook continues to remain positive; Hold Vaibhav Global Q1FY15: Outlook continues to remain positive; Hold
Vaibhav Global Q1FY15: Outlook continues to remain positive; HoldIndiaNotes.com
 
Bajaj electricals ru2 qfy2011-271010
Bajaj electricals ru2 qfy2011-271010Bajaj electricals ru2 qfy2011-271010
Bajaj electricals ru2 qfy2011-271010Angel Broking
 
Sector Updates: Air Conditioner Sector Institutional Research Report | HDFC s...
Sector Updates: Air Conditioner Sector Institutional Research Report | HDFC s...Sector Updates: Air Conditioner Sector Institutional Research Report | HDFC s...
Sector Updates: Air Conditioner Sector Institutional Research Report | HDFC s...hdfcsecurities1
 
Ipca Laboratories: To voluntarily stop supplies to US; Cut in estimates
 Ipca Laboratories: To voluntarily stop supplies to US; Cut in estimates Ipca Laboratories: To voluntarily stop supplies to US; Cut in estimates
Ipca Laboratories: To voluntarily stop supplies to US; Cut in estimatesIndiaNotes.com
 
India Emerging
India EmergingIndia Emerging
India Emerginggs.balaji
 

What's hot (20)

Se quent press release q3fy20
Se quent press release q3fy20Se quent press release q3fy20
Se quent press release q3fy20
 
Tcs 2 qfy2011-221010
Tcs 2 qfy2011-221010Tcs 2 qfy2011-221010
Tcs 2 qfy2011-221010
 
Hdfc securities wipro_29_oct_2014
Hdfc securities wipro_29_oct_2014Hdfc securities wipro_29_oct_2014
Hdfc securities wipro_29_oct_2014
 
Idea Cellular: Q1FY15 results above estimates, buy
Idea Cellular: Q1FY15 results above estimates, buyIdea Cellular: Q1FY15 results above estimates, buy
Idea Cellular: Q1FY15 results above estimates, buy
 
Q3 fy2003 04
Q3 fy2003 04Q3 fy2003 04
Q3 fy2003 04
 
Market outlook 29 10 10
Market outlook 29 10 10Market outlook 29 10 10
Market outlook 29 10 10
 
Choice Broking Research-UltraTech Cement.
 Choice Broking Research-UltraTech Cement. Choice Broking Research-UltraTech Cement.
Choice Broking Research-UltraTech Cement.
 
Jefferies pharma (1)
Jefferies   pharma (1)Jefferies   pharma (1)
Jefferies pharma (1)
 
Union bank of india ru2 qfy2011-271010
Union bank of india ru2 qfy2011-271010Union bank of india ru2 qfy2011-271010
Union bank of india ru2 qfy2011-271010
 
Cipla 07092021 1630988705
Cipla 07092021 1630988705Cipla 07092021 1630988705
Cipla 07092021 1630988705
 
CHST Interim Results - August 2016
CHST Interim Results - August 2016CHST Interim Results - August 2016
CHST Interim Results - August 2016
 
Aerospace & Defence Telemetry Market 2017-2027
Aerospace & Defence Telemetry Market 2017-2027Aerospace & Defence Telemetry Market 2017-2027
Aerospace & Defence Telemetry Market 2017-2027
 
Idea2 act tata motors 06072021-1625541614
Idea2 act tata motors 06072021-1625541614Idea2 act tata motors 06072021-1625541614
Idea2 act tata motors 06072021-1625541614
 
The Quarter One Update for GHCL
The Quarter One Update for GHCLThe Quarter One Update for GHCL
The Quarter One Update for GHCL
 
Vaibhav Global Q1FY15: Outlook continues to remain positive; Hold
 Vaibhav Global Q1FY15: Outlook continues to remain positive; Hold Vaibhav Global Q1FY15: Outlook continues to remain positive; Hold
Vaibhav Global Q1FY15: Outlook continues to remain positive; Hold
 
Bajaj electricals ru2 qfy2011-271010
Bajaj electricals ru2 qfy2011-271010Bajaj electricals ru2 qfy2011-271010
Bajaj electricals ru2 qfy2011-271010
 
Sector Updates: Air Conditioner Sector Institutional Research Report | HDFC s...
Sector Updates: Air Conditioner Sector Institutional Research Report | HDFC s...Sector Updates: Air Conditioner Sector Institutional Research Report | HDFC s...
Sector Updates: Air Conditioner Sector Institutional Research Report | HDFC s...
 
Ipca Laboratories: To voluntarily stop supplies to US; Cut in estimates
 Ipca Laboratories: To voluntarily stop supplies to US; Cut in estimates Ipca Laboratories: To voluntarily stop supplies to US; Cut in estimates
Ipca Laboratories: To voluntarily stop supplies to US; Cut in estimates
 
India Emerging
India EmergingIndia Emerging
India Emerging
 
PCL report
PCL reportPCL report
PCL report
 

Similar to TCS: Status quo, on track for revenue acceleration; maintain neutral - Motilal Oswal

HCL Q1FY15: Revenue below estimate on lower IMS growth; buy
 HCL Q1FY15: Revenue below estimate on lower IMS growth; buy HCL Q1FY15: Revenue below estimate on lower IMS growth; buy
HCL Q1FY15: Revenue below estimate on lower IMS growth; buyIndiaNotes.com
 
Bharti Airtel 1QFY15 revenue above estimates; buy
 Bharti Airtel 1QFY15 revenue above estimates; buy Bharti Airtel 1QFY15 revenue above estimates; buy
Bharti Airtel 1QFY15 revenue above estimates; buyIndiaNotes.com
 
Q4FY15 Results: TCS' performance below expectations
Q4FY15 Results: TCS' performance below expectationsQ4FY15 Results: TCS' performance below expectations
Q4FY15 Results: TCS' performance below expectationsIndiaNotes.com
 
Idea Cellular Q4FY15: PAT up 60% y-o-y; rating Under Review
Idea Cellular Q4FY15: PAT up 60% y-o-y; rating Under ReviewIdea Cellular Q4FY15: PAT up 60% y-o-y; rating Under Review
Idea Cellular Q4FY15: PAT up 60% y-o-y; rating Under ReviewIndiaNotes.com
 
Lmw ru2 qfy2011-261010
Lmw ru2 qfy2011-261010Lmw ru2 qfy2011-261010
Lmw ru2 qfy2011-261010Angel Broking
 
Blue Star Infotech Q1FY15: Revenues grow 13% y-o-y; Positive outlook
 Blue Star Infotech Q1FY15: Revenues grow 13% y-o-y; Positive outlook Blue Star Infotech Q1FY15: Revenues grow 13% y-o-y; Positive outlook
Blue Star Infotech Q1FY15: Revenues grow 13% y-o-y; Positive outlookIndiaNotes.com
 
Driving growth and differential performance among Class I railroads
Driving growth and differential performance among Class I railroadsDriving growth and differential performance among Class I railroads
Driving growth and differential performance among Class I railroadsDeloitte United States
 
PI Industries: Another strong performance; Sales up 16% in Q1FY15
 PI Industries: Another strong performance; Sales up 16% in Q1FY15 PI Industries: Another strong performance; Sales up 16% in Q1FY15
PI Industries: Another strong performance; Sales up 16% in Q1FY15IndiaNotes.com
 
Tepid consumer demand means notable recovery in volume growth is quarters away
Tepid consumer demand means notable recovery in volume growth is quarters awayTepid consumer demand means notable recovery in volume growth is quarters away
Tepid consumer demand means notable recovery in volume growth is quarters awayIndiaNotes.com
 
Nirmal pi industries_03_aug15
Nirmal pi industries_03_aug15Nirmal pi industries_03_aug15
Nirmal pi industries_03_aug15IndiaNotes.com
 
Stock Market Report For Investors -Sai Proficient
Stock Market Report For Investors -Sai ProficientStock Market Report For Investors -Sai Proficient
Stock Market Report For Investors -Sai Proficientsai proficient research
 
KPDL_Result Presentation_Q4 and FY15
KPDL_Result Presentation_Q4 and FY15KPDL_Result Presentation_Q4 and FY15
KPDL_Result Presentation_Q4 and FY15Varun Parwal
 
ir-presentation.pdf
ir-presentation.pdfir-presentation.pdf
ir-presentation.pdfssuserbe345f
 
Indian Bank Q1FY15: Buy for a target of Rs230
 Indian Bank Q1FY15: Buy for a target of Rs230 Indian Bank Q1FY15: Buy for a target of Rs230
Indian Bank Q1FY15: Buy for a target of Rs230IndiaNotes.com
 

Similar to TCS: Status quo, on track for revenue acceleration; maintain neutral - Motilal Oswal (20)

TCS Fact Sheet Q1 FY15
TCS Fact Sheet Q1 FY15TCS Fact Sheet Q1 FY15
TCS Fact Sheet Q1 FY15
 
HCL Q1FY15: Revenue below estimate on lower IMS growth; buy
 HCL Q1FY15: Revenue below estimate on lower IMS growth; buy HCL Q1FY15: Revenue below estimate on lower IMS growth; buy
HCL Q1FY15: Revenue below estimate on lower IMS growth; buy
 
Bharti Airtel 1QFY15 revenue above estimates; buy
 Bharti Airtel 1QFY15 revenue above estimates; buy Bharti Airtel 1QFY15 revenue above estimates; buy
Bharti Airtel 1QFY15 revenue above estimates; buy
 
TCS Fact Sheet Q4 FY14
TCS Fact Sheet Q4 FY14TCS Fact Sheet Q4 FY14
TCS Fact Sheet Q4 FY14
 
TCS: Maintain neutral
TCS: Maintain neutralTCS: Maintain neutral
TCS: Maintain neutral
 
Q4FY15 Results: TCS' performance below expectations
Q4FY15 Results: TCS' performance below expectationsQ4FY15 Results: TCS' performance below expectations
Q4FY15 Results: TCS' performance below expectations
 
TCS Analysts Presentation Q3 FY 2013-14
TCS Analysts Presentation Q3 FY 2013-14TCS Analysts Presentation Q3 FY 2013-14
TCS Analysts Presentation Q3 FY 2013-14
 
Idea Cellular Q4FY15: PAT up 60% y-o-y; rating Under Review
Idea Cellular Q4FY15: PAT up 60% y-o-y; rating Under ReviewIdea Cellular Q4FY15: PAT up 60% y-o-y; rating Under Review
Idea Cellular Q4FY15: PAT up 60% y-o-y; rating Under Review
 
Lmw ru2 qfy2011-261010
Lmw ru2 qfy2011-261010Lmw ru2 qfy2011-261010
Lmw ru2 qfy2011-261010
 
Blue Star Infotech Q1FY15: Revenues grow 13% y-o-y; Positive outlook
 Blue Star Infotech Q1FY15: Revenues grow 13% y-o-y; Positive outlook Blue Star Infotech Q1FY15: Revenues grow 13% y-o-y; Positive outlook
Blue Star Infotech Q1FY15: Revenues grow 13% y-o-y; Positive outlook
 
Driving growth and differential performance among Class I railroads
Driving growth and differential performance among Class I railroadsDriving growth and differential performance among Class I railroads
Driving growth and differential performance among Class I railroads
 
10 point cii agenda for economic revival
10 point cii agenda for economic revival 10 point cii agenda for economic revival
10 point cii agenda for economic revival
 
PI Industries: Another strong performance; Sales up 16% in Q1FY15
 PI Industries: Another strong performance; Sales up 16% in Q1FY15 PI Industries: Another strong performance; Sales up 16% in Q1FY15
PI Industries: Another strong performance; Sales up 16% in Q1FY15
 
Tepid consumer demand means notable recovery in volume growth is quarters away
Tepid consumer demand means notable recovery in volume growth is quarters awayTepid consumer demand means notable recovery in volume growth is quarters away
Tepid consumer demand means notable recovery in volume growth is quarters away
 
Usl ktk
Usl ktkUsl ktk
Usl ktk
 
Nirmal pi industries_03_aug15
Nirmal pi industries_03_aug15Nirmal pi industries_03_aug15
Nirmal pi industries_03_aug15
 
Stock Market Report For Investors -Sai Proficient
Stock Market Report For Investors -Sai ProficientStock Market Report For Investors -Sai Proficient
Stock Market Report For Investors -Sai Proficient
 
KPDL_Result Presentation_Q4 and FY15
KPDL_Result Presentation_Q4 and FY15KPDL_Result Presentation_Q4 and FY15
KPDL_Result Presentation_Q4 and FY15
 
ir-presentation.pdf
ir-presentation.pdfir-presentation.pdf
ir-presentation.pdf
 
Indian Bank Q1FY15: Buy for a target of Rs230
 Indian Bank Q1FY15: Buy for a target of Rs230 Indian Bank Q1FY15: Buy for a target of Rs230
Indian Bank Q1FY15: Buy for a target of Rs230
 

More from IndiaNotes.com

Fce glaxo smithkline_12aug15
Fce glaxo smithkline_12aug15Fce glaxo smithkline_12aug15
Fce glaxo smithkline_12aug15IndiaNotes.com
 
GSK Consumer: Horlicks strengthens its position as No.1 brand across India
GSK Consumer: Horlicks strengthens its position as No.1 brand across IndiaGSK Consumer: Horlicks strengthens its position as No.1 brand across India
GSK Consumer: Horlicks strengthens its position as No.1 brand across IndiaIndiaNotes.com
 
Hester Biosciences gets manufacturing licence for 2 additional poultry vaccines
Hester Biosciences gets manufacturing licence for 2 additional poultry vaccinesHester Biosciences gets manufacturing licence for 2 additional poultry vaccines
Hester Biosciences gets manufacturing licence for 2 additional poultry vaccinesIndiaNotes.com
 
Vidhi Dyestuffs: To keep its growth story in the coming quarters also
Vidhi Dyestuffs: To keep its growth story in the coming quarters alsoVidhi Dyestuffs: To keep its growth story in the coming quarters also
Vidhi Dyestuffs: To keep its growth story in the coming quarters alsoIndiaNotes.com
 
Apollo Tyres approves further expansion of the Truck & Bus radial tyre capacity
Apollo Tyres approves further expansion of the Truck & Bus radial tyre capacityApollo Tyres approves further expansion of the Truck & Bus radial tyre capacity
Apollo Tyres approves further expansion of the Truck & Bus radial tyre capacityIndiaNotes.com
 
Grasim Industries reports improved performance in Q1FY16
Grasim Industries reports improved performance in Q1FY16Grasim Industries reports improved performance in Q1FY16
Grasim Industries reports improved performance in Q1FY16IndiaNotes.com
 
Cummins India: No interest burden being free from long-term or short-term debt
Cummins India: No interest burden being free from long-term or short-term debtCummins India: No interest burden being free from long-term or short-term debt
Cummins India: No interest burden being free from long-term or short-term debtIndiaNotes.com
 
Buy Makers Laboratories, company growing rapidly with strong thrust on brande...
Buy Makers Laboratories, company growing rapidly with strong thrust on brande...Buy Makers Laboratories, company growing rapidly with strong thrust on brande...
Buy Makers Laboratories, company growing rapidly with strong thrust on brande...IndiaNotes.com
 
Buy Multibase India, globalisation of the auto component sector to benefit th...
Buy Multibase India, globalisation of the auto component sector to benefit th...Buy Multibase India, globalisation of the auto component sector to benefit th...
Buy Multibase India, globalisation of the auto component sector to benefit th...IndiaNotes.com
 
Capital First: Long-term credit rating is rated highly at AA+ by CARE
Capital First: Long-term credit rating is rated highly at AA+ by CARECapital First: Long-term credit rating is rated highly at AA+ by CARE
Capital First: Long-term credit rating is rated highly at AA+ by CAREIndiaNotes.com
 
Orient Cement: Best placed to benefit from demand revival in AP & Telengana r...
Orient Cement: Best placed to benefit from demand revival in AP & Telengana r...Orient Cement: Best placed to benefit from demand revival in AP & Telengana r...
Orient Cement: Best placed to benefit from demand revival in AP & Telengana r...IndiaNotes.com
 
Canara Bank's operating performance to improve in remaining 9MFY16E
Canara Bank's operating performance to improve in remaining 9MFY16ECanara Bank's operating performance to improve in remaining 9MFY16E
Canara Bank's operating performance to improve in remaining 9MFY16EIndiaNotes.com
 
Buy Jenburkt Pharmaceuticals; government's amended FDI policy to cover medica...
Buy Jenburkt Pharmaceuticals; government's amended FDI policy to cover medica...Buy Jenburkt Pharmaceuticals; government's amended FDI policy to cover medica...
Buy Jenburkt Pharmaceuticals; government's amended FDI policy to cover medica...IndiaNotes.com
 
Hexaware Technologies adds 9 clients in Q2CY15, Buy
Hexaware Technologies adds 9 clients in Q2CY15, BuyHexaware Technologies adds 9 clients in Q2CY15, Buy
Hexaware Technologies adds 9 clients in Q2CY15, BuyIndiaNotes.com
 
Indoco Remedies: Weak domestic growth offsets export revenues in Q1FY16; Hold
Indoco Remedies: Weak domestic growth offsets export revenues in Q1FY16; HoldIndoco Remedies: Weak domestic growth offsets export revenues in Q1FY16; Hold
Indoco Remedies: Weak domestic growth offsets export revenues in Q1FY16; HoldIndiaNotes.com
 
PI Industries: Custom synthesis exports deliver growth of ~26% in Q1FY16; Buy
PI Industries: Custom synthesis exports deliver growth of ~26% in Q1FY16; BuyPI Industries: Custom synthesis exports deliver growth of ~26% in Q1FY16; Buy
PI Industries: Custom synthesis exports deliver growth of ~26% in Q1FY16; BuyIndiaNotes.com
 
Torrent Pharma Q1FY16: IndiaNivesh maintain 'buy' for an upgraded price target
Torrent Pharma Q1FY16: IndiaNivesh maintain 'buy' for an upgraded price targetTorrent Pharma Q1FY16: IndiaNivesh maintain 'buy' for an upgraded price target
Torrent Pharma Q1FY16: IndiaNivesh maintain 'buy' for an upgraded price targetIndiaNotes.com
 

More from IndiaNotes.com (20)

Fce glaxo smithkline_12aug15
Fce glaxo smithkline_12aug15Fce glaxo smithkline_12aug15
Fce glaxo smithkline_12aug15
 
GSK Consumer: Horlicks strengthens its position as No.1 brand across India
GSK Consumer: Horlicks strengthens its position as No.1 brand across IndiaGSK Consumer: Horlicks strengthens its position as No.1 brand across India
GSK Consumer: Horlicks strengthens its position as No.1 brand across India
 
GSK Consumer: Horlicks strengthens its position as No.1 brand across India
GSK Consumer: Horlicks strengthens its position as No.1 brand across IndiaGSK Consumer: Horlicks strengthens its position as No.1 brand across India
GSK Consumer: Horlicks strengthens its position as No.1 brand across India
 
Hester Biosciences gets manufacturing licence for 2 additional poultry vaccines
Hester Biosciences gets manufacturing licence for 2 additional poultry vaccinesHester Biosciences gets manufacturing licence for 2 additional poultry vaccines
Hester Biosciences gets manufacturing licence for 2 additional poultry vaccines
 
Vidhi Dyestuffs: To keep its growth story in the coming quarters also
Vidhi Dyestuffs: To keep its growth story in the coming quarters alsoVidhi Dyestuffs: To keep its growth story in the coming quarters also
Vidhi Dyestuffs: To keep its growth story in the coming quarters also
 
Apollo Tyres approves further expansion of the Truck & Bus radial tyre capacity
Apollo Tyres approves further expansion of the Truck & Bus radial tyre capacityApollo Tyres approves further expansion of the Truck & Bus radial tyre capacity
Apollo Tyres approves further expansion of the Truck & Bus radial tyre capacity
 
Grasim Industries reports improved performance in Q1FY16
Grasim Industries reports improved performance in Q1FY16Grasim Industries reports improved performance in Q1FY16
Grasim Industries reports improved performance in Q1FY16
 
Cummins India: No interest burden being free from long-term or short-term debt
Cummins India: No interest burden being free from long-term or short-term debtCummins India: No interest burden being free from long-term or short-term debt
Cummins India: No interest burden being free from long-term or short-term debt
 
Buy Makers Laboratories, company growing rapidly with strong thrust on brande...
Buy Makers Laboratories, company growing rapidly with strong thrust on brande...Buy Makers Laboratories, company growing rapidly with strong thrust on brande...
Buy Makers Laboratories, company growing rapidly with strong thrust on brande...
 
Buy Multibase India, globalisation of the auto component sector to benefit th...
Buy Multibase India, globalisation of the auto component sector to benefit th...Buy Multibase India, globalisation of the auto component sector to benefit th...
Buy Multibase India, globalisation of the auto component sector to benefit th...
 
Capital First: Long-term credit rating is rated highly at AA+ by CARE
Capital First: Long-term credit rating is rated highly at AA+ by CARECapital First: Long-term credit rating is rated highly at AA+ by CARE
Capital First: Long-term credit rating is rated highly at AA+ by CARE
 
Orient Cement: Best placed to benefit from demand revival in AP & Telengana r...
Orient Cement: Best placed to benefit from demand revival in AP & Telengana r...Orient Cement: Best placed to benefit from demand revival in AP & Telengana r...
Orient Cement: Best placed to benefit from demand revival in AP & Telengana r...
 
Canara Bank's operating performance to improve in remaining 9MFY16E
Canara Bank's operating performance to improve in remaining 9MFY16ECanara Bank's operating performance to improve in remaining 9MFY16E
Canara Bank's operating performance to improve in remaining 9MFY16E
 
Nirmal lupin 06_aug15
Nirmal lupin 06_aug15Nirmal lupin 06_aug15
Nirmal lupin 06_aug15
 
Buy Jenburkt Pharmaceuticals; government's amended FDI policy to cover medica...
Buy Jenburkt Pharmaceuticals; government's amended FDI policy to cover medica...Buy Jenburkt Pharmaceuticals; government's amended FDI policy to cover medica...
Buy Jenburkt Pharmaceuticals; government's amended FDI policy to cover medica...
 
Hexaware Technologies adds 9 clients in Q2CY15, Buy
Hexaware Technologies adds 9 clients in Q2CY15, BuyHexaware Technologies adds 9 clients in Q2CY15, Buy
Hexaware Technologies adds 9 clients in Q2CY15, Buy
 
Indoco Remedies: Weak domestic growth offsets export revenues in Q1FY16; Hold
Indoco Remedies: Weak domestic growth offsets export revenues in Q1FY16; HoldIndoco Remedies: Weak domestic growth offsets export revenues in Q1FY16; Hold
Indoco Remedies: Weak domestic growth offsets export revenues in Q1FY16; Hold
 
Fce thermax 31_jul15
Fce thermax 31_jul15Fce thermax 31_jul15
Fce thermax 31_jul15
 
PI Industries: Custom synthesis exports deliver growth of ~26% in Q1FY16; Buy
PI Industries: Custom synthesis exports deliver growth of ~26% in Q1FY16; BuyPI Industries: Custom synthesis exports deliver growth of ~26% in Q1FY16; Buy
PI Industries: Custom synthesis exports deliver growth of ~26% in Q1FY16; Buy
 
Torrent Pharma Q1FY16: IndiaNivesh maintain 'buy' for an upgraded price target
Torrent Pharma Q1FY16: IndiaNivesh maintain 'buy' for an upgraded price targetTorrent Pharma Q1FY16: IndiaNivesh maintain 'buy' for an upgraded price target
Torrent Pharma Q1FY16: IndiaNivesh maintain 'buy' for an upgraded price target
 

Recently uploaded

Monthly Market Risk Update: April 2024 [SlideShare]
Monthly Market Risk Update: April 2024 [SlideShare]Monthly Market Risk Update: April 2024 [SlideShare]
Monthly Market Risk Update: April 2024 [SlideShare]Commonwealth
 
Attachment Of Assets......................
Attachment Of Assets......................Attachment Of Assets......................
Attachment Of Assets......................AmanBajaj36
 
Interimreport1 January–31 March2024 Elo Mutual Pension Insurance Company
Interimreport1 January–31 March2024 Elo Mutual Pension Insurance CompanyInterimreport1 January–31 March2024 Elo Mutual Pension Insurance Company
Interimreport1 January–31 March2024 Elo Mutual Pension Insurance CompanyTyöeläkeyhtiö Elo
 
Independent Lucknow Call Girls 8923113531WhatsApp Lucknow Call Girls make you...
Independent Lucknow Call Girls 8923113531WhatsApp Lucknow Call Girls make you...Independent Lucknow Call Girls 8923113531WhatsApp Lucknow Call Girls make you...
Independent Lucknow Call Girls 8923113531WhatsApp Lucknow Call Girls make you...makika9823
 
letter-from-the-chair-to-the-fca-relating-to-british-steel-pensions-scheme-15...
letter-from-the-chair-to-the-fca-relating-to-british-steel-pensions-scheme-15...letter-from-the-chair-to-the-fca-relating-to-british-steel-pensions-scheme-15...
letter-from-the-chair-to-the-fca-relating-to-british-steel-pensions-scheme-15...Henry Tapper
 
Bladex Earnings Call Presentation 1Q2024
Bladex Earnings Call Presentation 1Q2024Bladex Earnings Call Presentation 1Q2024
Bladex Earnings Call Presentation 1Q2024Bladex
 
VIP High Class Call Girls Saharanpur Anushka 8250192130 Independent Escort Se...
VIP High Class Call Girls Saharanpur Anushka 8250192130 Independent Escort Se...VIP High Class Call Girls Saharanpur Anushka 8250192130 Independent Escort Se...
VIP High Class Call Girls Saharanpur Anushka 8250192130 Independent Escort Se...Suhani Kapoor
 
Instant Issue Debit Cards - School Designs
Instant Issue Debit Cards - School DesignsInstant Issue Debit Cards - School Designs
Instant Issue Debit Cards - School Designsegoetzinger
 
原版1:1复刻温哥华岛大学毕业证Vancouver毕业证留信学历认证
原版1:1复刻温哥华岛大学毕业证Vancouver毕业证留信学历认证原版1:1复刻温哥华岛大学毕业证Vancouver毕业证留信学历认证
原版1:1复刻温哥华岛大学毕业证Vancouver毕业证留信学历认证rjrjkk
 
Russian Call Girls In Gtb Nagar (Delhi) 9711199012 💋✔💕😘 Naughty Call Girls Se...
Russian Call Girls In Gtb Nagar (Delhi) 9711199012 💋✔💕😘 Naughty Call Girls Se...Russian Call Girls In Gtb Nagar (Delhi) 9711199012 💋✔💕😘 Naughty Call Girls Se...
Russian Call Girls In Gtb Nagar (Delhi) 9711199012 💋✔💕😘 Naughty Call Girls Se...shivangimorya083
 
government_intervention_in_business_ownership[1].pdf
government_intervention_in_business_ownership[1].pdfgovernment_intervention_in_business_ownership[1].pdf
government_intervention_in_business_ownership[1].pdfshaunmashale756
 
(办理学位证)加拿大萨省大学毕业证成绩单原版一比一
(办理学位证)加拿大萨省大学毕业证成绩单原版一比一(办理学位证)加拿大萨省大学毕业证成绩单原版一比一
(办理学位证)加拿大萨省大学毕业证成绩单原版一比一S SDS
 
AfRESFullPaper22018EmpiricalPerformanceofRealEstateInvestmentTrustsandShareho...
AfRESFullPaper22018EmpiricalPerformanceofRealEstateInvestmentTrustsandShareho...AfRESFullPaper22018EmpiricalPerformanceofRealEstateInvestmentTrustsandShareho...
AfRESFullPaper22018EmpiricalPerformanceofRealEstateInvestmentTrustsandShareho...yordanosyohannes2
 
Vip B Aizawl Call Girls #9907093804 Contact Number Escorts Service Aizawl
Vip B Aizawl Call Girls #9907093804 Contact Number Escorts Service AizawlVip B Aizawl Call Girls #9907093804 Contact Number Escorts Service Aizawl
Vip B Aizawl Call Girls #9907093804 Contact Number Escorts Service Aizawlmakika9823
 
Classical Theory of Macroeconomics by Adam Smith
Classical Theory of Macroeconomics by Adam SmithClassical Theory of Macroeconomics by Adam Smith
Classical Theory of Macroeconomics by Adam SmithAdamYassin2
 
原版1:1复刻堪萨斯大学毕业证KU毕业证留信学历认证
原版1:1复刻堪萨斯大学毕业证KU毕业证留信学历认证原版1:1复刻堪萨斯大学毕业证KU毕业证留信学历认证
原版1:1复刻堪萨斯大学毕业证KU毕业证留信学历认证jdkhjh
 
Instant Issue Debit Cards - High School Spirit
Instant Issue Debit Cards - High School SpiritInstant Issue Debit Cards - High School Spirit
Instant Issue Debit Cards - High School Spiritegoetzinger
 
Financial institutions facilitate financing, economic transactions, issue fun...
Financial institutions facilitate financing, economic transactions, issue fun...Financial institutions facilitate financing, economic transactions, issue fun...
Financial institutions facilitate financing, economic transactions, issue fun...Avanish Goel
 
Call Girls In Yusuf Sarai Women Seeking Men 9654467111
Call Girls In Yusuf Sarai Women Seeking Men 9654467111Call Girls In Yusuf Sarai Women Seeking Men 9654467111
Call Girls In Yusuf Sarai Women Seeking Men 9654467111Sapana Sha
 

Recently uploaded (20)

Monthly Market Risk Update: April 2024 [SlideShare]
Monthly Market Risk Update: April 2024 [SlideShare]Monthly Market Risk Update: April 2024 [SlideShare]
Monthly Market Risk Update: April 2024 [SlideShare]
 
Attachment Of Assets......................
Attachment Of Assets......................Attachment Of Assets......................
Attachment Of Assets......................
 
Interimreport1 January–31 March2024 Elo Mutual Pension Insurance Company
Interimreport1 January–31 March2024 Elo Mutual Pension Insurance CompanyInterimreport1 January–31 March2024 Elo Mutual Pension Insurance Company
Interimreport1 January–31 March2024 Elo Mutual Pension Insurance Company
 
Independent Lucknow Call Girls 8923113531WhatsApp Lucknow Call Girls make you...
Independent Lucknow Call Girls 8923113531WhatsApp Lucknow Call Girls make you...Independent Lucknow Call Girls 8923113531WhatsApp Lucknow Call Girls make you...
Independent Lucknow Call Girls 8923113531WhatsApp Lucknow Call Girls make you...
 
letter-from-the-chair-to-the-fca-relating-to-british-steel-pensions-scheme-15...
letter-from-the-chair-to-the-fca-relating-to-british-steel-pensions-scheme-15...letter-from-the-chair-to-the-fca-relating-to-british-steel-pensions-scheme-15...
letter-from-the-chair-to-the-fca-relating-to-british-steel-pensions-scheme-15...
 
Bladex Earnings Call Presentation 1Q2024
Bladex Earnings Call Presentation 1Q2024Bladex Earnings Call Presentation 1Q2024
Bladex Earnings Call Presentation 1Q2024
 
VIP High Class Call Girls Saharanpur Anushka 8250192130 Independent Escort Se...
VIP High Class Call Girls Saharanpur Anushka 8250192130 Independent Escort Se...VIP High Class Call Girls Saharanpur Anushka 8250192130 Independent Escort Se...
VIP High Class Call Girls Saharanpur Anushka 8250192130 Independent Escort Se...
 
Instant Issue Debit Cards - School Designs
Instant Issue Debit Cards - School DesignsInstant Issue Debit Cards - School Designs
Instant Issue Debit Cards - School Designs
 
原版1:1复刻温哥华岛大学毕业证Vancouver毕业证留信学历认证
原版1:1复刻温哥华岛大学毕业证Vancouver毕业证留信学历认证原版1:1复刻温哥华岛大学毕业证Vancouver毕业证留信学历认证
原版1:1复刻温哥华岛大学毕业证Vancouver毕业证留信学历认证
 
Russian Call Girls In Gtb Nagar (Delhi) 9711199012 💋✔💕😘 Naughty Call Girls Se...
Russian Call Girls In Gtb Nagar (Delhi) 9711199012 💋✔💕😘 Naughty Call Girls Se...Russian Call Girls In Gtb Nagar (Delhi) 9711199012 💋✔💕😘 Naughty Call Girls Se...
Russian Call Girls In Gtb Nagar (Delhi) 9711199012 💋✔💕😘 Naughty Call Girls Se...
 
government_intervention_in_business_ownership[1].pdf
government_intervention_in_business_ownership[1].pdfgovernment_intervention_in_business_ownership[1].pdf
government_intervention_in_business_ownership[1].pdf
 
(办理学位证)加拿大萨省大学毕业证成绩单原版一比一
(办理学位证)加拿大萨省大学毕业证成绩单原版一比一(办理学位证)加拿大萨省大学毕业证成绩单原版一比一
(办理学位证)加拿大萨省大学毕业证成绩单原版一比一
 
AfRESFullPaper22018EmpiricalPerformanceofRealEstateInvestmentTrustsandShareho...
AfRESFullPaper22018EmpiricalPerformanceofRealEstateInvestmentTrustsandShareho...AfRESFullPaper22018EmpiricalPerformanceofRealEstateInvestmentTrustsandShareho...
AfRESFullPaper22018EmpiricalPerformanceofRealEstateInvestmentTrustsandShareho...
 
Vip B Aizawl Call Girls #9907093804 Contact Number Escorts Service Aizawl
Vip B Aizawl Call Girls #9907093804 Contact Number Escorts Service AizawlVip B Aizawl Call Girls #9907093804 Contact Number Escorts Service Aizawl
Vip B Aizawl Call Girls #9907093804 Contact Number Escorts Service Aizawl
 
Classical Theory of Macroeconomics by Adam Smith
Classical Theory of Macroeconomics by Adam SmithClassical Theory of Macroeconomics by Adam Smith
Classical Theory of Macroeconomics by Adam Smith
 
原版1:1复刻堪萨斯大学毕业证KU毕业证留信学历认证
原版1:1复刻堪萨斯大学毕业证KU毕业证留信学历认证原版1:1复刻堪萨斯大学毕业证KU毕业证留信学历认证
原版1:1复刻堪萨斯大学毕业证KU毕业证留信学历认证
 
Commercial Bank Economic Capsule - April 2024
Commercial Bank Economic Capsule - April 2024Commercial Bank Economic Capsule - April 2024
Commercial Bank Economic Capsule - April 2024
 
Instant Issue Debit Cards - High School Spirit
Instant Issue Debit Cards - High School SpiritInstant Issue Debit Cards - High School Spirit
Instant Issue Debit Cards - High School Spirit
 
Financial institutions facilitate financing, economic transactions, issue fun...
Financial institutions facilitate financing, economic transactions, issue fun...Financial institutions facilitate financing, economic transactions, issue fun...
Financial institutions facilitate financing, economic transactions, issue fun...
 
Call Girls In Yusuf Sarai Women Seeking Men 9654467111
Call Girls In Yusuf Sarai Women Seeking Men 9654467111Call Girls In Yusuf Sarai Women Seeking Men 9654467111
Call Girls In Yusuf Sarai Women Seeking Men 9654467111
 

TCS: Status quo, on track for revenue acceleration; maintain neutral - Motilal Oswal

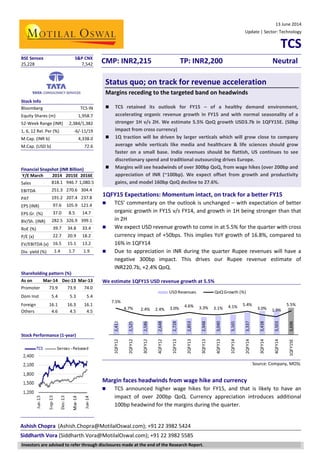
  • 1. Ashish Chopra (Ashish.Chopra@MotilalOswal.com); +91 22 3982 5424 Siddharth Vora (Siddharth.Vora@MotilalOswal.com); +91 22 3982 5585 13 June 2014 Update | Sector: Technology TCS CMP: INR2,215 TP: INR2,200 Neutral Status quo; on track for revenue acceleration Margins receding to the targeted band on headwinds  TCS retained its outlook for FY15 – of a healthy demand environment, accelerating organic revenue growth in FY15 and with normal seasonality of a stronger 1H v/s 2H. We estimate 5.5% QoQ growth USD3.7b in 1QFY15E. (50bp impact from cross currency)  1Q traction will be driven by larger verticals which will grow close to company average while verticals like media and healthcare & life sciences should grow faster on a small base. India revenues should be flattish, US continues to see discretionary spend and traditional outsourcing drives Europe.  Margins will see headwinds of over 300bp QoQ, from wage hikes (over 200bp and appreciation of INR (~100bp). We expect offset from growth and productivity gains, and model 160bp QoQ decline to 27.6%. 1QFY15 Expectations: Momentum intact, on track for a better FY15  TCS’ commentary on the outlook is unchanged – with expectation of better organic growth in FY15 v/s FY14, and growth in 1H being stronger than that in 2H  We expect USD revenue growth to come in at 5.5% for the quarter with cross currency impact of +50bps. This implies YoY growth of 16.8%, compared to 16% in 1QFY14  Due to appreciation in INR during the quarter Rupee revenues will have a negative 300bp impact. This drives our Rupee revenue estimate of INR220.7b, +2.4% QoQ. We estimate 1QFY15 USD revenue growth at 5.5% Source: Company, MOSL Margin faces headwinds from wage hike and currency  TCS announced higher wage hikes for FY15, and that is likely to have an impact of over 200bp QoQ. Currency appreciation introduces additional 100bp headwind for the margins during the quarter. 2,412 2,525 2,586 2,648 2,728 2,853 2,948 3,040 3,165 3,337 3,438 3,503 3,696 7.5% 4.7% 2.4% 2.4% 3.0% 4.6% 3.3% 3.1% 4.1% 5.4% 3.0% 1.9% 5.5% 1QFY12 2QFY12 3QFY12 4QFY12 1QFY13 2QFY13 3QFY13 4QFY13 1QFY14 2QFY14 3QFY14 4QFY14 1QFY15EUSDRevenues QoQ Growth (%) Investors are advised to refer through disclosures made at the end of the Research Report. BSE Sensex S&P CNX 25,228 7,542 Stock Info Bloomberg TCS IN Equity Shares (m) 1,958.7 52-Week Range (INR) 2,384/1,382 1, 6, 12 Rel. Per (%) -6/-11/19 M.Cap. (INR b) 4,338.0 M.Cap. (USD b) 72.6 Financial Snapshot (INR Billion) Y/E March 2014 2015E 2016E Sales 818.1 946.7 1,080.5 EBITDA 251.3 270.6 304.4 PAT 191.2 207.4 237.8 EPS (INR) 97.6 105.9 121.4 EPS Gr. (%) 37.0 8.5 14.7 BV/Sh. (INR) 282.5 326.9 399.1 RoE (%) 39.7 34.8 33.4 P/E (x) 22.7 20.9 18.2 EV/EBITDA (x) 16.5 15.1 13.2 Div. yield (%) 1.4 1.7 1.9 Shareholding pattern (%) As on Mar-14 Dec-13 Mar-13 Promoter 73.9 73.9 74.0 Dom Inst 5.4 5.3 5.4 Foreign 16.1 16.3 16.1 Others 4.6 4.5 4.5 Stock Performance (1-year)
  • 2. TCS 13 June 2014 2  Impact from a high growth rate and contribution from productivity improvement should help partially offset the impact from headwinds, and we expect the decline to be limited to 160bp, implying EBIT margin of 27.6% in 1QFY15. We estimate margins to decline by 160bps to 27.6% Source: Company, MOSL  TCS continues to maintain its target band for margins as 26-28% going forward and may tweak the rate of investments going forward in the event of additional headwinds like appreciation of INR.  Our PAT estimate for the quarter stands at INR49.5b, down 6.6%, on account of appreciation in INR, lower operating margin, and little impact from forex hedges compared to gains worth INR2b in 4QFY14. Segmental traction  Growth will be broad based across verticals with large verticals growing close to company average and smaller verticals like healthcare & life sciences and media are expected to grow above company average. Vertical performance in 4QFY14 Verticals Contr. to overall rev (%) QoQ Gr. (%) Contr. to incr rev (%) 4 Quarter CQGR BFSI 42.9 2.4 53.5 3.2 Mfg 8.6 (0.4) (2.0) 3.9 Telecom 9.3 (1.3) (6.6) 3.6 LS & Healthcare 6.1 5.3 16.7 8.4 Retail & Distr 13.5 (0.3) (2.4) 3.8 Transportation 3.5 1.9 3.5 4.4 Energy and Utilities 3.8 1.9 3.8 3.6 Media & Entmnt 2.6 15.2 18.5 9.3 Hi-Tech 5.3 1.9 5.3 1.7 Others 4.4 4.3 9.7 (0.6) Source: MOSL, Company  In terms of geography, revenue momentum in US continues – with greater project based or discretionary demand. Europe is seeing sustained momentum of traditional outsourcing spend picking up. Growth will be driven by developed geographies while India revenues are expected to be flattish during the quarter.
  • 3. TCS 13 June 2014 3 Geography performance in 4QFY14 Geographies Contr. to overall rev (%) QoQ Gr. (%) Contr. to incr rev (%) 4 Quarter CQGR North America 52.2 0.9 25.8 3.1 Latin America 2.2 (2.5) (3.1) 1.4 UK 17.8 3.6 33.7 5.1 Continental Europe 12.1 6.3 38.5 10.4 India 6.2 0.3 0.9 (5.1) APAC 7.4 1.9 7.4 4.0 MEA 2.1 (2.7) (3.2) 3.6 Source: MOSL, Company  In terms of services, growth continues to be broad-based across the offerings. TCS’ proprietary cloud offering iON remains work in progress, still small in terms of revenue size to impact overall company performance, Change in depreciation policy in line with the revised Companies Act  To be in accordance with the Companies Act 2013, TCS effected change in its depreciation policy. The company has taken the opportunity to further rationalize the policies for depreciation – bringing different policies across subsidiary companies under one standard.  TCS will be following straight-line depreciation with lower asset life from the previously followed WDV method. This will result in: [1] a one-time impact in Indian GAAP of write back of 4-5% of net Fixed Assets as an exceptional item and [2] one time impact in IFRS of additional charge of ~2% of Fixed Asset added to normal depreciation. We will factor the same into our estimates as clarity on the exact impact of the same emerges in 1QFY 15 financials. Valuation and view Our estimates remain largely unchanged after the management’s latest outlook. Over the past four years, TCS has led the incremental revenues as well as operating profits not just domestically, but also in the global arena (compared to peers multiple times its size); and its market cap is second only to IBM. At 18.8% USD revenue CAGR over FY14-16E, we expect TCS to continue leading the industry growth with excellent execution. At 20.9x FY15E and 18.2x FY16E EPS, we remain Neutral on valuations. We would treat any corrections as an entry opportunity.
  • 4. TCS 13 June 2014 4 Story in charts TCS continues to lead industry growth… Source: Company, MOSL …but India headwinds cripple outperformance Source: Company, MOSL Revenue growth finally getting delinked to headcount... Source: Company, MOSL ...as competitive intensity gradually pulls down pricing Source: Company, MOSL Operating at peak efficiency, reflected in utilization... Source: Company, MOSL ...Expect margins to settle lower and EPS to lag rev. growth Source: Company, MOSL
  • 5. TCS 13 June 2014 5 Operating Metrics 1QFY13 2QFY13 3QFY13 4QFY13 1QFY14 2QFY14 3QFY14 4QFY14 Service Lines (%) ADM 43.4 43.1 42.4 42.4 42.3 41.7 41.4 41.0 Engineering and Industrial Services 4.6 4.6 4.7 4.6 4.7 4.7 4.6 4.8 Infrastructure Services 10.6 11.4 11.7 12.1 11.9 11.8 12.0 12.0 Enterprise Solutions 15.2 14.9 15.1 15.5 15.1 15.4 15.7 15.7 Global Consulting 2.8 3.0 3.2 3.1 3.5 3.3 3.4 3.4 Asset Leverage Solutions 2.8 2.7 2.8 2.5 2.5 2.7 2.3 2.6 Assurance Services 7.6 7.7 7.7 7.8 8.1 8.5 8.5 8.4 BPO 13.0 12.6 12.4 12.0 11.9 11.9 12.1 12.1 Industry Verticals (%) BFSI 43.0 42.8 43.0 43.5 43.0 43.1 42.7 42.9 Manufacturing 7.9 8.2 8.5 8.5 8.4 8.4 8.8 8.6 Telecom 10.3 10.3 9.5 9.3 9.6 9.3 9.6 9.3 Life Sciences & Healthcare 5.3 5.2 5.2 5.1 5.5 5.7 5.9 6.1 Retail & Distribution 13.2 13.4 13.4 13.4 14.0 13.9 13.8 13.5 Transportation 3.7 3.6 3.6 3.4 3.4 3.4 3.5 3.5 Energy and Utilities 3.6 3.6 3.8 3.8 3.7 3.8 3.8 3.8 Media & Entertainment 2.2 2.2 2.1 2.1 2.1 2.2 2.3 2.6 Hi-Tech 6.0 5.9 5.8 5.7 5.5 5.4 5.3 5.3 Others 4.8 4.8 5.1 5.2 4.8 4.8 4.3 4.4 Geographies (%) America 53.5 52.8 52.6 53.2 54.1 53.2 52.7 52.2 UK 17.0 17.1 17.5 16.8 17.0 17.3 17.5 17.8 Rest of Europe 9.6 9.5 9.1 9.4 9.9 11.2 11.6 12.1 Europe 26.6 26.6 26.6 26.2 26.9 28.5 29.1 29.9 India 7.1 7.5 7.6 8.8 7.6 6.9 6.3 6.2 APAC 7.4 7.6 7.5 7.3 6.9 7.1 7.4 7.4 Latin America 3.3 3.4 3.6 2.4 2.4 2.3 2.3 2.2 MEA 2.1 2.1 2.1 2.1 2.1 2.0 2.2 2.1 Others 12.8 13.1 13.2 11.8 11.4 11.4 11.9 11.7 Revenue Mix (%) Offshore 50.5 49.1 49.4 48.3 48.5 48.1 47.8 47.4 Onsite 44.7 45.8 45.6 46.5 46.3 46.5 46.8 47.0 GDC 4.8 5.1 5.0 5.2 5.2 5.4 5.4 5.6 Utilization Excluding Trainees 81.3 81.6 81.7 82.0 82.7 83.4 84.3 83.8 Including Trainees 72.3 72.8 72.1 72.2 72.5 75.0 77.5 77.9 Source: MOSL, Company
  • 6. TCS 13 June 2014 6 Operating Metrics 1QFY13 2QFY13 3QFY13 4QFY13 1QFY14 2QFY14 3QFY14 4QFY14 QoQ growth (%) Service Lines ADM 0.7 3.8 1.7 3.1 3.9 3.9 2.3 0.9 Engineering and Industrial Services 3.0 4.6 5.6 0.9 6.4 5.4 0.8 6.3 Infrastructure Services 5.0 12.5 6.1 6.7 2.4 4.6 4.8 1.9 Enterprise Solutions 3.0 2.5 4.7 5.9 1.4 7.5 5.0 1.9 Global Consulting 6.8 12.0 10.2 -0.1 17.5 -0.6 6.1 1.9 Asset Leverage Solutions -26.0 0.8 7.2 -7.9 4.1 13.9 -12.2 15.2 Assurance Services 7.3 5.9 3.3 4.5 8.1 10.7 3.0 0.7 BPO 16.5 1.3 1.7 -0.2 3.2 5.4 4.8 1.9 Industry Verticals BFSI 5.0 4.1 3.8 4.3 2.9 5.7 2.1 2.4 Manufacturing 3.0 8.5 7.1 3.1 2.9 5.4 7.9 -0.4 Telecom 6.1 4.6 -4.7 1.0 7.5 2.1 6.4 -1.3 Life Sciences & Healthcare 3.0 2.6 3.3 1.1 12.3 9.3 6.6 5.3 Retail & Distribution 8.8 6.2 3.3 3.1 8.8 4.7 2.3 -0.3 Transportation 3.0 1.7 3.3 -2.6 4.1 5.4 6.1 1.9 Energy and Utilities -2.4 4.6 9.1 3.1 1.4 8.3 3.0 1.9 Media & Entertainment 3.0 4.6 -1.4 3.1 4.1 10.5 7.7 15.2 Hi-Tech 3.0 2.8 1.6 1.3 0.4 3.5 1.1 1.9 Others -22.7 4.6 9.8 5.1 -3.9 5.4 -7.7 4.3 Geographies America 2.8 3.2 2.9 4.3 5.9 3.7 2.1 0.9 UK 15.2 5.2 5.8 -1.0 5.3 7.3 4.2 3.6 Rest of Europe 0.9 3.5 -1.0 6.5 9.6 19.3 6.7 6.3 Europe 9.6 4.6 3.3 1.6 6.9 11.7 5.2 4.7 India -13.9 10.5 4.7 19.4 -10.1 -4.3 -5.9 0.3 APAC -1.0 7.4 2.0 0.4 -1.6 8.5 7.4 1.9 Latin America 9.7 7.7 9.4 -31.2 4.1 1.1 3.0 -2.5 MEA 3.0 4.6 3.3 3.1 4.1 0.4 13.3 -2.7 Others 2.2 7.0 4.1 -7.8 0.6 5.4 7.5 0.2 Offshore 5.0 1.2 3.9 -0.5 5.9 5.4 3.0 1.1 Onsite 3.4 6.7 2.8 3.8 5.0 6.7 4.4 2.4 GDC 11.6 10.6 1.2 5.8 5.5 10.3 3.7 5.8 Overall International business 4.6 4.1 3.2 1.8 5.5 6.3 3.7 2.0 Domestic Business -13.9 10.5 4.6 19.6 -10.1 -4.4 -5.8 0.4 Source: MOSL, Company
  • 7. TCS 13 June 2014 7 Financials and valuations Income statement (INR Million) Y/E March 2011 2012 2013 2014 2015E 2016E Sales 373,245 488,938 629,895 818,094 946,723 1,080,484 Change (%) 24.3 31.0 28.8 29.9 15.7 14.1 Cost of Services 198,505 258,773 332,545 422,065 513,543 598,835 SG&A Expenses 62,848 85,988 116,480 144,707 162,539 177,260 EBITDA 111,892 144,177 180,870 251,322 270,642 304,388 % of Net Sales 30.0 29.5 28.7 30.7 28.6 28.2 Depreciation 7,990 9,036 10,792 13,243 15,206 17,242 Other Income 5,247 4,041 11,174 15,891 20,203 28,504 PBT 109,149 139,182 181,252 253,969 275,639 315,650 Tax 21,203 31,688 40,344 60,712 66,153 75,756 Rate (%) 19.4 22.8 22.3 23.9 24.0 24.0 Minority Interest 1,116 1,110 1,494 2,089 2,080 2,080 PAT 86,827 106,384 139,413 191,168 207,406 237,814 Change (%) 26.3 22.5 31.0 37.1 8.5 14.7 Balance sheet (INR Million) Y/E March 2011 2012 2013 2014 2015E 2016E Share Capital 1,957 1,957 1,957 1,959 1,959 1,959 Reserves 250,432 323,276 407,524 551,393 638,273 779,840 Net Worth 252,389 325,233 409,481 553,352 640,232 781,798 Preference shares 1,000 1,000 1,000 0 0 0 Minority Interest 4,663 5,276 6,561 6,905 6,905 6,905 Loans 10,718 12,306 10,894 12,561 14,307 16,133 Capital Employed 268,771 343,815 427,936 572,817 661,443 804,836 Gross Block 86,156 107,400 135,587 170,530 204,717 236,907 Less : Depreciation 33,816 42,852 53,644 66,887 82,092 99,334 Net Block 52,340 64,548 81,944 103,644 122,625 137,573 Other LT Assets 89,929 110,269 88,815 118,105 141,657 160,298 Investments 18,390 0 33,765 37,673 37,673 37,673 Curr. Assets 171,948 237,173 315,022 429,703 562,793 689,659 Debtors 95,479 137,469 172,366 222,360 272,704 310,917 Cash & Bank Balance 47,401 34,617 79,035 156,495 231,377 311,803 Other Current Assets 29,068 65,087 63,621 50,848 58,712 66,939 Current Liab. & Prov 63,837 68,175 91,609 116,308 203,305 220,368 Current Liabilities 63,837 68,175 91,609 116,308 203,305 220,368 Net Current Assets 108,111 168,998 223,413 313,395 359,488 469,291 Application of Funds 268,771 343,815 427,936 572,817 661,443 804,836 E: MOSL Estimates
  • 8. TCS 13 June 2014 8 Financials and valuation Ratios Y/E March 2011 2012 2013 2014 2015E 2016E Basic (INR) EPS 44.4 54.4 71.2 97.6 105.9 121.4 Cash EPS 48.4 59.0 76.7 104.4 113.7 130.2 Book Value 129.5 166.7 209.7 282.5 326.9 399.1 DPS 14.0 25.0 22.0 32.0 37.0 42.0 Payout % 31.6 46.0 30.9 32.8 34.9 34.6 Valuation (x) P/E 49.9 40.7 31.1 22.7 20.9 18.2 Cash P/E 45.7 37.6 28.9 21.2 19.5 17.0 EV/EBITDA 38.2 29.9 23.4 16.5 15.1 13.2 EV/Sales 11.5 8.8 6.7 5.1 4.3 3.7 Price/Book Value 17.1 13.3 10.6 7.8 6.8 5.5 Dividend Yield (%) 0.6 1.1 1.0 1.4 1.7 1.9 Profitability Ratios (%) RoE 37.4 36.7 37.8 39.7 34.8 RoCE 42.2 44.1 44.1 47.6 41.4 Turnover Ratios Debtors (Days) 81 87 90 88 95 99 Fixed Asset Turnover (x) 7.9 8.4 8.6 8.8 8.4 8.3 Cash flow statement (INR Million) Y/E March 2011 2012 2013 2014 2015E 2016E CF from Operations 94,817 115,419 150,205 204,411 222,611 255,056 Cash for Working Capital 18,165 -73,671 -9,997 -12,522 28,789 -29,377 Net Operating CF 112,982 41,747 140,208 191,890 251,401 225,679 Net Purchase of FA -53,633 -41,584 -6,733 -64,233 -57,739 -50,831 Net Purchase of Invest. 19,409 18,390 -33,765 -3,909 0 0 Net Cash from Invest. -34,224 -23,193 -40,498 -68,142 -57,739 -50,831 Proc. from equity issues -11,155 24,319 -3,504 25,371 -35,736 0 Proceeds from LTB/STB 1,608 1,588 -1,412 1,666 1,746 1,826 Dividend Payments -32,058 -57,246 -50,377 -73,325 -84,790 -96,248 Cash Flow from Fin. -41,604 -31,339 -55,292 -46,287 -118,780 -94,421 Free Cash Flow 59,349 164 133,475 127,656 193,662 174,847 Net Cash Flow 37,153 -12,785 44,418 77,461 74,882 80,426 Opening Cash Bal. 10,249 47,402 34,617 79,035 156,495 231,377 Add: Net Cash 37,153 -12,785 44,418 77,461 74,882 80,426 Closing Cash Bal. 47,402 34,617 79,035 156,495 231,377 311,803 E: MOSL Estimates
  • 9. TCS 13 June 2014 9 N O T E S
  • 10. TCS 13 June 2014 10 Disclosures This report is for personal information of the authorized recipient and does not construe to be any investment, legal or taxation advice to you. This research report does not constitute an offer, invitation or inducement to invest in securities or other investments and Motilal Oswal Securities Limited (hereinafter referred as MOSt) is not soliciting any action based upon it. This report is not for public distribution and has been furnished to you solely for your information and should not be reproduced or redistributed to any other person in any form. Unauthorized disclosure, use, dissemination or copying (either whole or partial) of this information, is prohibited. The person accessing this information specifically agrees to exempt MOSt or any of its affiliates or employees from, any and all responsibility/liability arising from such misuse and agrees not to hold MOSt or any of its affiliates or employees responsible for any such misuse and further agrees to hold MOSt or any of its affiliates or employees free and harmless from all losses, costs, damages, expenses that may be suffered by the person accessing this information due to any errors and delays. The information contained herein is based on publicly available data or other sources believed to be reliable. While we would endeavour to update the information herein on reasonable basis, MOSt and/or its affiliates are under no obligation to update the information. Also there may be regulatory, compliance, or other reasons that may prevent MOSt and/or its affiliates from doing so. MOSt or any of its affiliates or employees shall not be in any way responsible and liable for any loss or damage that may arise to any person from any inadvertent error in the information contained in this report. MOSt or any of its affiliates or employees do not provide, at any time, any express or implied warranty of any kind, regarding any matter pertaining to this report, including without limitation the implied warranties of merchantability, fitness for a particular purpose, and non-infringement. The recipients of this report should rely on their own investigations. This report is intended for distribution to institutional investors. Recipients who are not institutional investors should seek advice of their independent financial advisor prior to taking any investment decision based on this report or for any necessary explanation of its contents. MOSt and/or its affiliates and/or employees may have interests/positions, financial or otherwise in the securities mentioned in this report. To enhance transparency, MOSt has incorporated a Disclosure of Interest Statement in this document. This should, however, not be treated as endorsement of the views expressed in the report. Disclosure of Interest Statement TATA CONSULTANCY SVCS LTD 1. Analyst ownership of the stock No 2. Group/Directors ownership of the stock No 3. Broking relationship with company covered No 4. Investment Banking relationship with company covered No Analyst Certification The views expressed in this research report accurately reflect the personal views of the analyst(s) about the subject securities or issues, and no part of the compensation of the research analyst(s) was, is, or will be directly or indirectly related to the specific recommendations and views expressed by research analyst(s) in this report. The research analysts, strategists, or research associates principally responsible for preparation of MOSt research receive compensation based upon various factors, including quality of research, investor client feedback, stock picking, competitive factors and firm revenues. Regional Disclosures (outside India) This report is not directed or intended for distribution to or use by any person or entity resident in a state, country or any jurisdiction, where such distribution, publication, availability or use would be contrary to law, regulation or which would subject MOSt & its group companies to registration or licensing requirements within such jurisdictions. For U.K. This report is intended for distribution only to persons having professional experience in matters relating to investments as described in Article 19 of the Financial Services and Markets Act 2000 (Financial Promotion) Order 2005 (referred to as "investment professionals"). This document must not be acted on or relied on by persons who are not investment professionals. Any investment or investment activity to which this document relates is only available to investment professionals and will be engaged in only with such persons. For U.S. Motilal Oswal Securities Limited (MOSL) is not a registered broker - dealer under the U.S. Securities Exchange Act of 1934, as amended (the"1934 act") and under applicable state laws in the United States. In addition MOSL is not a registered investment adviser under the U.S. Investment Advisers Act of 1940, as amended (the "Advisers Act" and together with the 1934 Act, the "Acts), and under applicable state laws in the United States. Accordingly, in the absence of specific exemption under the Acts, any brokerage and investment services provided by MOSL, including the products and services described herein are not available to or intended for U.S. persons. This report is intended for distribution only to "Major Institutional Investors" as defined by Rule 15a-6(b)(4) of the Exchange Act and interpretations thereof by SEC (henceforth referred to as "major institutional investors"). This document must not be acted on or relied on by persons who are not major institutional investors. Any investment or investment activity to which this document relates is only available to major institutional investors and will be engaged in only with major institutional investors. In reliance on the exemption from registration provided by Rule 15a-6 of the U.S. Securities Exchange Act of 1934, as amended (the "Exchange Act") and interpretations thereof by the U.S. Securities and Exchange Commission ("SEC") in order to conduct business with Institutional Investors based in the U.S., MOSL has entered into a chaperoning agreement with a U.S. registered broker-dealer, Motilal Oswal Securities International Private Limited. ("MOSIPL"). Any business interaction pursuant to this report will have to be executed within the provisions of this chaperoning agreement. The Research Analysts contributing to the report may not be registered /qualified as research analyst with FINRA. Such research analyst may not be associated persons of the U.S. registered broker- dealer, MOSIPL, and therefore, may not be subject to NASD rule 2711 and NYSE Rule 472 restrictions on communication with a subject company, public appearances and trading securities held by a research analyst account. For Singapore Motilal Oswal Capital Markets Singapore Pte Limited is acting as an exempt financial advisor under section 23(1)(f) of the Financial Advisers Act(FAA) read with regulation 17(1)(d) of the Financial Advisors Regulations and is a subsidiary of Motilal Oswal Securities Limited in India. This research is distributed in Singapore by Motilal Oswal Capital Markets Singapore Pte Limited and it is only directed in Singapore to accredited investors, as defined in the Financial Advisers Regulations and the Securities and Futures Act (Chapter 289), as amended from time to time. In respect of any matter arising from or in connection with the research you could contact the following representatives of Motilal Oswal Capital Markets Singapore Pte Limited: Anosh Koppikar Kadambari Balachandran Email:anosh.Koppikar@motilaloswal.com Email : kadambari.balachandran@motilaloswal.com Contact(+65)68189232 Contact: (+65) 68189233 / 65249115 Office Address:21 (Suite 31),16 Collyer Quay,Singapore 04931 Motilal Oswal Securities Ltd Motilal Oswal Tower, Level 9, Sayani Road, Prabhadevi, Mumbai 400 025 Phone: +91 22 3982 5500 E-mail: reports@motilaloswal.com