Q3 2024 Earnings Conference Call and Webcast Slides
Upl ru2 qfy2011-261010
1. Please refer to important disclosures at the end of this report 1
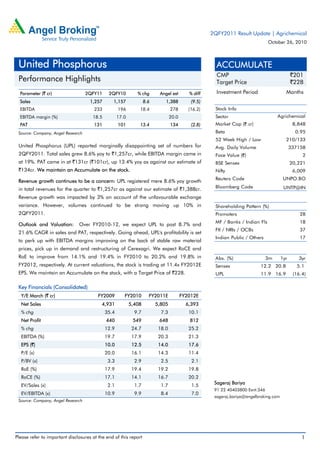
Parameter (` cr) 2QFY11 2QFY10 % chg Angel est % diff
Sales 1,257 1,157 8.6 1,388 (9.5)
EBITDA 233 196 18.4 278 (16.2)
EBITDA margin (%) 18.5 17.0 20.0
PAT 131 101 13.4 134 (2.8)
Source: Company, Angel Research
United Phosphorus (UPL) reported marginally disappointing set of numbers for
2QFY2011. Total sales grew 8.6% yoy to `1,257cr, while EBITDA margin came in
at 19%. PAT came in at `131cr (`101cr), up 13.4% yoy as against our estimate of
`134cr. We maintain an Accumulate on the stock.
Revenue growth continues to be a concern: UPL registered mere 8.6% yoy growth
in total revenues for the quarter to `1,257cr as against our estimate of `1,388cr.
Revenue growth was impacted by 3% on account of the unfavourable exchange
variance. However, volumes continued to be strong moving up 10% in
2QFY2011.
Outlook and Valuation: Over FY2010-12, we expect UPL to post 8.7% and
21.6% CAGR in sales and PAT, respectively. Going ahead, UPL's profitability is set
to perk up with EBITDA margins improving on the back of stable raw material
prices, pick up in demand and restructuring of Cerexagri. We expect RoCE and
RoE to improve from 14.1% and 19.4% in FY2010 to 20.2% and 19.8% in
FY2012, respectively. At current valuations, the stock is trading at 11.4x FY2012E
EPS. We maintain an Accumulate on the stock, with a Target Price of `228.
Key Financials (Consolidated)
Y/E March (` cr) FY2009 FY2010 FY2011E FY2012E
Net Sales 4,931 5,408 5,805 6,393
% chg 35.4 9.7 7.3 10.1
Net Profit 440 549 648 812
% chg 12.9 24.7 18.0 25.2
EBITDA (%) 19.7 17.9 20.3 21.3
EPS (`) 10.0 12.5 14.0 17.6
P/E (x) 20.0 16.1 14.3 11.4
P/BV (x) 3.3 2.9 2.5 2.1
RoE (%) 17.9 19.4 19.2 19.8
RoCE (%) 17.1 14.1 16.7 20.2
EV/Sales (x) 2.1 1.7 1.7 1.5
EV/EBITDA (x) 10.9 9.9 8.4 7.0
Source: Company, Angel Research
ACCUMULATE
CMP `201
Target Price `228
Investment Period Months
Stock Info
Sector
Bloomberg Code
Shareholding Pattern (%)
Promoters 28
MF / Banks / Indian Fls 18
FII / NRIs / OCBs 37
Indian Public / Others 17
Abs. (%) 3m 1yr 3yr
Sensex 12.2 20.8 5.1
UPL 11.9 16.9 (16.4)
Face Value (`)
BSE Sensex
Nifty
Reuters Code
8,848
0.95
210/133
337158
Agrichemical
Avg. Daily Volume
Market Cap (` cr)
Beta
52 Week High / Low
2
20,221
6,009
UNPO.BO
UNTP@IN
Sageraj Bariya
91 22 40403800 Exnt:346
sageraj.bariya@angelbroking.com
United Phosphorus
Performance Highlights
2QFY2011 Result Update | Agrichemical
October 26, 2010
2. United Phosphorus | 2QFY2011 Result Update
October 26, 2010 2
Exhibit 1: Quarterly performance
Y/E March (` cr) 2QFY11 2QFY10 % chg 1HFY11 1HFY10 % chg
Total Sales 1,225 1,118 2,655 2,733
Other Op Income 32 39 71 62
Net Revenues 1,257 1,157 8.6 2,725 2,795 (2.5)
Raw material cost 614 609 0.8 1,378 1,564 (11.9)
Gross Profit 611 509 20.1 1,277 1,169 9.2
Gross margin 50 46 48 43
Employee Expenses 119 120 (1.0) 252 244 3.1
as % of sales 9 10 9 9
Other expenditure 292 232 25.9 573 483 18.7
as % of sales 23 20 21 17
Total Expenditure 1,024 961 6.6 2,204 2,291 (3.8)
Operating Profit 233 196 18.4 522 503 3.6
OPM (%) 18.5 17.0 19.1 18.0
Depreciation 51 55 99 105
EBIT 181 142 27.8 423 399 6.1
EBIT (%) 14.4 12.3 15.5 14.3
Other income 24 4 42 11
Interest 65 40 115 98
PBT (excl of Ext items) 140 105 351 311 12.9
Ext items - - (51) -
PBT (incl of Ext items) 140 105 300 311
Tax 25 17 41 43
Reported PAT 115 89 29.1 259 268 (3.1)
Minority & Associate 4 15 5 12
Net PAT 115 101 13.3 257 277
Adj PAT 131 101 29.2 257 277 (7.4)
Report EPS (`) 2.6 2.0 28.7 5.9 6.1 (3.4)
Adj EPS (`) 3.0 2.3 28.7 5.8 6.3 (7.6)
Source: Company, Angel Research
Regaining pricing power - Realisations stablising
Total revenues grew 8.6% yoy to `1,257cr as against our estimate of `1,388cr.
Revenue growth was restricted due to the exchange variance (-3% yoy) and
de-growth in North America (NA) and Europe (EU) on account of adverse weather
conditions (that prevent germination of pest). NA de-grew by 7%, while EU
de-grew by 25% during the quarter.
3. United Phosphorus | 2QFY2011 Result Update
October 26, 2010 3
Exhibit 2: Revenue performance
Source: Company, Angel Research
Exhibit 3: Revenue growth (2QFY2011)
Source: Company, Angel Research
Realisations during the quarter were stable, which is a positive given that the
company has been witnessing a decline in realisations since the past few quarters.
We believe that the company is regaining pricing power.
Exhibit 4: Volume, realisation break up (qoq)
Source: Company, Angel Research
Overall, with realisations stabilising and the company registering good volumes
since 3QFY2010, we believe that 2HFY2011 would be better than 1HFY2011.
Exhibit 5: Regional performance
Source: Company, Angel Research
Exhibit 6: Regional mix
Source: Company, Angel Research
0
6
(1)
(10)
9
(15)
0
15
30
-
300
600
900
1,200
1,500
1,800
2QFY10
3QFY10
4QFY10
1QFY11
2QFY11
(%)
(`cr)
Net Sales % YoY
(3)
0
10
(4)
(2)
0
2
4
6
8
10
12
Exchange impact Realisation Volume
(%)
(5)
(13)
(5)
(7)
0
2
18
14
2
10
(15)
(10)
(5)
0
5
10
15
20
2QFY10 3QFY10 4QFY10 1QFY11 2QFY11
(%)
Realisation Volume
0
100
200
300
400
500
600
North America India EU RoW
(`cr)
2QFY10 3QFY10 4QFY10 1QFY11 2QFY11
0%
20%
40%
60%
80%
100%
2QFY10
3QFY10
4QFY10
1QFY11
2QFY11
North America India EU RoW
4. United Phosphorus | 2QFY2011 Result Update
October 26, 2010 4
Higher other expense restricts improvement in OPM
OPM improved by 150bp to 18.5% during the quarter. Higher other expenses
restricted expansion in OPM even though the company recorded strong 400bp
improvement in gross margins during the quarter.
Exhibit 7: Margin trend
Source: Company, Angel Research
Exhibit 8: Higher other expenses
Source: Company, Angel Research
46
48
44
47
50
14
18
22
26
30
40
42
44
46
48
50
2QFY10 3QFY10 4QFY10 1QFY11 2QFY11
(%)
(%)
Gross Margin (LHS) EBITDA Margin (RHS)
20
22
7
19
23
0
5
10
15
20
25
50
110
170
230
290
2QFY10 3QFY10 4QFY10 1QFY11 2QFY11
(%)
(`cr)
Other cost % of sales
5. United Phosphorus | 2QFY2011 Result Update
October 26, 2010 5
Earnings in line with estimate
PAT for the quarter came in at `115cr (`89cr), a yoy increase of 13.4%. PAT
growth was restricted on account of forex losses of `16cr. Adjusted PAT stood at
`131cr (`101cr) and in line with our estimate of `134cr.
Exhibit 9: PAT trend
Source: Company, Angel Research
Conference call – Key takeaways
• Management maintained its revenue guidance of 8-10% (organic) and 15%
on inorganic basis for the full year and expansion of EBITDA margin of 200bp
over FY2010.
• India (45% yoy growth in 2QFY2011) and RoW (23% yoy growth in
2QFY2011) would be the key contributors of growth in 2HFY2011.
• The company is targeting profit growth of 30% over the next 2-3 years; expects
to clock 20-25% growth in FY2011.
• Strong balance sheet with net cash of ~`2,000cr at the end of 2QFY2011.
101
64
374
192
131
-50
0
50
100
150
200
0
80
160
240
320
400
2QFY10 3QFY10 4QFY10 1QFY11 2QFY11
(%)
(`cr)
Adj PAT % YoY
6. United Phosphorus | 2QFY2011 Result Update
October 26, 2010 6
Investment Arguments
Innovators dominant in off-patent space - Generic firms in
sweet spot
The global agrichem industry, valued at US $40bn (CY2008), is dominated by the
top-6 innovators, viz. Bayer, Syngenta, Monsanto, BASF, DuPont and Dow, which
enjoy large market share of patented (28%) and off-patent market (32%).
Pertinently, the top-6 innovators also enjoy a large share of the off-patent market
due to the high entry barriers for the pure generic players. Thus, 1/3rd of the total
pie worth US $13bn (controlled by the top-6 innovators through proprietary off-
patent products) provides high growth opportunity for the larger integrated generic
players like UPL.
Generic segment market share to increase
The generic players have been garnering high market share, increasing from 32%
levels in 1998 to 40% by end 2006. Over 1998-2006, while industry registered
CAGR of 3%, generic players outpaced industry posting CAGR of 6% during the
period. Going ahead, given the opportunities and drop in rate of new molecule
introduction by the innovators, we expect the generic players to continue to
outpace industry growth and increase their market share in the overall pie.
Historically, the global agrichem players have been logging in-line growth with
global GDP. Going ahead, over CY2009-11E, the global economy is expected to
grow at around 3-4%. Assuming this trend plays out in terms of growth for the
agrichem industry and the same rate of genericisation occurs, the agrichemical
generic industry could log in 6-8% yoy growth during the period and garner
market share of 44-45%.
A global generic play
UPL figures among the top-5 global generic agrichemical players with a presence
across major markets including the US, EU, Latina America and India. Given the
high entry barriers by way of high investments, entry of new players is also
restricted. Thus, amidst this scenario and on account of having a low cost base, we
believe that UPL enjoys an edge over competition and is placed in sweet spot to
leverage the upcoming opportunities in the global generic space.
Outlook and Valuation
The agriculture sector, in the last few years, has been rejuvenating globally on the
back of rising food prices. Food security is also top priority for most governments,
while reducing food loss is one of the easiest ways to boost food inventory. Hence,
we believe that the agrichemical companies would continue to do well in wake of
heightened food security risks and strong demand is likely to be witnessed across
the world. Overall, we expect the global agrichemical industry to perform well
from here on. However, generics are expected to register healthy growth on
account of: a) increasing penetration and wresting market share from innovators,
and b) patent expiries worth US $3-4bn (2007) during 2009-14.
7. United Phosphorus | 2QFY2011 Result Update
October 26, 2010 7
Over FY2010-12, we expect UPL to post 8.7% and 21.6% CAGR in sales and PAT,
respectively. Going ahead, UPL's profitability is set to perk up with EBITDA margins
improving on the back of stable raw material prices, pickup in demand and
restructuring of Cerexagri. We expect RoCE and RoE to improve from 14.1% and
19.4% in FY2010 to 20.2% and 19.8% in FY2012, respectively. At current
valuations, the stock is trading at 11.4x FY2012E EPS. We maintain an Accumulate
on the stock, with a Target Price of `228.
Exhibit 10: Key Assumption
Geographic Sales growth (%) FY11E FY12E Comment
North America (3.2) 5.0 Adverse weather condition impacting demand and volume growth
India 22.3 15.0 Robust volume growth on account of normal monsoon
EU (7.0) 4.0 Adverse weather condition impacting demand and volume growth
RoW 11.6 15.0 Drying up of distributor inventory to boost demand
Total 5.6 10.1
EBITDA margin 20.3 21.3 Stable raw material price & realisation coupled with restructuring to improve margin
Tax rate 18 23
Source: Company, Angel Research
Exhibit 11: Peer Valuation
Company Reco Mcap CMP TP Upside P/E EV/Sales EV/EBITDA RoE (%) CAGR (%) (FY10-12E)
(` cr) (`) (`) (%) FY11E FY12E FY11E FY12E FY11E FY12E FY11E FY12E Sales PAT
Rallis Neutral 2,801 1,436 - - 19.6 15.2 2.4 2.0 12.6 10.7 30.4 32.1 21.3 36.5
BCS Neutral 4,182 1,059 - - 24.5 20.5 2.1 1.8 16.3 13.8 26.9 25.7 15.3 22.8
UPL Accumulate 9,279 201 228 14 14.3 11.4 1.7 1.5 8.4 7.0 19.2 19.8 8.7 21.6
NACL Not Rated 298 200 - - 8.9 4.9 0.6 0.5 4.3 2.7 15.5 23.7 9.3 0.1
Source: Company, Bloomberg, Angel Research
13. United Phosphorus | 2QFY2011 Result Update
October 26, 2010 13
Research Team Tel: 022 - 4040 3800 E-mail: research@angeltrade.com Website: www.angeltrade.com
DISCLAIMER
This document is solely for the personal information of the recipient, and must not be singularly used as the basis of any investment
decision. Nothing in this document should be construed as investment or financial advice. Each recipient of this document should make
such investigations as they deem necessary to arrive at an independent evaluation of an investment in the securities of the companies
referred to in this document (including the merits and risks involved), and should consult their own advisors to determine the merits and
risks of such an investment.
Angel Broking Limited, its affiliates, directors, its proprietary trading and investment businesses may, from time to time, make
investment decisions that are inconsistent with or contradictory to the recommendations expressed herein. The views contained in this
document are those of the analyst, and the company may or may not subscribe to all the views expressed within.
Reports based on technical and derivative analysis center on studying charts of a stock's price movement, outstanding positions and
trading volume, as opposed to focusing on a company's fundamentals and, as such, may not match with a report on a company's
fundamentals.
The information in this document has been printed on the basis of publicly available information, internal data and other reliable
sources believed to be true, but we do not represent that it is accurate or complete and it should not be relied on as such, as this
document is for general guidance only. Angel Broking Limited or any of its affiliates/ group companies shall not be in any way
responsible for any loss or damage that may arise to any person from any inadvertent error in the information contained in this report.
Angel Broking Limited has not independently verified all the information contained within this document. Accordingly, we cannot testify,
nor make any representation or warranty, express or implied, to the accuracy, contents or data contained within this document. While
Angel Broking Limited endeavours to update on a reasonable basis the information discussed in this material, there may be regulatory,
compliance, or other reasons that prevent us from doing so.
This document is being supplied to you solely for your information, and its contents, information or data may not be reproduced,
redistributed or passed on, directly or indirectly.
Angel Broking Limited and its affiliates may seek to provide or have engaged in providing corporate finance, investment banking or
other advisory services in a merger or specific transaction to the companies referred to in this report, as on the date of this report or in
the past.
Neither Angel Broking Limited, nor its directors, employees or affiliates shall be liable for any loss or damage that may arise from or in
connection with the use of this information.
Note: Please refer to the important `Stock Holding Disclosure' report on the Angel website (Research Section). Also, please
refer to the latest update on respective stocks for the disclosure status in respect of those stocks. Angel Broking Limited and
its affiliates may have investment positions in the stocks recommended in this report.
Disclosure of Interest Statement United Phosphorus
1. Analyst ownership of the stock No
2. Angel and its Group companies ownership of the stock No
3. Angel and its Group companies' Directors ownership of the stock No
4. Broking relationship with company covered No
Ratings (Returns): Buy (> 15%) Accumulate (5% to 15%) Neutral (-5 to 5%)
Reduce (-5% to 15%) Sell (< -15%)
Note: We have not considered any Exposure below ` 1 lakh for Angel, its Group companies and Directors