Chapter 2.ppt of macroeconomics by mankiw 9th edition
Hero Honda
1. 1QFY2011Result Update | Automobile
July 30 2010
Hero Honda ACCUMULATE
CMP Rs1,815
Performance Highlights Target Price Rs1,966
Y/E March (Rs cr) 1QFY11 1QFY10 % chg (yoy) Angel Est. % Diff. Investment Period 12 Months
Net Sales 4,297 3,822 12 4,312 (0.4)
Stock Info
Operating Profit 603 650 (7) 650 (7.3)
Sector Automobile
OPM (%) 14.0 17.0 (298)bp 15.1 (105)bp
Market Cap (Rs cr) 36,251
Reported PAT 492 500 (2) 596 (17.5)
Beta 0.7
Source: Company, Angel Research
52 Week High / Low 2,094/1,345
For 1QFY2011, Hero Honda (HH) reported decent performance on top-line front, Avg. Daily Volume 72,149
while operating performance and bottom-line came in below expectation. OPM
Face Value (Rs) 2
was impacted largely due to higher input cost, which in turn resulted in poor
BSE Sensex 17,868
bottom-line performance. We revise our OPM estimates downwards to account
for margin pressure due to the increasing raw material prices. Owing to the Nifty 5,368
recent decline in the price, we recommend an Accumulate on the stock. Reuters Code HROH.BO
Bloomberg Code HH@IN
Top-line in line, net profit dips on input cost pressure: For 1QFY2011, HH
registered 12% yoy growth in net sales to Rs4,297cr (Rs3,822cr), which was in line
with our expectation. The growth was largely aided by the 10.3% yoy jump in Shareholding Pattern (%)
volumes and marginal 1.5% yoy increase in net realisation (owing to hike in
Promoters 52.2
excise duty). HH reported 7.3% yoy dip in operating profits, where OPM fell by a
MF / Banks / Indian Fls 7.4
substantial 298bp yoy on input cost pressure. OPM came in below expectation,
with raw material cost increasing by 345bp yoy. Thus, net profit came in below FII / NRIs / OCBs 31.3
our expectation at Rs492cr, on lower-than-expected OPM. Indian Public / Others 9.1
Outlook and Valuation: We maintain our volume growth estimate and model the
company to record around 12% CAGR in revenues over FY2010-12E, aided by Abs. (%) 3m 1yr 3yr
around 9% CAGR in volumes during the period. We revise our OPM estimates
Sensex 1.8 16.1 17.1
downwards to account for margin pressure due to the increasing raw material
Hero Honda 1.9 14.1 164.5
prices. We expect net profit to register moderate CAGR of 7% over FY2010-12E
on account of the tax benefits availed by HH at its Uttaranchal plant. However, we
believe that this will not be able to compensate for the drop in market share and
leaves limited room for earnings upgrade. We recommend an Accumulate with a
Target Price of Rs1,966, at which level the stock would trade at 15.3x FY2012E
earnings (10% discount to our Sensex target multiple of 17x).
Key Financials
Y/E March (Rs cr) FY2009 FY2010 FY2011E FY2012E
Net Sales 12,319 15,758 17,717 19,291
% chg 19.2 27.9 12.4 8.9
Net Profit 1,282 2,232 2,261 2,567
% chg 32.4 74.1 1.3 13.5
OPM (%) 13.9 16.9 15.2 15.6
EPS (Rs) 64.2 111.8 113.2 128.5
P/E (x) 28.3 16.2 16.0 14.1 Vaishali Jajoo
P/BV (x) 9.5 9.6 7.8 6.5 022-4040 3800 Ext: 344
RoE (%) 37.8 58.9 53.7 50.2 vaishali.jajoo@angeltrade.com
RoCE (%) 42.1 61.6 55.0 51.6
Yaresh Kothari
EV/Sales (x) 2.4 1.9 1.6 1.4
022-4040 3800 Ext: 313
EV/EBITDA (x) 19.1 12.0 11.7 10.1 yareshb.kothari@angeltrade.com
Source: Company, Angel Research
Please refer to important disclosures at the end of this report 1
2. Hero Honda |1QFY2011 Result Update
Exhibit 1: Quarterly performance
Y/E March (Rs cr) 1QFY11 1QFY10 % chg FY10 FY09 % chg
Total Volume (units) 1,234,039 1,118,987 10.3 4,533,680 3,722,000 21.8
Net Sales 4,297 3,822 12.4 15,758 12,319 27.9
Consumption of RM 3,059 2,590 18.1 10,736 8,742 22.8
(% of Sales) 71.2 67.7 345.4 68.1 71.0 -
Staff Costs 145.0 138.5 4.7 560.3 448.7 24.9
(% of Sales) 3.4 3.6 - 3.6 3.6 -
Other Expenses 489.7 444.1 10.3 1,797 1,417 26.8
(% of Sales) 11.4 11.6 - 11.4 11.5 -
Total Expenditure 3,694 3,172 16.4 13,094 10,607 23.4
Operating Profit 602.5 650.1 (7.3) 2,665 1,712 55.7
OPM 14.0 17.0 - 16.9 13.9 -
Interest (2.7) (5.5) (51.3) (20.6) (31.7) (34.9)
Depreciation 48.3 45.6 5.9 191.5 180.7 6.0
Other Income 53.4 42.5 25.8 338.0 218.7 54.5
PBT (excl. Extr. Items) 610.3 652.5 (6.5) 2,832 1,782 59.0
Extr. Income/(Expense) - - - - - -
PBT (incl. Extr. Items) 610.3 652.5 (6.5) 2,832 1,782 59.0
(% of Sales) 14.2 17.1 - 18.0 14.5 -
Provision for Taxation 118.7 152.4 (22.1) 599.9 499.7 20.1
(% of PBT) 19.4 23.4 - 21.2 28.1 -
Reported PAT 491.7 500.1 (1.7) 2,232 1,282 74.1
PATM 11.4 13.1 - 14.2 10.4 -
Equity capital (cr) 39.9 39.9 - 39.9 39.9 -
EPS (Rs) 24.6 25.0 (1.7) 111.8 64.2 74.1
Source: Company, Angel Research
Top-line in-line, volumes up 10% yoy: For 1QFY2010, Hero Honda (HH) clocked a
12.4% growth in net sales to Rs4,297cr (Rs3,822cr), which was in line with our
estimates. Sales increased primarily on the back of 10.3% growth in volumes and
a marginal 1.5% increase in yoy average net realisation of around Rs34,558 per
bike (compared to Rs34,058 last year).
Exhibit 2: Slowdown in volume growth... Exhibit 3: ... led to lower sales growth
(units) Total Volume % yoy growth (RHS) (%) (Rs cr) Net Sales (LHS) Net Sales Growth (RHS) (%)
1,260,000 45 5,000 40
34.1 32.8
4,000 30
1,170,000 29.6 30
25.1
27.3
3,000 20
21.7 18.9 20.4
1,080,000 15
2,000 12.4 10
10.3
990,000 0 1,000 0
1QFY10 2QFY10 3QFY10 4QFY10 1QFY11 1QFY10 2QFY10 3QFY10 4QFY10 1QFY11
Source: Company, Angel Research Source: Company, Angel Research
July 30 2010 2
3. Hero Honda |1QFY2011 Result Update
Margin contraction seen on higher input cost: On the operating margin front, the
company has seen a contraction of 298bp, on the back of increase in raw material
costs. Optimal operating leverage however, supported the marginal decline in staff
cost and other expenditure. Other expenditure declined by 22bp yoy during the
quarter, due to relatively lower advertising expenditure, while staff cost declined by
25bp yoy. HH reported 7.3% yoy decline in operating profit to Rs603cr (Rs650cr)
in 1QFY2011.
On the operating front, the company reported 7.3% yoy dip in EBITDA, where
operating margins fell by a substantial 298bp yoy on input cost pressure.
Operating margins came in below expectation, with raw material cost increasing
by 345bp yoy and accounted for 71.2% (67.7%) of sales. Thus, net profit came in
below our expectation at Rs492cr, on lower-than-expected OPM.
Exhibit 4: EBITDA margins dip on input cost pressures Exhibit 5: Unexpected fall in net profit
(%) EBITDA Margin Raw Material Cost/Sales (Rs cr) Net Profit (LHS) Net Profit Margin (RHS) (%)
700 14.7 14.5 16
100 14.0
13.1
71.7 11.4
68.0 68.4 68.5 67.6 525 12
75
50 350 8
17.0 18.3 17.3 17.3
25 14.0 175 4
0 0 0
1QFY10 2QFY10 3QFY10 4QFY10 1QFY11 1QFY10 2QFY10 3QFY10 4QFY10 1QFY11
Source: Company, Angel Research Source: Company, Angel Research
Net Profit below expectation: HH reported a 1.7% decline in net profit to Rs492cr
(Rs500cr) during 1QFY2011, owing to the contraction in OPM. However, lower tax
provision arising from the commencement of its Haridwar plant and higher other
income (mainly comprised treasury gains, which increased by 25.8% yoy to
Rs53.4cr (Rs42.5cr) for 1QFY2011) arrested further decline in net profit during the
quarter.
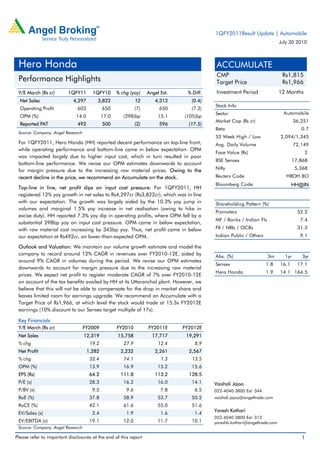
Market share reduced in 1QFY2011; future outlook cautious: HH’s domestic
Motorcycle Segment market share of 54% at the end of 1QFY2011 has come
down from about 62.1% at the end of 1QFY2010. The company has guided to
clock five million motorcycles Sales Volume in FY2011E. The Scooter Segment
recorded Volume growth of ~57% yoy during 1QFY2011, with its new launch,
Pleasure, selling about 20,000 units per month. Market share in scooter segment
also has shown an increase of 83bp yoy to 15.3%.
July 30 2010 3
4. Hero Honda |1QFY2011 Result Update
Exhibit 6: Hero Honda market share trend
(%) Scooter Motor-cycle Total 2-wheeler
80
62.1 60.4
57.3
60 54.8 54.0
51.3 49.7
40 47.0
44.8 44.2
20 14.5 15.1 14.6 15.3
12.8
0
1QFY10 2QFY10 3QFY10 4QFY10 1QFY11
Source: Company, Angel Research, SIAM
Investment Arguments
Demand momentum continues; base effect arrest higher growth: In view of
the normal monsoon and increased penetration in rural market, we believe
demand momentum to remain strong over FY2011. The management has
also guided for volumes to exceed 5 mn units in the current fiscal, implying
growth of 8-9% yoy.
Haridwar plant to ramp-up production: HH commenced expansion plans at its
Haridwar in Uttarakhand, with the first plant commissioned in April 2008 with
an initial capacity of 500,000 units. The company aims to increase its total
installed capacity to 5.7 million (from 5.4 million) by August 2010. This will be
done through an incremental investment of Rs130cr at its third and newest
plant at Haridwar. This plant also avails of tax benefits, including a 100%
Excise exemption for 10 years, and a 100% Income Tax exemption for the first
five years and 30% for the next five years.
The company has two plants in the Gurgaon area, besides the one at
Haridwar, which enjoy tax benefits. Due to the increasing production levels at
the Haridwar plant, the company's overall tax rate for FY2010 has come down
to 21.2% from 28% in the previous fiscal and would further come down by 2-
3% in over FY2011-12.
July 30 2010 4
5. Hero Honda |1QFY2011 Result Update
Outlook and Valuation
Over FY2007-10, HH gained 6(12)% market share benefiting from Bajaj and TVS’
product failures and strong rural demand. However, competition is now rising as is
evident by continued strong retail demand for new launches from BAL and HMSI.
HH’s domestic market share in the motor cycles segment has dropped to 54% in
FY2010 from 63% in FY2009. Further, the economic improvement in FY2011 is
likely to be led by urban demand where BAL has a better presence. We see HH’s
market share declining to around 50 (54-55)% in FY2011. With industry estimated
to clock a growth of ~14-15%, we believe HH’s volume growth will slow to single-
digits in FY2011.
Exhibit 7: Change in estimates
Y/E March Earlier Estimates Revised Estimates % chg
FY2011E FY2012E FY2011E FY2012E FY2011E FY2012E
Net Sales (Rs cr) 17,332 19,184 17,717 19,291 2.2 0.6
OPM (%) 16.5 16.3 15.2 15.6 (132)bp (65)bp
EPS (Rs) 120.3 131.4 113.2 128.5 (5.9) (2.2)
Source: Company, Angel Research
We maintain our volume growth estimate and model the company to record
around 12% CAGR in Revenues over FY2010-12E, aided by around 9% CAGR in
Volumes during the period. We revise our OPM estimates downward to account for
margin pressure due to the increasing raw material prices (aluminum and steel).
We expect Net Profit to register moderate CAGR of 7% over FY2010-12E on
account of the Tax benefits availed by HH at its new plant in Uttaranchal. (HH has
increased capacity at its Haridwar plant to 1.8mn units and targets to produce
1.7mn units there in FY2011, up from 1.3mn units in FY2010. This will mitigate the
impact of cost pressure on earnings to certain extent.) However, we believe that this
will not be able to compensate for the drop in market-share and leaves limited
room for earning upgrade.
We recommend an Accumulate on the stock owing to the recent decline in the
price, with a Target Price of Rs1,966 at which level the stock would trade at 15.3x
FY2012E earnings (10% discount to our Sensex target multiple of 17x).
July 30 2010 5
12. Hero Honda |1QFY2011 Result Update
Research Team Tel: 022 - 4040 3800 E-mail: research@angeltrade.com Website: www.angeltrade.com
DISCLAIMER
This document is solely for the personal information of the recipient, and must not be singularly used as the basis of any investment
decision. Nothing in this document should be construed as investment or financial advice. Each recipient of this document should make
such investigations as they deem necessary to arrive at an independent evaluation of an investment in the securities of the companies
referred to in this document (including the merits and risks involved), and should consult their own advisors to determine the merits and
risks of such an investment.
Angel Broking Limited, its affiliates, directors, its proprietary trading and investment businesses may, from time to time, make
investment decisions that are inconsistent with or contradictory to the recommendations expressed herein. The views contained in this
document are those of the analyst, and the company may or may not subscribe to all the views expressed within.
Reports based on technical and derivative analysis center on studying charts of a stock's price movement, outstanding positions and
trading volume, as opposed to focusing on a company's fundamentals and, as such, may not match with a report on a company's
fundamentals.
The information in this document has been printed on the basis of publicly available information, internal data and other reliable
sources believed to be true, but we do not represent that it is accurate or complete and it should not be relied on as such, as this
document is for general guidance only. Angel Broking Limited or any of its affiliates/ group companies shall not be in any way
responsible for any loss or damage that may arise to any person from any inadvertent error in the information contained in this report.
Angel Broking Limited has not independently verified all the information contained within this document. Accordingly, we cannot testify,
nor make any representation or warranty, express or implied, to the accuracy, contents or data contained within this document. While
Angel Broking Limited endeavours to update on a reasonable basis the information discussed in this material, there may be regulatory,
compliance, or other reasons that prevent us from doing so.
This document is being supplied to you solely for your information, and its contents, information or data may not be reproduced,
redistributed or passed on, directly or indirectly.
Angel Broking Limited and its affiliates may seek to provide or have engaged in providing corporate finance, investment banking or
other advisory services in a merger or specific transaction to the companies referred to in this report, as on the date of this report or in
the past.
Neither Angel Broking Limited, nor its directors, employees or affiliates shall be liable for any loss or damage that may arise from or in
connection with the use of this information.
Note: Please refer to the important `Stock Holding Disclosure' report on the Angel website (Research Section). Also, please
refer to the latest update on respective stocks for the disclosure status in respect of those stocks. Angel Broking Limited and
its affiliates may have investment positions in the stocks recommended in this report.
Disclosure of Interest Statement Hero Honda
1. Analyst ownership of the stock No
2. Angel and its Group companies ownership of the stock No
3. Angel and its Group companies' Directors ownership of the stock No
4. Broking relationship with company covered No
Note: We have not considered any Exposure below Rs 1 lakh for Angel, its Group companies and Directors.
Ratings (Returns) : Buy (> 15%) Accumulate (5% to 15%) Neutral (-5 to 5%)
Reduce (-5% to 15%) Sell (< -15%)
July 30 2010 12