Call Girls Colaba Mumbai ❤️ 9920874524 👈 Cash on Delivery
Graphite India 1QFY2011 Results Fall Short | Capital Goods
1. 1QFY2011 Result Update | Capital Goods
August 2, 2010
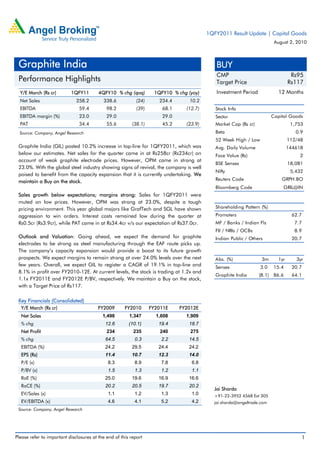
Graphite India BUY
CMP Rs95
Performance Highlights Target Price Rs117
Y/E March (Rs cr) 1QFY11 4QFY10 % chg (qoq) 1QFY10 % chg (yoy) Investment Period 12 Months
Net Sales 258.2 338.6 (24) 234.4 10.2
EBITDA 59.4 98.2 (39) 68.1 (12.7) Stock Info
EBITDA margin (%) 23.0 29.0 29.0 Sector Capital Goods
PAT 34.4 55.6 (38.1) 45.2 (23.9) Market Cap (Rs cr) 1,753
Source: Company, Angel Research Beta 0.9
52 Week High / Low 112/48
Graphite India (GIL) posted 10.2% increase in top-line for 1QFY2011, which was Avg. Daily Volume 144618
below our estimates. Net sales for the quarter came in at Rs258cr (Rs234cr) on Face Value (Rs) 2
account of weak graphite electrode prices. However, OPM came in strong at
BSE Sensex 18,081
23.0%. With the global steel industry showing signs of revival, the company is well
Nifty 5,432
poised to benefit from the capacity expansion that it is currently undertaking. We
maintain a Buy on the stock. Reuters Code GRPH.BO
Bloomberg Code GRIL@IN
Sales growth below expectations; margins strong: Sales for 1QFY2011 were
muted on low prices. However, OPM was strong at 23.0%, despite a tough
pricing environment. This year global majors like GrafTech and SGL have shown Shareholding Pattern (%)
aggression to win orders. Interest costs remained low during the quarter at Promoters 62.7
Rs0.5cr (Rs3.9cr), while PAT came in at Rs34.4cr v/s our expectation of Rs37.0cr. MF / Banks / Indian Fls 7.7
FII / NRIs / OCBs 8.9
Outlook and Valuation: Going ahead, we expect the demand for graphite Indian Public / Others 20.7
electrodes to be strong as steel manufacturing through the EAF route picks up.
The company’s capacity expansion would provide a boost to its future growth
prospects. We expect margins to remain strong at over 24.0% levels over the next Abs. (%) 3m 1yr 3yr
few years. Overall, we expect GIL to register a CAGR of 19.1% in top-line and Sensex 3.0 15.4 20.7
8.1% in profit over FY2010-12E. At current levels, the stock is trading at 1.2x and
Graphite India (8.1) 86.6 64.1
1.1x FY2011E and FY2012E P/BV, respectively. We maintain a Buy on the stock,
with a Target Price of Rs117.
Key Financials (Consolidated)
Y/E March (Rs cr) FY2009 FY2010 FY2011E FY2012E
Net Sales 1,498 1,347 1,608 1,909
% chg 12.6 (10.1) 19.4 18.7
Net Profit 234 235 240 275
% chg 64.5 0.3 2.2 14.5
EBITDA (%) 24.2 29.5 24.4 24.2
EPS (Rs) 11.4 10.7 12.3 14.0
P/E (x) 8.3 8.9 7.8 6.8
P/BV (x) 1.5 1.3 1.2 1.1
RoE (%) 25.0 19.6 16.9 16.6
RoCE (%) 20.2 20.5 19.7 20.2
Jai Sharda
EV/Sales (x) 1.1 1.2 1.3 1.0 +91-22-3952 4568 Ext 305
EV/EBITDA (x) 4.6 4.1 5.2 4.2 jai.sharda@angeltrade.com
Source: Company, Angel Research
Please refer to important disclosures at the end of this report 1
2. Graphite India | 1QFY2011 Result Update
Exhibit 1: 1QFY2011 Performance (Standalone)
Y/E March (Rs cr) FY2011 1Q FY2010 4Q % chg (qoq) FY2010 1Q % chg (yoy) FY2010 FY2009 % chg
Net Sales 258.2 338.6 (23.7) 234.4 10.2 1,131.2 1,125.9 0.5
Consumption of RM 126.8 141.3 (10.3) 105.5 20.2 417.2 380.7 9.6
(% of Sales) 49.1 41.7 45.0 36.9 33.8
Staff Costs 19.4 19.8 (2.0) 18.5 4.8 74.3 75.0 (0.9)
(% of Sales) 7.5 5.8 7.9 6.6 6.7
Other Expenses 52.7 79.3 (33.6) 42.4 24.2 261.0 438.1 (40.4)
(% of Sales) 20.4 23.4 18.1 23.1 38.9
Total Expenditure 198.8 240.4 (17.3) 166.4 19.5 752.5 893.8 (15.8)
Operating Profit 59.4 98.2 (39.5) 68.1 (12.7) 378.7 232.1 63.1
OPM 23.0 29.0 29.0 33.5 20.6
Interest 0.5 1.8 (71.7) 3.9 (86.6) 10.5 25.9 (59.6)
Depreciation 9.8 10.3 (4.1) 9.8 0.3 39.5 34.4 15.1
Other Income 2.9 2.2 30.3 15.8 (81.7) 30.6 28.9 5.8
PBT (excl. Extr. Items) 51.9 88.3 (41.2) 70.2 (26.0) 359.3 200.8 79.0
Extr. Income/(Expense) - - - - -
PBT (incl. Extr. Items) 51.9 88.3 (41.2) 70.2 (26.0) 359.3 200.8 79.0
(% of Sales) 20.1 26.1 29.9 31.8 17.8
Provision for Taxation 17.5 32.7 (46.3) 25.0 (29.8) 127.1 7.2 1,670.1
(% of PBT) 33.8 37.0 - 35.4 3.6
Reported PAT 34.4 55.6 (38.1) 45.2 (23.9) 232.2 193.6 19.9
PATM 13.3 16.4 19.3 20.5 17.2
Equity shares (cr) 17.4 17.2 15.1 17.4 15.1
EPS (Rs) 2.0 3.2 (39.0) 3.0 (33.9) 13.6 12.6 8.2
Adjusted PAT 34.4 55.6 (38.1) 45.2 (23.9) 232.2 193.6 19.9
Source: Company, Angel Research
Segment-wise performance
The graphite and carbon segment registered muted growth of 5.7% yoy to Rs212cr
(Rs201cr), mainly due to lower graphite electrode prices during the quarter. Price
drop during the quarter was higher than expectations. EBIT margins fell by a
substantial 999bp yoy to 22.3% (32.3%) during the quarter on a high base.
Sales of the power segment increased 24.9% yoy to Rs6.8cr (Rs5.4cr). The steel
segment recorded strong increase in sales of 55.1% yoy to Rs22.0cr (Rs14.2cr).
The division posted EBIT of Rs2.9cr v/s loss of Rs2.7cr in 1QFY2010. Capacity
utilisation of the division was in the range of 30-35%.
Sales of the others division grew 18.8% yoy to Rs25.5cr (Rs21.4cr). The division
recorded EBIT of Rs5.8cr, implying EBIT margins of 22.7%.
August 2, 2010 2
3. Graphite India | 1QFY2011 Result Update
Exhibit 2: Segment-wise Performance
1QFY2010 4QFY2010 1QFY2011 % chg % chg
Y/E March (Rs cr)
(Rs cr) (Rs cr) (Rs cr) (qoq) (yoy)
Total Revenue
A) Graphite & Carbon 200.5 280.8 211.8 (24.6) 5.7
B) Power 5.4 8.6 6.8 (21.4) 24.9
C) Steel 14.2 22.6 22.0 (2.7) 55.1
D) Others 21.4 32.1 25.5 (20.7) 18.8
Total 241.5 344.1 266.0 (22.7) 10.2
Less: Inter-Seg. Rev. 7.1 5.5 7.8 41.3 10.3
Net Sales 234.4 338.6 258.2 (23.7) 10.2
EBIT margin (%)
A) Graphite & Carbon 32.3 27.2 22.3 (492bp) (999bp)
B) Power 6.8 62.0 57.2 (477bp) 5,041bp
C) Steel (15.9) 8.5 13.2 470bp 2,913bp
D) Others 19.4 22.6 22.7 7bp 331bp
Source: Company, Angel Research
Sales come in below expectation
For 1QFY2011, the company logged sales growth of 10.2% yoy, below our
expectation of 13.9% growth. In 1QFY2011, the company recorded a decline in
sales after having increased consistently since 4QFY2009. However, this dip was
expected as Q1 has historically been the weakest quarter for the company.
Exhibit 3: Sales trend
450.0 Sales (LHS) yoy Growth (RHS) 80.0
400.0 60.0
350.0
40.0
300.0
(Rs cr)
250.0 20.0
(%)
200.0 -
150.0
(20.0)
100.0
50.0 (40.0)
0.0 (60.0)
2QFY09
3QFY09
4QFY09
1QFY10
2QFY10
3QFY10
4QFY10
1QFY11
Source: Company, Angel Research
OPM drops on lower prices
OPM for 1QFY2011 declined 603bp yoy to 23.0% (29.0%) primarily on the back
of lower graphite electrode prices. Prices were expected to fall by 3 -4% during the
quarter, though the actual fall was much sharper. However, going ahead, graphite
electrode prices are expected to strengthen.
August 2, 2010 3
4. Graphite India | 1QFY2011 Result Update
Exhibit 4: Margin trend
120.0 EBITDA (LHS) OPM (RHS) 45.0
40.0
100.0
35.0
80.0 30.0
(Rs cr)
25.0
(%)
60.0
20.0
40.0 15.0
10.0
20.0
5.0
0.0 -
2QFY09
3QFY09
4QFY09
1QFY10
2QFY10
3QFY10
4QFY10
1QFY11
Source: Company, Angel Research
PAT drops on lower margins
The drop in OPM took a toll on net profit, which declined 23.9% yoy to Rs34.4cr
(Rs45.2cr). It may be noted here that since 1QFY2010 net profit has been on a
consistent decline. However, this trend is expected to reverse over the next few
quarters, as the graphite electrode prices are expected to rise going ahead.
Exhibit 5: PAT trend
90.0
80.0
70.0
60.0
(Rs cr)
50.0
40.0
30.0
20.0
10.0
0.0
2QFY09
3QFY09
4QFY09
1QFY10
2QFY10
3QFY10
4QFY10
1QFY11
Source: Company, Angel Research
August 2, 2010 4
5. Graphite India | 1QFY2011 Result Update
Management call – Key takeaways
Volumes showed strong resurgence, growing by 28-30% during the quarter.
Demand traction is being witnessed on the back of robust recovery in steel
production.
Fall in the graphite electrode prices was steeper than management’s
expectation of 3-4% during the quarter. However, there are indications that
the prices may have bottomed-out. In certain cases, prices have already
started improving.
The impact of higher graphite electrode prices is expected to be felt in
2HFY2011, as orders booked now on will be due for delivery only in 3Q and
beyond.
The company’s capacity expansion program at the Durgapur facility is running
on schedule and management expects this to be completed by 3QFY2012.
The steel division is running at 30-35% capacity utilisation, which is far below
its potential. However, going ahead, utilisation of this division is expected to
improve.
Investment Arguments
GIL set to ride the industry rebound: The graphite electrodes industry is expected to
grow faster, compared to EAF steel production over the next few years, as de-
stocking of graphite electrodes inventory at the steel manufacturers' end, is
expected to reverse. Consequently, we expect graphite electrode volumes are
expected to post 17.2% CAGR over CY2009-11E. GIL, with a capacity expansion
from 78,000mt/year to 98,000mt/year, to be completed by FY2012E, is well
poised to reap the benefits of this growth. We expect GIL’s market share to
increase to 9.0% by FY2012E and top-line to increase at 19.1% CAGR over
FY2010-12E on the back of this expansion.
Strong labour cost advantage: GIL has strong labour cost advantages compared to
its global peers, as the other companies have their plants in locations where
labour costs are significantly higher compared to India. The largest global player,
SGL Carbon SE, has plants located mainly across Europe and North America.
GrafTech Ltd, the world’s second largest player, has plants located in France,
Spain, South Africa, Brazil and Mexico. In FY2009, GIL's employee cost was 9% of
sales, whereas it was almost 23% (CY2008) for SGL. Historically, GIL has passed
on a part of this advantage to gain market share. But, with the rate of market
share addition expected to slow down, we expect GIL to retain a larger part of this
cost advantage and thereby improve its margins over historical average levels.
Strong entry barriers: The global graphite electrodes industry is characterised by
high level of consolidation, with the top-6 players accounting for over 70% of the
total installed capacity in the world. The balance capacity is owned by motley of
small players. The highly consolidated nature of the industry is owing to the
barriers for the new entrants. For instance, only the top global players have the
technology to manufacture high-quality ultra high power (UHP) graphite
electrodes. The industry is marked by a relationship and referral based model. A
new entrant has to prove the quality of its products by supplying to a steel
August 2, 2010 5
6. Graphite India | 1QFY2011 Result Update
manufacturer and then get referral and word-of-mouth publicity for the products
from the manufacturer. Another barrier for the new as well as some of the existing
players is the high cost of setting up a green-field graphite electrodes
manufacturing facility.
Outlook and Valuation
We maintain our positive stance on GIL on account of revival in the global steel
production industry. Steel production increased 6% qoq in 1QFY2011.
Accordingly, graphite electrode volumes have also shown substantial
improvement. GIL recorded volume growth of 28-30% yoy. Going ahead, prices
are also expected to strengthen, as capacity utilisation levels at graphite electrode
manufacturers’ end has improved substantially.
We expect the company’s sales to increase at a CAGR of 19.1% yoy over
FY2010-12E. OPMs are expected to remain high at 24.4% in FY2011E and 24.2%
in FY2012E. PAT is expected to log CAGR of 8.1% over FY2010-12E. We expect
the company to post EPS of Rs12.3 in FY2011E and Rs14.0 in FY2012E. At current
levels, the stock is trading at 1.2x and 1.1x FY2011E and FY2012E book value,
respectively. We maintain a Buy on the stock, with a Target Price of Rs117.
Exhibit 6: One-year forward P/BV chart
140
Price 0.2x 0.5x 0.8x 1.1x 1.5x
120
100
Share Price (Rs)
80
60
40
20
0
Dec-02
Dec-03
Dec-04
Dec-05
Dec-06
Dec-07
Dec-08
Dec-09
Apr-02
Apr-03
Apr-04
Apr-05
Apr-06
Apr-07
Apr-08
Apr-09
Apr-10
Aug-02
Aug-03
Aug-04
Aug-05
Aug-06
Aug-07
Aug-08
Aug-09
Source: Company, Angel Research
Exhibit 7: Peer valuation
Company Mcap CMP P/E (x) P/BV (x) EV/EBITDA (x) RoE (%)
(Rs cr) (Rs) FY11E FY12E FY11E FY12E FY11E FY12E FY11E FY12E
Graphite India 1,753 95 7.8 6.8 1.2 1.1 5.2 4.2 16.9 16.6
HEG 1,333 311 8.2 7.1 1.6 1.3 6.2 5.6 20.3 20.2
Source: Company, Bloomberg, Angel Research
August 2, 2010 6
7. Graphite India | 1QFY2011 Result Update
Exhibit 8: Key assumptions
FY2011E FY2012E Remarks
World EAF steel production (mn MT) 393.2 417.4 Strengthening production due to global demand recovery
World graphite electrode production (MT) 695,637 723,709 Volume to improve on the back of improving steel volumes
GIL Volumes (MT) 57,329 65,471 Capacity expansion to result in improved market share
OPM (%) 24.4 24.2 OPM to remain high as realisations improve
Source: Angel Research
August 2, 2010 7
8. Graphite India | 1QFY2011 Result Update
Profit and Loss (Consolidated)
Y/E March (Rs cr) FY2007 FY2008 FY2009 FY2010 FY2011E FY2012E
Gross sales 1,171 1,388 1,558 1,394 1,693 2,009
Less: Excise duty 53.2 57.1 59.5 47.0 85.2 99.7
Net Sales 1,118 1,331 1,498 1,347 1,608 1,909
Other operating income - - - - - -
Total operating income 1,118 1,331 1,498 1,347 1,608 1,909
% chg 45.2 19.1 12.6 (10.1) 19.4 18.7
Total Expenditure 893 1,054 1,135 950 1,216 1,448
Net Raw Materials 358 468 487 480 515 611
Other Mfg costs 301 321 381 243 378 450
Personnel 117 130 135 122 158 191
Other 117 134 132 105 166 196
EBITDA 225 278 363 397 392 461
% chg 63.2 23.5 30.8 9.3 (1.2) 17.7
(% of Net Sales) 20.1 20.9 24.2 29.5 24.4 24.2
Depreciation& Amortisation 38 41 44 50 49 62
EBIT 187 237 319 347 343 400
% chg 77.1 26.4 34.9 8.7 (1.0) 16.5
(% of Net Sales) 16.7 17.8 21.3 25.7 21.3 20.9
Interest & other Charges 37 43 35 14 17 22
Other Income 131 29 25 32 32 32
(% of PBT) 46.7 13.2 8.2 8.8 9.0 7.9
Share in pft. of Associ. - - - - - -
Recurring PBT 281 223 309 365 358 410
% chg 182.4 (20.7) 38.6 17.9 (1.8) 14.5
Extraordinary Expense/(Inc.) - - 57 - - -
PBT (reported) 281 223 253 365 358 410
Tax 59 81 18 129 118 135
(% of PBT) 20.9 36.2 7.2 35.4 33.0 33.0
PAT (reported) 223 142 234 236 240 275
Add: Share of pft. of associ. - - - - - -
Less: Minority interest (MI) - - - - - -
Prior period items 75 (0) (1) - - -
PAT after MI (reported) 223 142 234 236 240 275
ADJ. PAT 147 143 236 236 240 275
% chg 118.4 (3.3) 65.5 (0.1) 1.9 14.5
(% of Net Sales) 13.2 10.7 15.7 17.5 14.9 14.4
Basic EPS (Rs) 15.1 9.6 15.1 13.7 12.3 14.0
Fully Diluted EPS (Rs) 12.5 8.0 11.4 10.7 12.3 14.0
% chg 168.2 (36.2) 43.7 (6.6) 14.7 14.5
August 2, 2010 8
12. Graphite India | 1QFY2011 Result Update
Research Team Tel: 022 - 4040 3800 E-mail: research@angeltrade.com Website: www.angeltrade.com
DISCLAIMER
This document is solely for the personal information of the recipient, and must not be singularly used as the basis of any investment
decision. Nothing in this document should be construed as investment or financial advice. Each recipient of this document should make
such investigations as they deem necessary to arrive at an independent evaluation of an investment in the securities of the companies
referred to in this document (including the merits and risks involved), and should consult their own advisors to determine the merits and
risks of such an investment.
Angel Broking Limited, its affiliates, directors, its proprietary trading and investment businesses may, from time to time, make
investment decisions that are inconsistent with or contradictory to the recommendations expressed herein. The views contained in this
document are those of the analyst, and the company may or may not subscribe to all the views expressed within.
Reports based on technical and derivative analysis center on studying charts of a stock's price movement, outstanding positions and
trading volume, as opposed to focusing on a company's fundamentals and, as such, may not match with a report on a company's
fundamentals.
The information in this document has been printed on the basis of publicly available information, internal data and other reliable
sources believed to be true, but we do not represent that it is accurate or complete and it should not be relied on as such, as this
document is for general guidance only. Angel Broking Limited or any of its affiliates/ group companies shall not be in any way
responsible for any loss or damage that may arise to any person from any inadvertent error in the information contained in this report.
Angel Broking Limited has not independently verified all the information contained within this document. Accordingly, we cannot testify,
nor make any representation or warranty, express or implied, to the accuracy, contents or data contained within this document. While
Angel Broking Limited endeavours to update on a reasonable basis the information discussed in this material, there may be regulatory,
compliance, or other reasons that prevent us from doing so.
This document is being supplied to you solely for your information, and its contents, information or data may not be reproduced,
redistributed or passed on, directly or indirectly.
Angel Broking Limited and its affiliates may seek to provide or have engaged in providing corporate finance, investment banking or
other advisory services in a merger or specific transaction to the companies referred to in this report, as on the date of this report or in
the past.
Neither Angel Broking Limited, nor its directors, employees or affiliates shall be liable for any loss or damage that may arise from or in
connection with the use of this information.
Note: Please refer to the important `Stock Holding Disclosure' report on the Angel website (Research Section). Also, please
refer to the latest update on respective stocks for the disclosure status in respect of those stocks. Angel Broking Limited and
its affiliates may have investment positions in the stocks recommended in this report.
Disclosure of Interest Statement Graphite India
1. Analyst ownership of the stock No
2. Angel and its Group companies ownership of the stock No
3. Angel and its Group companies' Directors ownership of the stock No
4. Broking relationship with company covered No
Note: We have not considered any Exposure below Rs 1 lakh for Angel, its Group companies and Directors.
Ratings (Returns) : Buy (> 15%) Accumulate (5% to 15%) Neutral (-5 to 5%)
Reduce (-5% to 15%) Sell (< -15%)
August 2, 2010 12