Downloaded 274 times

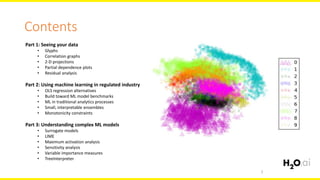
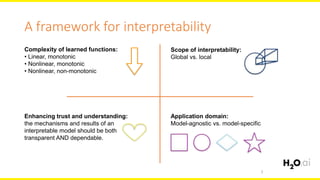

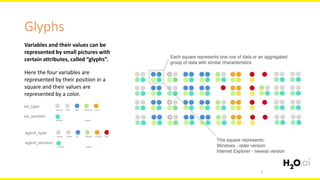
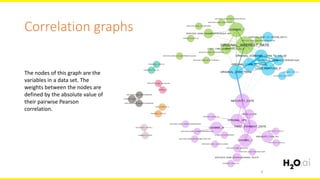


The document discusses machine learning interpretability, focusing on visualization techniques and analysis methods such as glyphs, correlation graphs, and residual analysis. It addresses the application of machine learning in regulated industries and explores understanding complex models through surrogate models, LIME, and variable importance measures. Overall, it emphasizes the importance of transparent and dependable interpretations in machine learning applications.