Download as PDF, PPTX


![And now, in 2019 (hype-free)
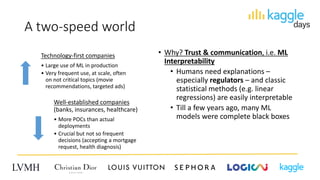
• It’s Still Early Days for Machine Learning Adoption[1]
• Nearly half (49%) of the 11,400+ data specialists who
took O’Reilly’s survey in June 2018 indicated they were
in the exploration phase of machine learning and have
not deployed any machine learning models into
production](https://image.slidesharecdn.com/kdparisalbertodanesev1-190128133307/85/Kaggle-Days-Paris-Alberto-Danese-ML-Interpretability-7-320.jpg)
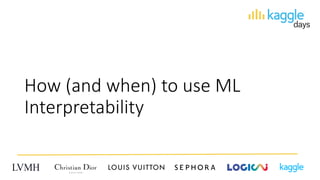
![ML interpretability besides regulation
• Husky vs. Wolf classification as in the
paper “Why should I trust you”[2]
1. The authors trained a biased classifier
(on purpose): every wolf picture had
snow in the background
2. They asked 27 ML students if they
trusted the model and to highlight
potential features (with and without
ML interpretability)
• Other areas where interpretability
matters: hacking / adversarial attacks
Is snow a key feature?
Yes, for 25 out of 27
Is snow a key feature?
Yes, for 12 out of 27](https://image.slidesharecdn.com/kdparisalbertodanesev1-190128133307/85/Kaggle-Days-Paris-Alberto-Danese-ML-Interpretability-9-320.jpg)
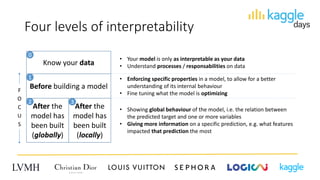
![Let’s agree on the basics
1. Interpretability: the ability to explain or to present in understandable terms to
a human[3]
2. Accuracy vs. Interpretability is a tradeoff[4], i.e. you can get:
• Accurate models with approximate explanations
• Approximate models with accurate explanations
3. Global vs. Local Interpretability[4]:
• Global: explain how the model works in predicting unseen data
• Local: explain the "reason" of a specific prediction (i.e. of a single record)
4. Model agnostic vs. model specific interpretability models](https://image.slidesharecdn.com/kdparisalbertodanesev1-190128133307/85/Kaggle-Days-Paris-Alberto-Danese-ML-Interpretability-11-320.jpg)
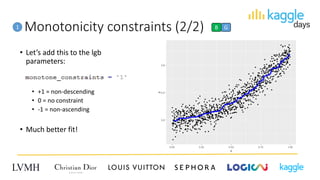
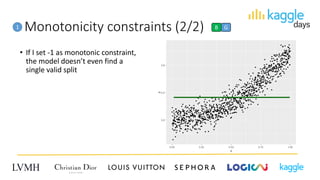
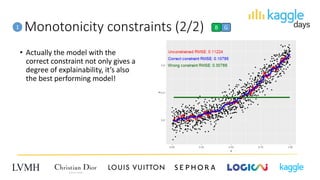
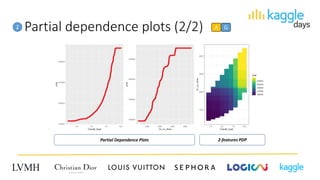
![Partial dependence plots (1/2)2 A G
• Main concepts:
• Once you have highlighted the most important features, it is useful to understand how these
features affect the predictions
• The partial dependence plots "average out" the other variables and usually represents the
effect of one or two features with respect to the outcome[7]
• PDP analysis is performed after a model has been built and is a global measure,
typically model-agnostic
• With PDP, you can say: on average, the predictions have this specific behaviour
with respect to this one variable (or two of them)](https://image.slidesharecdn.com/kdparisalbertodanesev1-190128133307/85/Kaggle-Days-Paris-Alberto-Danese-ML-Interpretability-22-320.jpg)
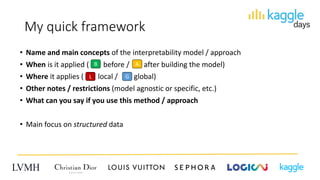
![ML Interpretability – Recap & Examples
Need Example Approach
Enforce some kind of expected
behaviour in a ML model
Real estate: floor surface vs. house price for two
identical apartments (location, quality, etc.)
Enforce monotonicity before
building a ML model
Show the effects of different
features on a specific target,
across a large population
Healthcare: most important variables that are
linked to a form of illness and what their impact is
Feature importance + PDPs
Understand a single prediction
and possibly define ad hoc
strategies based on individual
analysis
Customer churn: for each customer in the top N%
likely to churn, identify the main reason(s) and
give actionable insights to define individual
marketing campaigns[10]
LIME + Shapley
A L
A G
B G1
2
3](https://image.slidesharecdn.com/kdparisalbertodanesev1-190128133307/85/Kaggle-Days-Paris-Alberto-Danese-ML-Interpretability-27-320.jpg)

![References
• [1] https://www.datanami.com/2018/08/07/its-still-early-days-for-machine-learning-adoption/
• [2] "Why Should I Trust You?": Explaining the Predictions of Any Classifier – Marco Tulio Ribeiro, Sameer Singh, Carlos Guestrin (2016) – https://arxiv.org/abs/1602.04938
• [3] Towards A Rigorous Science of Interpretable Machine Learning – Finale Doshi-Velez, Been Kim (2017) - https://arxiv.org/abs/1702.08608
• [4] An introduction to Machine Learning Interpretability – Patrick Hall and Navdeep Gill – O’Reilly
• [5] https://github.com/dmlc/xgboost/blob/master/R-package/demo/custom_objective.R
• [6] https://medium.com/the-artificial-impostor/feature-importance-measures-for-tree-models-part-i-47f187c1a2c3
• [7] https://bgreenwell.github.io/pdp/articles/pdp-example-xgboost.html
• [8] https://christophm.github.io/interpretable-ml-book/
• [9] https://github.com/slundberg/shap
• [10] https://medium.com/civis-analytics/demystifying-black-box-models-with-shap-value-analysis-3e20b536fc80
• Icons made by Freepik from www.flaticon.com
Thank you!](https://image.slidesharecdn.com/kdparisalbertodanesev1-190128133307/85/Kaggle-Days-Paris-Alberto-Danese-ML-Interpretability-30-320.jpg)

This document discusses the importance of machine learning interpretability for enterprise adoption of ML. It begins with a brief history of AI and ML, noting that while adoption has increased, most companies are still in the exploration phase and have not deployed ML models into production. Regulators and humans require explanations for model predictions. The document then outlines different levels and approaches for ML interpretability, including enforcing constraints before building models, producing global explanations after model building using techniques like partial dependence plots, and generating local explanations for individual predictions using methods like LIME and Shapley additive explanations. It emphasizes that interpretability allows for more robust, fair and transparent models.


![Machine learning the high interest credit card of technical debt [PWL]](https://cdn.slidesharecdn.com/ss_thumbnails/machinelearning-thehighinterestcardoftechnicaldebtmeetup1-160911083514-thumbnail.jpg?width=640&height=640&fit=bounds)


![[DSC Europe 25] Raul Cruz Bonilla - Harnessing GEN AI in Fashion, Luxury and ...](https://cdn.slidesharecdn.com/ss_thumbnails/me7nvup5thwqzwzblbvw-raul-cruz-harnessing-ai-en-luxury-260123083019-32ac5a43-thumbnail.jpg?width=640&height=640&fit=bounds)


