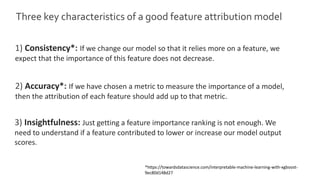
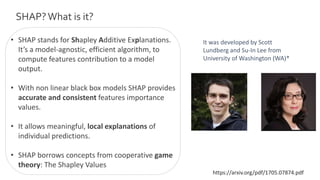
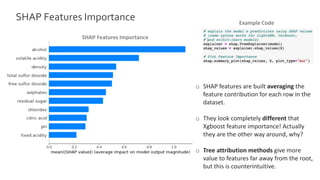
Machine Learning and computing power have made huge improvements in the last decade. It’s now possible to unlock complex problems in multidimensional space with ensemble, brute force algorithms or deep neural networks, with performances that were unthinkable a few years ago. However the use of black box models is still frown upon in a business setting. In fact the decision functions of those models are often impossible to interpret for humans, can be biased or just based on absurd assumption. What if your risk model denies loans to people on ethnic ground? SHAP comes as an innovative framework to obtain local explanations for the output of a model, making the black box much more transparent.
Unified Approach to Interpret Machine Learning Model: SHAP + LIMEDatabricks
For companies that solve real-world problems and generate revenue from the data science products, being able to understand why a model makes a certain prediction can be as crucial as achieving high prediction accuracy in many applications. However, as data scientists pursuing higher accuracy by implementing complex algorithms such as ensemble or deep learning models, the algorithm itself becomes a blackbox and it creates the trade-off between accuracy and interpretability of a model’s output.
To address this problem, a unified framework SHAP (SHapley Additive exPlanations) was developed to help users interpret the predictions of complex models. In this session, we will talk about how to apply SHAP to various modeling approaches (GLM, XGBoost, CNN) to explain how each feature contributes and extract intuitive insights from a particular prediction. This talk is intended to introduce the concept of general purpose model explainer, as well as help practitioners understand SHAP and its applications.
This was presented at the London Artificial Intelligence & Deep Learning Meetup.
https://www.meetup.com/London-Artificial-Intelligence-Deep-Learning/events/245251725/
Enjoy the recording: https://youtu.be/CY3t11vuuOM.
- - -
Kasia discussed complexities of interpreting black-box algorithms and how these may affect some industries. She presented the most popular methods of interpreting Machine Learning classifiers, for example, feature importance or partial dependence plots and Bayesian networks. Finally, she introduced Local Interpretable Model-Agnostic Explanations (LIME) framework for explaining predictions of black-box learners – including text- and image-based models - using breast cancer data as a specific case scenario.
Kasia Kulma is a Data Scientist at Aviva with a soft spot for R. She obtained a PhD (Uppsala University, Sweden) in evolutionary biology in 2013 and has been working on all things data ever since. For example, she has built recommender systems, customer segmentations, predictive models and now she is leading an NLP project at the UK’s leading insurer. In spare time she tries to relax by hiking & camping, but if that doesn’t work ;) she co-organizes R-Ladies meetups and writes a data science blog R-tastic (https://kkulma.github.io/).
https://www.linkedin.com/in/kasia-kulma-phd-7695b923/
Scott Lundberg, Microsoft Research - Explainable Machine Learning with Shaple...Sri Ambati
This session was recorded in NYC on October 22nd, 2019 and can be viewed here: https://youtu.be/ngOBhhINWb8
Explainable Machine Learning with Shapley Values
Shapley values are popular approach for explaining predictions made by complex machine learning models. In this talk I will discuss what problems Shapley values solve, an intuitive presentation of what they mean, and examples of how they can be used through the ‘shap’ python package.
Bio: I am a senior researcher at Microsoft Research. Before joining Microsoft, I did my Ph.D. studies at the Paul G. Allen School of Computer Science & Engineering of the University of Washington working with Su-In Lee. My work focuses on explainable artificial intelligence and its application to problems in medicine and healthcare. This has led to the development of broadly applicable methods and tools for interpreting complex machine learning models that are now used in banking, logistics, sports, manufacturing, cloud services, economics, and many other areas.
Understanding how high powered ML models arrive at their predictions is an important aspect of Machine Learning, and SHAP is a powerful tool that enables practitioners to understand how different features combine to help a model arrive at a prediction.
This slidedeck is from a presentation given at pydata global on the theoretical foundations of SHAP as well as how to use its library. Link to the presentation can be found here: https://pydata.org/global2021/schedule/presentation/3/behind-the-black-box-how-to-understand-any-ml-model-using-shap/
Interpretable Machine Learning describes the process of revealing causes of predictions and explaining a derived decision in a way that is understandable to humans. The ability to understand the causes that lead to a certain prediction enables data scientists to ensure that the model is consistent to the domain knowledge of an expert. Furthermore, interpretability is critical to obtain trust in a model and to be able to tackle problems like unfair biases or discrimination against particular subgroups. This talk covers an introduction to the concept of interpretability and an overview of popular interpretability techniques.
Speaker: Marcel Spitzer, inovex
Event: Kaggle Munich Meetup, 20.11.2018
Mehr Tech-Vorträge: www.inovex.de/vortraege
Mehr Tech-Artikel: www.inovex.de/blog
Achieving Algorithmic Transparency with Shapley Additive Explanations (H2O Lo...Sri Ambati
Abstract:
Explainability in the age of the EU GDPR is becoming an increasingly pertinent consideration for Machine Learning. At QuantumBlack, we address the traditional Accuracy vs. Interpretability trade-off, by leveraging modern XAI techniques such as LIME and SHAP, to enable individualised explanations without necessary limiting the utility and performance of the otherwise ‘black-box’ models. The talk focuses on Shapley additive explanations (Lundberg et al. 2017) that integrate Shapley values from the Game Theory for consistent and locally accurate explanations; provides illustrative examples and touches upon the wider XAI theory.
Bio:
Dr Torgyn Shaikhina is a Data Scientist at QuantumBlack, STEM Ambassador, and the founder of the Next Generation Programmers outreach initiative. Her background is in decision support systems for Healthcare and Biomedical Engineering with a focus on Machine Learning with limited information.
It's a well-known fact that the best explanation of a simple model is the model itself. But often we use complex models, such as ensemble methods or deep networks, so we cannot use the original model as its own best explanation because it is not easy to understand.
In the context of this topic, we will discuss how methods for interpreting model predictions work and will try to understand practical value of these methods.
A Unified Approach to Interpreting Model Predictions (SHAP)Rama Irsheidat
A Unified Approach to Interpreting Model Predictions.
Scott M. Lundberg, Su-In Lee.
Understanding why a model makes a certain prediction can be as crucial as the prediction's accuracy in many applications. However, the highest accuracy for large modern datasets is often achieved by complex models that even experts struggle to interpret, such as ensemble or deep learning models, creating a tension between accuracy and interpretability. In response, various methods have recently been proposed to help users interpret the predictions of complex models, but it is often unclear how these methods are related and when one method is preferable over another. To address this problem, we present a unified framework for interpreting predictions, SHAP (SHapley Additive exPlanations). SHAP assigns each feature an importance value for a particular prediction. Its novel components include: (1) the identification of a new class of additive feature importance measures, and (2) theoretical results showing there is a unique solution in this class with a set of desirable properties. The new class unifies six existing methods, notable because several recent methods in the class lack the proposed desirable properties. Based on insights from this unification, we present new methods that show improved computational performance and/or better consistency with human intuition than previous approaches.
[Video recording available at https://www.youtube.com/playlist?list=PLewjn-vrZ7d3x0M4Uu_57oaJPRXkiS221]
Artificial Intelligence is increasingly playing an integral role in determining our day-to-day experiences. Moreover, with proliferation of AI based solutions in areas such as hiring, lending, criminal justice, healthcare, and education, the resulting personal and professional implications of AI are far-reaching. The dominant role played by AI models in these domains has led to a growing concern regarding potential bias in these models, and a demand for model transparency and interpretability. In addition, model explainability is a prerequisite for building trust and adoption of AI systems in high stakes domains requiring reliability and safety such as healthcare and automated transportation, and critical industrial applications with significant economic implications such as predictive maintenance, exploration of natural resources, and climate change modeling.
As a consequence, AI researchers and practitioners have focused their attention on explainable AI to help them better trust and understand models at scale. The challenges for the research community include (i) defining model explainability, (ii) formulating explainability tasks for understanding model behavior and developing solutions for these tasks, and finally (iii) designing measures for evaluating the performance of models in explainability tasks.
In this tutorial, we present an overview of model interpretability and explainability in AI, key regulations / laws, and techniques / tools for providing explainability as part of AI/ML systems. Then, we focus on the application of explainability techniques in industry, wherein we present practical challenges / guidelines for effectively using explainability techniques and lessons learned from deploying explainable models for several web-scale machine learning and data mining applications. We present case studies across different companies, spanning application domains such as search & recommendation systems, hiring, sales, and lending. Finally, based on our experiences in industry, we identify open problems and research directions for the data mining / machine learning community.
Presented at #H2OWorld 2017 in Mountain View, CA.
Enjoy the video: https://youtu.be/TBJqgvXYhfo.
Learn more about H2O.ai: https://www.h2o.ai/.
Follow @h2oai: https://twitter.com/h2oai.
- - -
Abstract:
Machine learning is at the forefront of many recent advances in science and technology, enabled in part by the sophisticated models and algorithms that have been recently introduced. However, as a consequence of this complexity, machine learning essentially acts as a black-box as far as users are concerned, making it incredibly difficult to understand, predict, or "trust" their behavior. In this talk, I will describe our research on approaches that explain the predictions of ANY classifier in an interpretable and faithful manner.
Sameer's Bio:
Dr. Sameer Singh is an Assistant Professor of Computer Science at the University of California, Irvine. He is working on large-scale and interpretable machine learning applied to natural language processing. Sameer was a Postdoctoral Research Associate at the University of Washington and received his PhD from the University of Massachusetts, Amherst, during which he also worked at Microsoft Research, Google Research, and Yahoo! Labs on massive-scale machine learning. He was awarded the Adobe Research Data Science Faculty Award, was selected as a DARPA Riser, won the grand prize in the Yelp dataset challenge, and received the Yahoo! Key Scientific Challenges fellowship. Sameer has published extensively at top-tier machine learning and natural language processing conferences. (http://sameersingh.org)
Interpreting deep learning and machine learning models is not just another regulatory burden to be overcome. Scientists, physicians, researchers, and analyst that use these technologies for their important work have the right to trust and understand their models and the answers they generate. This talk is an overview of several techniques for interpreting deep learning and machine learning models and telling stories from their results.
Speaker: Patrick Hall is a Data Scientist and Product Engineer at H2O.ai. He’s also an Adjunct Professor at George Washington University for the Department of Decision Sciences. Prior to joining H2O, Patrick spent many years as a Senior Data Scientist SAS and has worked with many Fortune 500 companies on their data science and machine learning problems. https://www.linkedin.com/in/jpatrickhall
Ways to evaluate a machine learning model’s performanceMala Deep Upadhaya
Some of the ways to evaluate a machine learning model’s performance.
In Summary:
Confusion matrix: Representation of the True positives (TP), False positives (FP), True negatives (TN), False negatives (FN)in a matrix format.
Accuracy: Worse happens when classes are imbalanced.
Precision: Find the answer of How much the model is right when it says it is right!
Recall: Find the answer of How many extra right ones, the model missed when it showed the right ones!
Specificity: Like Recall but the shift is on the negative instances.
F1 score: Is the harmonic mean of precision and recall so the higher the F1 score, the better.
Precision-Recall or PR curve: Curve between precision and recall for various threshold values.
ROC curve: Graph is plotted against TPR and FPR for various threshold values.
해당 자료는 풀잎스쿨 18기 중 "설명가능한 인공지능 기획!" 진행 중 Counterfactual Explanation 세션에 대해서 정리한 자료입니다.
논문, Youtube 및 하기 자료를 바탕으로 정리되었습니다.
https://christophm.github.io/interpretable-ml-book/
An Introduction to XAI! Towards Trusting Your ML Models!Mansour Saffar
Machine learning (ML) is currently disrupting almost every industry and is being used as the core component in many systems. The decisions made by these systems may have a great impact on society and specific individuals and thus the decision-making process has to be clear and explainable so humans can trust it. Explainable AI (XAI) is a rather new field in ML in which researchers try to develop models that are able to explain the decision-making process behind ML models. In this talk, we'll learn about the fundamentals of XAI and discuss why we need to start to integrate XAI with our ML models!
Presented in Edmonton DataScience Meetup on October 2nd, 2019. Learn more: https://youtu.be/gEkPXOsDt_w
Reinforcement Learning In AI Powerpoint Presentation Slide Templates Complete...SlideTeam
Showcase how machines are built to perform intelligent tasks by using our content-ready Reinforcement Learning In AI PowerPoint Presentation Slide Templates Complete Deck. Take advantage of these artificial intelligence PowerPoint visuals, and describe how machine learning models are trained to make sequences of decisions in a complex environment. Showcase the types of artificial intelligence such as deep learning, machine learning. Explain the concept of machine learning which delivers predictive models based on the data fed into machine learning algorithms. Take the assistance of our visually attention-grabbing reinforcement learning PowerPoint templates and discuss the effective uses of artificial intelligence in various areas such as supply chain, human resources, fraud detection, knowledge creation, research, and development, etc. You can also present the usage of AI in healthcare. This includes treatment, diagnosis, training and research, early detection, etc. Explain the working of machine learning by downloading our attention-grabbing supervised learning PowerPoint presentation. https://bit.ly/3kQBnEZ
Welcome to the Supervised Machine Learning and Data Sciences.
Algorithms for building models. Support Vector Machines.
Classification algorithm explanation and code in Python ( SVM ) .
Delta Analytics is a 501(c)3 non-profit in the Bay Area. We believe that data is powerful, and that anybody should be able to harness it for change. Our teaching fellows partner with schools and organizations worldwide to work with students excited about the power of data to do good.
Welcome to the course! These modules will teach you the fundamental building blocks and the theory necessary to be a responsible machine learning practitioner in your own community. Each module focuses on accessible examples designed to teach you about good practices and the powerful (yet surprisingly simple) algorithms we use to model data.
To learn more about our mission or provide feedback, take a look at www.deltanalytics.org.
Jose Leiva, data scientist at Ets Asset Management Factory, gives an accurate and simple introduction to Machine Learning. He explains some of the problems that quantitative managers have to get alpha in the markets, and how to face them using Deep Learning.
Deep Learning: Introduction & Chapter 5 Machine Learning BasicsJason Tsai
Given lecture for Deep Learning 101 study group with Frank Wu on Dec. 9th, 2016.
Reference: https://www.deeplearningbook.org/
Initiated by Taiwan AI Group (https://www.facebook.com/groups/Taiwan.AI.Group/)
How to implement artificial intelligence solutionsCarlos Toxtli
In this presentation, we show how a novice can learn artificial intelligence and implement the basic principles in real-world solutions. There is an easy quick start guide.
The code linked to this project can be found over here => https://codesandbox.io/s/nrxn7nxlzm
After this presentation we should be able to answer these questions:
Part 1 - What is AI, how does Tensorflow.js fit in it?
Part 2 - How do I do Linear Regression in JavaScript?
Part 3 - Intro to Tensorflow.js (Tensors, Operations, Simple Model Creation)
Part 4 - Multivariate Linear Regression
Part 5 - Transfer Learning
Explore our comprehensive data analysis project presentation on predicting product ad campaign performance. Learn how data-driven insights can optimize your marketing strategies and enhance campaign effectiveness. Perfect for professionals and students looking to understand the power of data analysis in advertising. for more details visit: https://bostoninstituteofanalytics.org/data-science-and-artificial-intelligence/
Levelwise PageRank with Loop-Based Dead End Handling Strategy : SHORT REPORT ...Subhajit Sahu
Abstract — Levelwise PageRank is an alternative method of PageRank computation which decomposes the input graph into a directed acyclic block-graph of strongly connected components, and processes them in topological order, one level at a time. This enables calculation for ranks in a distributed fashion without per-iteration communication, unlike the standard method where all vertices are processed in each iteration. It however comes with a precondition of the absence of dead ends in the input graph. Here, the native non-distributed performance of Levelwise PageRank was compared against Monolithic PageRank on a CPU as well as a GPU. To ensure a fair comparison, Monolithic PageRank was also performed on a graph where vertices were split by components. Results indicate that Levelwise PageRank is about as fast as Monolithic PageRank on the CPU, but quite a bit slower on the GPU. Slowdown on the GPU is likely caused by a large submission of small workloads, and expected to be non-issue when the computation is performed on massive graphs.
2. INRIX Confidential2
• There are several definition of interpretability in the context of a
Machine Learning model. The one I like the most is Interpretability as
trust.
• Trust that the model is predicting a certain value for the “right
reasons”.
• Interpretability is key to ensure the social
acceptance of Machine Learning algorithms in
our everyday life.
Interpretability
Cause nobody wants to deal
with Carol Beer, right ?
3. INRIX Confidential3
• Often a model is as good as the insights it allows to you to gather on a
business problem, other than the prediction itself.
Why Interpretability is important…
• Being able to be transparent about the output of your model may be
required by law…think at GDPR right of explanation.
• You may want to make sure that your model is not picking up a racial,
gender or religion bias. What if your model always refuses a loan to
black people?
• Your model might be predicting the right thing, for a completely wrong
reason! Want an example? Go the the next slide.
4. INRIX Confidential4
• It’s possible to build a model that is very accurate, but it loses its power if we are unable to explain
why a certain prediction was issued.
• In the Husky vs Wolves experiment
researchers built an image recognition
model that could correctly classify a
Husky from a Wolf with very high
accuracy.
• However, after using an explanation
method researchers found out that
this was due to all wolves having a
snowy background!
• Would you trust this model?
*https://arxiv.org/pdf/1602.04938.pdf
Would you trust this model?
5. INRIX Confidential5
Interpretability in practice.
A Machine Learning model works with a set of features in a
multi dimensional space with the objective to minimize a
function or maximizing a likelihood.
It’s like a game, with a set of players (our players) trying to
reach an objective (a correct prediction). We need to able to
understand which players contributed the most to the
objective.
6. INRIX Confidential6
Ok, ok I got this…in fact, when it’s possible I always plot
features importance, to see which variable my model used the
most to issue predictions.
A possible solution…
Isn’t that enough?
8. Three key characteristics of a good feature attribution model
1) Consistency*: If we change our model so that it relies more on a feature, we
expect that the importance of this feature does not decrease.
2) Accuracy*: If we have chosen a metric to measure the importance of a model,
then the attribution of each feature should add up to that metric.
3) Insightfulness: Just getting a feature importance ranking is not enough. We
need to understand if a feature contributed to lower or increase our model output
scores.
*https://towardsdatascience.com/interpretable-machine-learning-with-xgboost-
9ec80d148d27
9. What about consistency?
Let’s take two simple models to estimate if a person has flu symptoms…This model
classifies each observation perfectly.
*https://towardsdatascience.com/interpretable-machine-learning-with-xgboost-9ec80d148d27
10. Step 1: Before doing any split we could assign a mean
score of 20 to each of the 4 observations.
MSE = (((0-20)**2) + ((0-20)**2) + ((0-20)**2) + ((80-
20)**2) ) = 1200
Imagine that we have 4 observations and that they all
finish in the correct leaf. We use Mean Squared Error as
a metric.
Consistency
*https://towardsdatascience.com/interpretable-machine-learning-with-xgboost-9ec80d148d27
11. Step 2: We use ‘Fever’ to split the data, two observations go
to the right, two to the left.
MSE = (((0-0)**2) + ((0-0)**2) + ((0-40)**2) + ((80-40)**2) )
= 800
MSE has dropped from 1200 to 800. We attribute 400 to
feature Fever.
Consistency
Imagine that we have 4 observations and that they all
finish in the correct leaf. We use Mean Squared Error as
a metric.
*https://towardsdatascience.com/interpretable-machine-learning-with-xgboost-9ec80d148d27
12. Step 3: We introduce the feature ‘Cough’ and we finally
assign each observation to the correct leaf.
MSE = (((0-0)**2) + ((0-0)**2) + ((0-0)**2) + ((80-80)**2) ) =
0
MSE has dropped from 800 to 0. We attribute 800 to
feature Cough.
Imagine that we have 4 observations and that they all
finish in the correct leaf. We use Mean Squared Error as
a metric.
Consistency
*https://towardsdatascience.com/interpretable-machine-learning-with-xgboost-9ec80d148d27
13. Features near the root of tree should be more important, for the greedy way trees are built. When
Cough is promoted to a upper level in model B importance actually decreases! Hence the inconsistency in
the method.
Consistency, where is the problem?
*https://towardsdatascience.com/interpretable-machine-learning-with-xgboost-9ec80d148d27
15. INRIX Confidential15
• SHAP stands for Shapley Additive Explanations.
It’s a model-agnostic, efficient algorithm, to
compute features contribution to a model
output.
• With non linear black box models SHAP provides
accurate and consistent features importance
values.
• It allows meaningful, local explanations of
individual predictions.
• SHAP borrows concepts from cooperative game
theory: The Shapley Values
SHAP?What is it?
It was developed by Scott
Lundberg and Su-In Lee from
University of Washington (WA)*
https://arxiv.org/pdf/1705.07874.pdf
16. INRIX Confidential16
• Shapley values are a concept in cooperative game theory. They where introduced
in 1953 by the Nobel Prize winner Lloyd Shapley, one of the fathers of Game
Theory*.
• The overall intuition behind the concept is that sometimes a player value in a team
could be greater than their value if they were on their own.
• In a Machine Learning setting a Shapley value is “the contribution of a feature
value to difference between the actual prediction and the mean prediction”…
• …which is equivalent to answer this question: “Given that without any features we
would just predict an average value, once we bring the first feature in how much
our prediction changes compared to the average?”
ShapleyValues
https://en.wikipedia.org/wiki/Shapley_value
17. 1) Given a set N of players I, each of which can be attributed a value
3) We then calculate the marginal contribution given by that feature in the following way:
4) Where R is an ordering, given by permuting the values in set N, and is the set of a players
preceding i in the order R.
Set of features
preceding i in
order R, including i
Set of features
preceding and
excluding i
2) We calculate a set of permutations R of N.
Let’s start with the Math
18. A moment of Calm
This is easier than what it looks like…
19. V ( ) = 10
V ( ) = 27+
V ( ) = 35+
V ( ) = 25+
V ( ) = 9
V ( ) = 8
V ( ) = 45+ +
Order R Yoda Contribution* Obi Contribution* Luke Contribution*
Y, O, L V(Y) = 10 V(O, Y) – V(O) = 35 – 9 = 26 V(L, O, Y) – V(O, Y) = 45 – 35 = 10
Y, L, O V(Y) = 10 V(O, L, Y) – V(L, Y) = 45 – 27 = 18 V(L, Y) – V(Y) = 27 – 10 = 17
O, Y, L V(Y, O) – V(O) = 35-9 = 26 V(O) = 9 V(L, O, Y) – V(O, Y) = 45 – 35 = 10
O, L, Y V(Y, L, O) – V(L, O) = 45 – 25 = 20 V(O) = 9 V(L, O) – V(O) = 25 – 9 = 16
L, Y, O V(L,Y) – V(L) = 27 – 8 =19 V(O, L, Y) – V(L, Y) = 45 – 27 = 18 V(L) = 8
L, O, Y V(Y, L, O) – V(L, O) = 45 – 25 = 20 V(O, L) – V(L) = 25 – 8 = 17 V(L) = 8
* Marginal Contributions
Some friends may help explaining this…
Our Coalition Our Objective
Kill Vader
Algorithm
i. Calculate all possible coalitions permutations.
ii. For each permutation take the set of players
preceding our target Jedi.
iii. Include the target Jedi in this subset
iv. Then subtract the contribution of the subset
excluding the target Jedi
20. Initial Value Payout (SHAP Value)
10 10 + 10 + 26 + 20 + 19 + 20 = 17,5
9 26 + 18 + 9 + 9 + 18 + 17 = 16,2
8 10 + 17 + 10 + 16 + 8 + 8 = 11.5
So what? …After calculating each player marginal contributions* we realize that although Luke is 20%
weaker the contributed 34% less than Yoda. Obi in terms of contribution is much closer to Yoda!
*”The Shapley value can be misinterpreted. The Shapley value of a feature value is not the difference of the predicted value after removing the feature from the model training. The
interpretation of the Shapley value is: Given the current set of feature values, the contribution of a feature value to the difference between the actual prediction and the mean
prediction is the estimated Shapley value” (https://christophm.github.io/interpretable-ml-book/shapley.html#general-idea)
Now we can calculate the payout for each Jedi
21. Dataset
o I have used a Wine Quality* dataset for this talk.
o 12 features for 6.5k observations of Portuguese Vinho
Verde from several different producers.
o For each row we have a quality score from 1 to 10.
o We have converted the problem to a binary classification
exercise where 1 is a score is quality from 6 to 10, whilst 0 is
quality from 0 to 5 (included)
Vinho verde is a unique product from the Minho
(northwest) region of Portugal. Medium in alcohol,
is it particularly appreciated due to its freshness
(specially in the summer). More details can be
found at: http://www.vinhoverde.pt/en/
*P. Cortez, A. Cerdeira, F. Almeida, T. Matos and J. Reis. Modeling wine preferences by
data mining from physicochemical properties. In Decision Support Systems, Elsevier,
47(4):547-553, 2009.
22. Model Feature Importance
o We used Xgboost to train a classifier for
this dataset.
o We get feature importance at a global
level, but insightfulness is quite low.
o We see that ‘Total Sulfur Dioxide’ is the
most important feature, but how can
we tell whether it tends to trigger a 0 or
a 1?
Example Code
23. SHAP Features Importance
o SHAP features are built averaging the
feature contribution for each row in the
dataset.
o They look completely different that
Xgboost feature importance! Actually
they are the other way around, why?
o Tree attribution methods give more
value to features far away from the root,
but this is counterintuitive.
SHAP Features Importance
Example Code
24. SHAP Local Explanations
o With SHAP we are able to get local explanations by using the
Force plots.
o Those tell us how much each feature contributed to make the
prediction diverge from a base value. This is the reference value
that the feature contributions start from*.
o We can see that a low level of ‘total sulfur dioxide’ (mean is 30)
pushes the output towards a positive prediction, while the level
of sulphates makes it go in the opposite direction.
Example Code
Force plot doc string:https://github.com/slundberg/shap/blob/master/shap/plots/force.py
25. Example Code
SHAP Local Explanations
o Here we have a negative case, with a total shap value much
lower than the baseline
o Low level of alcohol, high volatile acidity, density and chlorides
push the boundaries to a negative prediction.
o Only feature that pushes the score up is a decent level of total
sulfur dioxide…I totally wouldn’t want to drink this bottle.
26. SHAP Summary Plots
o Summary plots are powerful tools to
gain insights. They summarize features
contribution for all the rows.
o And to my experience they are easy to
understand for business people (skilled
ones) too!
o Here a high level of alcohol pushes
predictions to a ‘High Quality’, whilst the
opposite happens with low levels.
o Low volatile acidity means high quality,
the opposite happen when acidity is
high.
Example Code
SHAP Summary plot
27. SHAP Partial Dependence Plots
o Partial dependence plots let us visualize
a feature shap values in relation to the
actual values. Can you see the non linear
negative contribution increase when
acidity increases?
o And more complex analysis can be made
by adding up an interaction feature.
Here we can see how high level of
sulphates compensate for high level of
acidity.
Example Code
28. References
• Shap Paper: https://arxiv.org/pdf/1705.07874.pdf
• Article of Scott Lundberg presenting SHAP: https://towardsdatascience.com/interpretable-machine-learning-
with-xgboost-9ec80d148d27
• Article by Edward Ma on Shapley Values: https://towardsdatascience.com/interpreting-your-deep-learning-
model-by-shap-e69be2b47893
• Book on model Interpretability : https://christophm.github.io/interpretable-ml-book/shapley.html#general-idea
• Shap Github page: https://github.com/slundberg/shap/tree/master/shap/plots
• Wikipedia on Shapley values: https://en.wikipedia.org/wiki/Shapley_value